
Abstract
The presence of bubbles in liquid samples residing in microplate wells causes inaccuracies in fluorescence measurements. In addition, pipetting errors, if not adequately managed, can result in misleading data and wrong interpretations of assay results, particularly in the context of high-throughput screening. In this work, the authors describe an adapted design to the capillary wells microplate approach that permits side viewing. They demonstrate a prototype that detects bubbles and pipetting errors during actual assay runs to ensure accuracy in screening.
Introduction
M
Fluorescence measurements have been used extensively in protein formulation and characterization studies 3 and are the method of choice in high-throughput screening (HTS) due to high sensitivity and speed. 4,5 Proteins that contain the amino acids tryptophan, tyrosine, and phenylalanine are intrinsic fluorescence assays, whereas specific fluorescent probes can give additional information about the protein conformation or, more important, on drug-protein and protein interactions. Fluorescent detection can be accomplished either by nonimaging 6,7 or imaging modes. 8 Recent interest in image-based detection is centered on advantages of (1) improved throughput, (2) parallel acquisition, (3) flexible resolution, (4) obviation of specimens to be located in fixed locations, and (5) adaptable incorporation into existing microscopes. With imaging, lenses with low magnification typically have low numerical aperture. Consequently, the effects of point spread function and liquid meniscus of small liquid volumes on standard microplates conspire to affect the intensity readings. We have recently demonstrated that the capillary wells microplate design overcomes this limitation. 9
Two other practical factors act to significantly affect instrumentation readings, notwithstanding whether microplates with standard or capillary wells are used. One is the presence of bubbles in the sample. A source of this arises from cavitation wherein a liquid that is pumped or moved too quickly drops below its vapor pressure to assume a gaseous state. In liquid handling systems, this usually occurs when pipetting highly viscous fluids. Another source is low wettability. Surface wettability is a measure of how easily a liquid spreads on a surface and is related to the angle the contact edge makes with the surface. Low wettability means that bubbles can be easily entrained in a sample fluid. Bubbles can also develop when a soapy reagent is used, for example, in assays where detergents are added for optimal enzymatic activity. 10 Bubble formation is an inevitable artifact when sample mixing is needed in the context of both standard and capillary well microplates. 11,12 The deleterious effect of bubbles on microplate measurement is well known, and the fact that they can accumulate at the top surface of the liquid in the form of foams exacerbates the problem when fluorescence measurements are required. Not surprisingly, assay preparation protocols typically advocate gentle handling 13 or centrifuging 14 to mitigate bubble presence. Heating has also been reported, 15 albeit sample damage with temperature is a possibility.
The ability to deliver precise amounts for assays is crucial for accurate screening. Pipetting errors, if not adequately managed, can result in wrong deductions made from assays, particularly in the context of HTS. 16,17 The use of photometric and gravimetric measures from assay reactions with attendant software analysis is one approach that has been proposed to detect the presence of pipetting error. 18,19 These are essentially based on periodic test runs from which pipetting problems are meant to be picked up. No schemes hitherto reported, to the best of our knowledge, permit pipetting errors to be detected during actual assay runs.
Here, we describe an adapted capillary wells microplate design that detects errors arising from bubbles and pipetting errors during actual assay runs. This adapted design (see
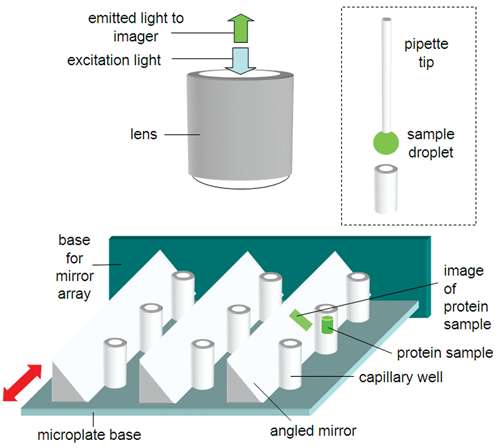
Schematic description of the proposed capillary wells microplate method, which permits side optical viewing of the wells. The red arrows show the direction of movement for sliding in or removing the fingers of angled mirrors to image the sides of the capillary wells.
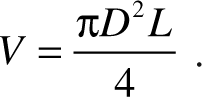
Typically, excitation light can be delivered through the lens or via a line-scanning approach. 20 Liquid samples are delivered via an automated or manual pipette in the form of droplets, which is drawn into the wells using the capillary effect as detailed previously. 2 The volume V that fills each well is related to the length L and internal diameter D via
Differentiating and rearranging gives
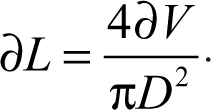
Equation (2) indicates that for small values of D, any volumetric error results in large variation in the registered liquid length. Hence, the use of capillary wells, in which the internal diameter is generally small, permits sensitive detection of volumetric error from pipetting.
Materials and Methods
The experimental sample used was enhanced green fluorescent protein (EGFP), isolated from genetically modified Escherichia coli and purified by chromatography. After elution of the proteins from the chromatographic matrix, the sample was then dialyzed into Tris-Cl (pH 8.0), checked for purity by sodium dodecyl sulfate–polyacrylamide gel electrophoresis (SDS-PAGE), and quantified using the bicinchoninic acid (BCA) protein assay (Pierce, Rockford, IL).
A series of dilutions of the purified EGFP sample from 10 to 100 ng/µL were prepared for the experiments. These solutions were delivered into capillary wells of internal diameter 0.2 mm using a manual pipetter (model: Eppendorf Research® pipettes, 0.1-2.5 µL). For side view access, the material of the wells has to be transparent. In our case, the material used was polymethyl methacrylate (PMMA), a transparent thermoplastic. The mirror used should be front faced to avoid “ghost” double images as would be caused by a normal “looking glass” mirror. The sample was illuminated using excitation light of 488-nm wavelength and imaged with a camera under a 1× magnification lens with a 526-nm wavelength bandpass optical filter having 0.25-nm resolution. The 488-nm wavelength was selected to be as close as possible to the emission peak of EGFP, which was 509 nm. The digital images were analyzed using Image J. The volume of sample pipetted into each well was determined by measuring the length of the liquid column and equation (1). In correlating recorded intensity to protein concentration, a series of 5 points along the liquid in the well was sampled at regions away from the top liquid surface of the capillary.
Results
A picture of a prototype created of the capillary wells microplate with side optical access is given in
Prototype of a capillary wells microplate with optical side access capability.
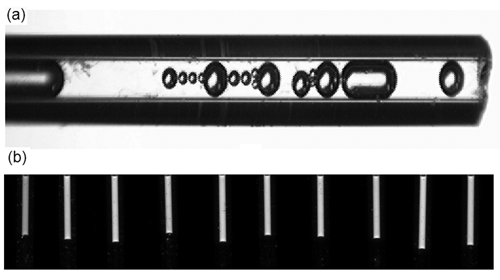
An example magnified image (
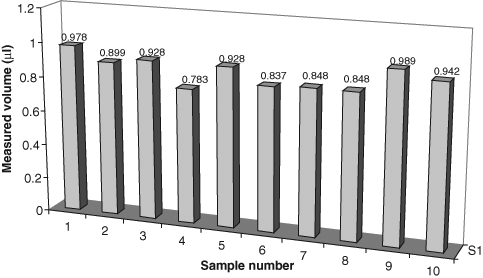
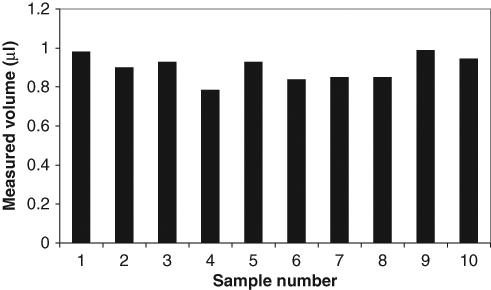
Plot of volumes of the samples dispensed into capillary microplate wells (from
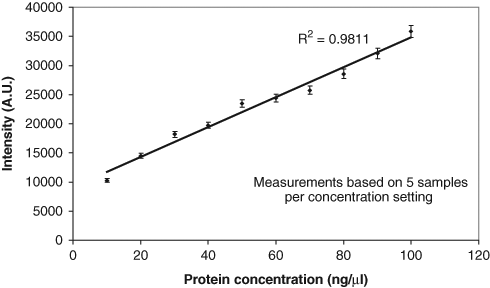
Plot of intensity against protein concentration for the samples in
Discussion
It is clear that bubbles such as that indicated in
From
The increasing intensity with concentration result in
We make mention of a few additional issues that support the approach described here from an HTS viewpoint. The method was demonstrated using capillary wells made from PMMA, a material that lends easily to mass production efforts. In addition, the mirrors do not need to be specially fabricated, wherein metal mirrors (or sometimes called reflective aluminum) that are cost-effective may be used. They are highly reflective (97% reflectance in the visible range) and readily available in sheet form at a range of thicknesses that can be cut to various shapes. Operations to determine the volume to check for pipetting errors, obtain measurements of intensity that correlate to protein concentration, and detect the presence of bubbles can be automated via analysis methods from digital images without any additional hardware. The first two are relatively easy to handle, whereas the third, depending on the level of information required, can be adapted from algorithms previously reported. 21 In screening, some assays can have long incubation times that run into periods of days. 22 The ability to detect bubbles and pipetting error at the outset allows for decisions to abandon or accept readings to be made at an early stage. This will help to reduce the wastage in time and cost associated with processing assays that are not useful. Assays with long incubation times can also present problems with sample loss through evaporation if the process conditions are not well controlled. 23 The side access facility allows for on-demand monitoring of the sample volume to provide the feedback needed for remedial actions to be taken.
The approach described here will clearly work best with platforms that rely on the imaging of optical events (i.e., fluorescence) to characterize samples. In this case, there is complete synergy between the bubble and pipetting error detection features with assay measurement. Nevertheless, platforms based on acoustic resonance, electrical impedance, microcantilevers, nanowires, and differential calorimetry are beginning to appear. 23 Although the capillary wells approach, which has the distinct advantage of reducing the positional precision required, will remain useful regardless of the platform, the side view access feature will be an added instrumentation with nonoptical platforms. Nevertheless, optical platforms are the widest used in screening. From this point of view, the innovation offered here remains highly significant, notwithstanding that a redesign of the detection aspect in the instrumentation will be needed. Last, we point out that the prototype developed currently does not conform to the standard stipulated for microplates. Naturally, developments can be done to make it more adherent to the standard for universal compliance (see ANSI/SBS 1-2004, 2-2004, 3-2004, 4-2004).
Conclusion
We have described an adapted capillary wells microplate design that permits side viewing. This design allows the presence of bubbles in liquid samples residing in microplate wells, which can cause inaccuracies in fluorescence measurements, to be detected during actual assay runs. In addition, it is able to determine pipetting errors during de facto assay runs, which, if not adequately managed, can result in wrong deductions made from assays, particularly in the context of HTS. The method is simple to implement in which highly automated procedures can be incorporated.
Footnotes
Acknowledgements
Portions of this work were made possible for members of the Laboratory for Optics, Acoustics and Mechanics by funding from the Australian Research Council Discovery Project DP0878454.