
Abstract
The integration of high-content screening (HCS) readers with organ-specific cell models, panels of functional biomarkers, and advanced informatics is a powerful approach to identifying the toxic liabilities of compounds early in the development process and forms the basis of “early safety assessment.” This cellular systems biology (CSB™) approach (CellCiphr® profile) has been used to integrate rodent and human cellular hepatic models with panels of functional biomarkers measured at multiple time points to profile both the potency and specificity of the cellular toxicological response. These profiles also provide initial insights on the mechanism of the toxic response. The authors describe here mechanistic assay profiles designed to further dissect the toxic mechanisms of action and elucidate subtle effects apparent in subpopulations of cells. They measured 8 key mechanisms of toxicity with multiple biomarker feature measurements made simultaneously in populations of living primary hepatocytes and HepG2 cells. Mining the cell population response from these mechanistic profiles revealed the concentration dependence and nature of the heterogeneity of the response, as well as relationships between the functional responses. These more detailed mechanistic profiles define differences in compound activities that are not apparent in the average population response. Because cells and tissues encounter wide ranges of drug doses in space and time, these mechanistic profiles build on the CellCiphr® profile and better reflect the complexity of the response in vivo.
Keywords
Introduction
H
The cellular information generated by applying HCS methods to early safety assessment is critical to address the complex biology triggered by potentially harmful molecules in cells of target organs. A detailed understanding of the mechanisms underlying these cellular toxicological responses can be valuable before progressing lead series compounds into time-consuming and expensive animal tests. The goal of integrating cellular toxicology models with HCS detection is to generate a platform that can both predict the safety risk liability of a compound with high specificity and sensitivity while also identifying mechanism(s) of action of the toxic response.
In the past decade, there has been important progress toward the development of tools for early safety assessment that take advantage of the strengths of HCS. The first was the cell health profiling assay developed at Cellomics and derived from early research at Parke-Davis. 2 A retrospective study from Pfizer 3 used HepG2 cells and reported that data from their HCS model when divided by the Cmax produced a therapeutic index value that was a better “predictor” of clinical outcome than animal models but did not deliver an automated classification methodology. Furthermore, the method was based on measuring the well-average response of HepG2 cells. The authors state that a limitation of fitting cell-based assay data to calculate AC50 values as reported in the article is that many compounds exhibit complex concentration-dependent response curves that are difficult to fit using sigmoidal response models. More recently, Xu et al. 4 reported an HCS model using live-cell assays of human primary hepatocytes at a single concentration of 30 times Cmax, coupled with a classification methodology that attained improved predictivity of clinical outcome. The predictivity demonstrated in these studies clearly shows the potential for HCS in safety assessment, but the HCS models used provide very little insight into the cellular mechanisms associated with the toxicity. The use of Cmax in the models illustrates the need for understanding toxicity relative to efficacy or exposure level (e.g., Cmax) but limits the applicability to later stages of development because the Cmax is typically not determined until clinical trials.
Recently, these initial approaches to early safety assessment have been strengthened by implementing a cellular systems biology (CSB™) approach that integrates both rodent and human cellular models with an expanded panel of functional biomarkers measured at multiple time points and doses.
5
This enables profiling of both the potency and specificity (or lack thereof) of the cellular toxicological response. These more detailed CellCiphr® panels also provide insights on the mechanism of the toxic response (
(
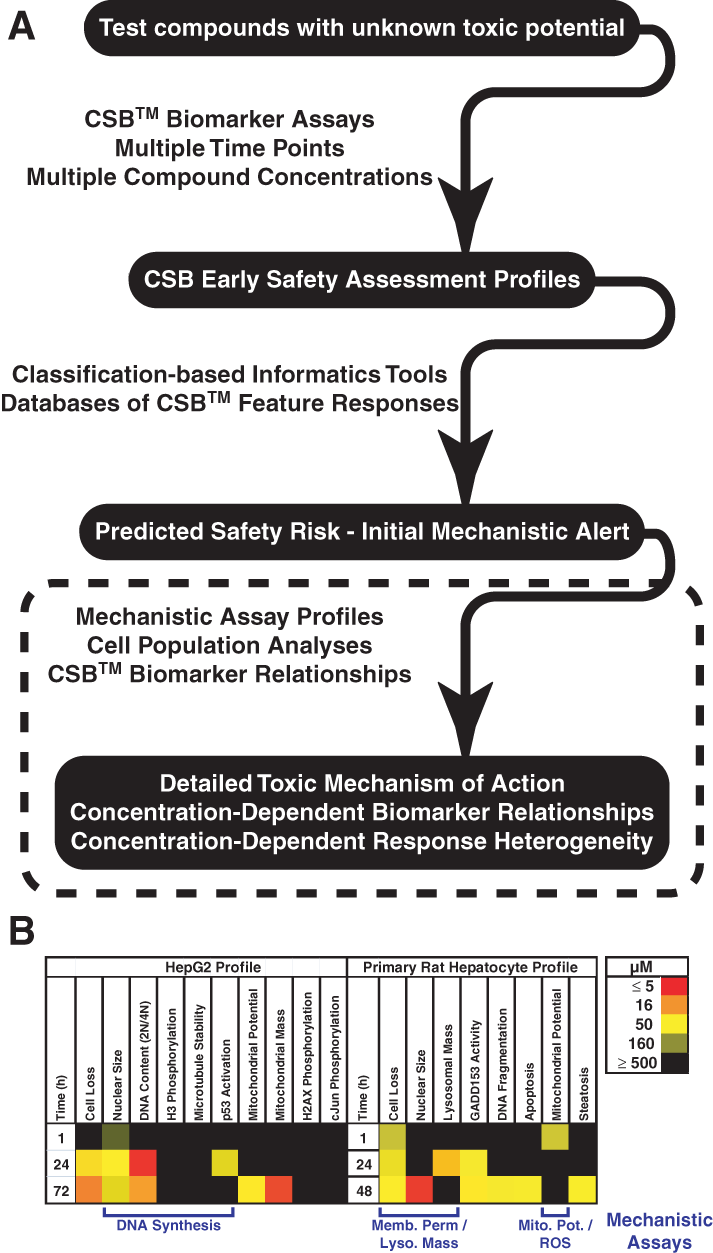
This article describes focused mechanistic assay profiles that can be used to dissect in greater detail the toxic mechanisms initially flagged by the predictive CellCiphr® profiles (
We also demonstrate how the databases built from these mechanistic profiling assays were analyzed at high resolution using cell population analysis tools developed to take advantage of the massive amount of single-cell response data, which typically remain virtually hidden in large HCS-derived databases. 6 These mining tools were used to show that the concentration of several of the compounds in the set manipulated the heterogeneity of the cellular response, as well as biomarker relationships.
Revealing the heterogeneity of cell population responses to toxic insult takes further advantage of the strengths of HCS by providing an even richer activity database from which new knowledge on the mechanisms of the toxic response could be extracted. In our nomenclature, we refer to a change in the shape of cell population distribution as a measure of cellular response heterogeneity, which includes cases where the main population distribution becomes broadened and where multiple distinct subpopulations are created, merged, or respond differentially. The importance of addressing cellular heterogeneity is based on the following considerations: (a) fundamental models of cellular systems include the notion of complexity and ordered heterogeneity as obvious and intrinsic to the living state, 7 (b) cellular population distributions in the untreated and treated states are not approximated well as normal distributions and that measures of cell population distribution shape changes have been useful in quantifying HCS-derived cellular responses to chemical perturbation, 8,9 (c) addressing with heterogeneous responses with these new tools provides a means for differentiating random and meaningful variations in cellular models of behavior, 10 and (d) hepatocytes in culture exhibit heterogeneous expression of cytochrome P450 subtypes that reflect the existing phenotypic heterogeneity of cytochrome P450 expression in liver. 11 Furthermore, measuring the magnitude and heterogeneity of biomarker feature relationships in the same cell populations better defines the unique and complex molecular response profile elicited by pharmacological agents.
This process of drilling down to discover mechanistic relationships supplements the initial conclusions of the CellCiphr® profile and the correlations derived from it. In addition to providing new information on toxic mechanism of action, we envision that the mechanistic profiling approach described here will form the basis of next-generation safety assessment.
Materials and Methods
Chemical compounds
Chemical compounds were obtained from Sigma-Aldrich Chemical Company (St. Louis, MO) and suspended in DMSO at 100 times the final concentration used to treat cells. The following compounds were used to treat cells at a maximal concentration of 500 µM in the mechanistic profiling assays: antimycin A, p-benzoquinone, captopril, carbonyl cyanide 3-chlorophenyl hydrazone (CCCP), clotrimazole, enalapril, gemfibrozil, irinotecan, 2-methoxyestradiol, mifepristone, miltefosine, nefazodone, pimozide, retinoic acid, resveratrol, rotenone, SN38, and tacrine. Cells were treated in the mechanistic profiling assays below with 10-point titrations of the compounds using a 2-fold dilution series from the maximal concentration. In some cases, compounds were partially soluble at the higher concentrations.
Cell preparation and culture
The human hepatocellular carcinoma cell line HepG2 (HB-8065), used for the BrdU incorporation assay, was purchased from ATCC (Manassas, VA) and cultured in standard minimum essential medium (MEM) plus 25 mM HEPES. To obtain consistent BrdU incorporation, it was important to keep the cells as separate on the substrate as possible and in log phase growth. This was accomplished by trypsinizing subconfluent cultures and triturating them 3 times through a 20G needle every 2 days. For assay, HepG2 cells were trypsinized and triturated 3 times through a 20G needle before plating at a density of 6000 cells per well (25 µL) in rat tail collagen I–coated 384-well microplates (Falcon #3962). Cells were allowed to attach and spread for 30 min at room temperature before being placed in a humidified 5% CO2 incubator at 37°C for 18 to 24 h before the addition of test compounds. At this time point, the cells covered the entire well surface, but the BrdU results were consistent with the cells being nonquiescent and still actively replicating their genomic DNA (40%-50% of cells incorporating BrdU).
Rat primary hepatocytes were prepared using the method of Berry et al. 12 The cells were purified by centrifuging the cells in 45% (v/v) Percoll for 10 min at 125 g at 4°C. The resulting pellet was resuspended in culture medium composed of MEM containing 10% fetal bovine serum (FBS), 25 mM HEPES, 10 µg/mL insulin, and 1 µM dexamethasone. Hepatocytes prepared this way routinely consist of cells with 85% to 95% viability. Rat hepatocytes were plated at a density of 10,000 cells per well (25 µL) in rat tail collagen I–coated 384-well microplates, allowed to settle for 30 min at room temperature, and then placed in a humidified 5% CO2 incubator at 37°C for 0.5 to 3 h before the addition of compounds.
Diluted test compound solutions (25 µL) were added to each well at the indicated final concentrations. The final concentration of DMSO in each well was 1% (v/v).
Cell analysis and data visualization
For all assays, cells were analyzed at room temperature using an ArrayScan VTI HCS Reader in the high-resolution mode with a 10×/0.45 NA objective and a 0.63× coupler. The HEPES-buffered medium enabled the cell medium in the sealed plates to maintain a relatively constant pH for the 30 to 45 min analysis time. Furthermore, we consistently monitored the response of the control wells in the 4 corners of the 384-well plates to ensure plate-wide consistency. The time for plate analysis had potentially the greatest effect on the compound-treated samples for the 1-h time point. However, the data in
For the fixed-cell DNA synthesis assay, data from either 4 fields per well or 1200 cells/well were collected, whichever came first. For the live-cell assays, 1 field per well was imaged and analyzed. Algorithmic data extraction from the images is detailed in the description of each assay below. To visualize changes in the population distributions of cells, we used static and animated distribution maps and cell maps. 6 Briefly, distribution maps were color encoded to show low population densities as cooler blue and yellow colors and high population densities in red. Cell maps provided detailed information on the relationships between biomarker features and used the same color-encoding method. Cell maps therefore provided more information on the heterogeneity of the cell population response as well as concentration-dependent toxic mechanisms compared to visualization via commonly used population average responses of one feature at a time.
DNA synthesis assay measured as BrdU incorporation
Two hours after the addition of test compounds to HepG2 cells, 25 µL of a BrdU solution in MEM was added to each well of the microplate to give a final concentration of 100 µM. The cells were incubated for an additional hour at 37°C (3 h total incubation after addition of test compounds). The cells were fixed by adding 25 µL/well of a concentrated formaldehyde solution to give a final concentration of 3.7% (v/v). Wells were rinsed twice with 95 µL/well Hank’s balanced salt solution (HBSS). Cells were then extracted with a solution (50 µL/well) containing 0.5 M HCl and 0.5% Triton X-100 (in HBSS) for 10 min at room temperature. After washing the cells 4 times with HBSS (95 µL/well), cells were incubated for 1 h with a 1:200 dilution of mouse anti-BrdU (sc-32323; Santa Cruz Biotechnology, Santa Cruz, CA) solution in HBSS (10 µL/well). Cells were washed twice with HBSS and incubated for 1 h in a solution (10 µL/well) containing a 1:200 dilution of Cy5-donkey-antimouse IgG (Jackson ImmunoResearch Laboratories, West Grove, PA) and 5 µg/mL Hoechst 33342. Nuclear texture values for the labeled BrdU were used to quantify the effects that test compounds had on DNA synthesis. A nuclear mask was built from the Hoechst 33342–labeled nuclei and applied to the BrdU image. The nuclear texture under the BrdU mask was defined by the variance of the pixel intensity values.
Mitochondrial potential and reactive oxygen species generation combined time course assay
To measure mitochondrial potential changes and reactive oxygen species (ROS) generation in the same cell population, we used a combination of 2 dyes: 3,3′-Dihexyloxacarbocyanine iodide (DiOC6) 13 and dihydroethidium (DHE). Changes in rat hepatocyte mitochondrial potential were similar whether measured with tetramethylrhodamine ethyl ester (TMRE) or DiOC6 (data not shown). Cells were labeled with dye reagents at various time points (1-5 h) after treatment with test compounds was initiated. A 3-fold concentrated solution containing Hoechst 33342 (15 µg/mL), DiOC6 (3 µM), DHE (9 µM), and TARARAF (6% [v/v]) 14 in MEM was added to the microplate (25 µL/well) 30 min before the end of an experiment. The microplate was then sealed, equilibrated, and read as above on the HCS reader. Cytoplasmic texture values for the DiOC6-labeled mitochondria were used to quantify the effects that test compounds had on mitochondrial potential. A nuclear mask was built from the Hoechst 33342–labeled nuclei. A cytoplasmic ring was then built by extending the nuclear mask. The cytoplasmic texture values for the DiOC6-labeled mitochondria under the cytoplasmic mask were defined by the variance of the pixel intensity values. The same nuclear and cytoplasmic masks were applied to the DHE-labeled cell images. The nuclear/cytoplasmic average intensity ratio values for the DHE label were used to quantify the effect that test compounds had on the generation of ROS.
Lysosomal mass and membrane permeability combined assay
A combination of 2 reagents was used to measure changes in lysosomal mass and membrane permeability in the same rat hepatocyte population: LysoTracker Red (Life Technologies, Carlsbad, CA) and the nucleic acid binding dye YOYO-1 (Life Technologies). In this assay, cells were labeled with dye reagents 18 to 24 h after treatment with test compounds was initiated to maximize the detection of cell membrane permeabilization and lysosomal accumulation. A 3-fold concentrated solution containing Hoechst 33342 (15 µg/mL), YOYO-1 (300 nM), and LysoTracker Red (300 nM) in MEM was added to the microplate (25 µL/well) followed by incubation at 37°C for 30 min. Wells in the microplate were washed twice with HBSS (65 µL/well). After adding a final volume of HBSS to each well (60 µL), the plate was sealed and read as above on the HCS reader. Nuclear texture values for the YOYO-1-labeled nuclei were used to quantify membrane permeability, and cytoplasmic texture values for the LysoTracker Red–labeled lysosomes were used to quantify changes in lysosomal mass. A nuclear mask was built from the Hoechst 33342–labeled nuclei. A cytoplasmic ring was then built by extending the nuclear mask. The cytoplasmic texture values for the LysoTracker Red–labeled lysosomes under the cytoplasmic mask were defined by the variance of the pixel intensity values. The same nuclear mask was applied to the YOYO-1-labeled cell images. The nuclear texture of the YOYO-1 label under the nuclear mask was defined by the variance of the pixel intensity values.
Results
Selection of a compound test set
A set of compounds with a wide range of known mechanisms of action was chosen to test the range of detection of the mechanistic profiling assays. Nefazodone and pimozide were included as a class of centrally active neurotransmitter receptor antagonists and tacrine as a cholinesterase inhibitor. Rotenone, antimycin A, and CCCP were included as inhibitors of specific sites in the mitochondrial electron transport system. Clotrimazole and miltefosine were selected to represent compounds with antifungal and antiprotozoal activities. Two transcription factor activators were included: gemfibrozil as a fibrate-based activator of PPARα and retinoic acid as an activator of the retinoic acid receptor. Captopril and enalapril are both angiotensin-converting enzyme (ACE) inhibitors. Irinotecan and SN38 were chosen for their DNA-damaging activities. Mifepristone and 2-methoxyestradiol were included as steroid-based modulators. p-Benzoquinone and resveratrol were added as potential modulators of the intracellular oxidation state.
CSB™ early safety assessment profiles report on the average response of a population of cells and can flag specific pathways for further investigation
The CSB™ approach is used to both predict the risk of eliciting toxicity in vivo and identify toxic mechanisms. In general, mechanistic assay profiles are built for each compound from thousands of single-cell measurements collected in response to compound treatments at concentrations spanning several orders of magnitude. This approach, when limited to well-average measurements reported as AC50 values, is amenable to higher throughput profiling of large compound series and can be used to classify or rank compounds for their potential to induce toxicity in vivo, as well as to identify activities of key cellular respiratory and metabolic pathways. For example, the activity profile of nefazodone, derived from a CellCiphr® panel of measurements made in HepG2 cells and primary rat hepatocytes, indicates a moderate risk of hepatic injury in vivo and highlights the modulation of several important pathways, including cell cycle regulation, respiration, and lysosomal expansion, which suggest further analysis with a mechanistic assay profile (
These well-average assays can be supplemented by making similar measures at the single-cell or cell subpopulation level. The profile of nefazodone, for example, suggests that additional focused measures of mitochondrial function would be desired. Example HCS images for several of the mechanistic assays focused on mitochondrial function and membrane integrity are shown in
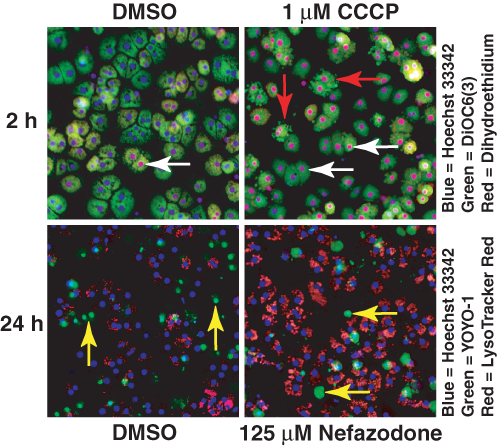
Representative images showing multifeature biomarker labeling in primary rat hepatocytes. (Top row) Images obtained from the reactive oxygen species (ROS) and mitochondrial membrane potential assay after a 2-h incubation in 1% DMSO or 1 µM CCCP. In the DMSO sample, there was a subpopulation of cells exhibiting an ROS response indicated by the red-colored nuclei (white arrows). In the CCCP-treated sample, cells responded heterogeneously as indicated by the range of oxidized dihydroethidium labeling of the nuclei. At 2 h, 1 µM CCCP induced only a small visible loss of DiOC6 intensity in the cells in this field, consistent with a minimal decrease in mitochondrial membrane potential. However, a subpopulation of cells showed marked membrane blebbing in addition to an ROS response (red arrows). (Bottom row) Images obtained from the membrane permeability and lysosomal mass assay after 24 h incubation in 1% DMSO or 62.5 µM nefazodone. These samples showed the expected subpopulation of primary hepatocytes whose plasma membranes had been compromised in culture (yellow arrows).
Cell population response analyses provided by mechanistic assay profiles revealed information not available at the well-average response level
In
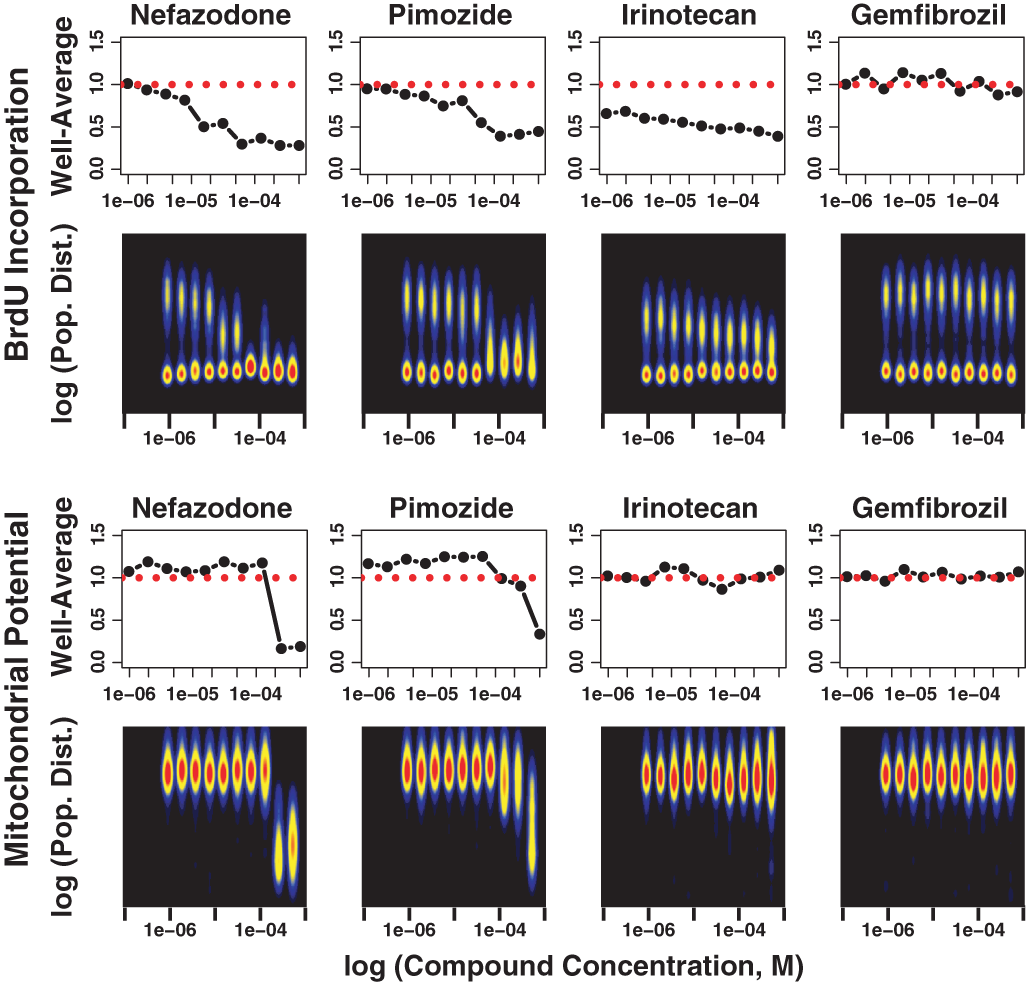
Cell population response analysis reveals information not available at the well-average response level. The DNA synthesis inhibition activity of 4 example compounds in HepG2 cells at 3 h is shown as either well-average values (first row of panels) or as population density distribution maps (second row of panels). The well-average data were normalized to the DMSO-treated controls before graphing. The distribution maps are color encoded to show low population densities as cooler blue and yellow colors and high population densities in red. Thus, the logarithm of the BrdU nuclear texture value was used as input to the distribution map. In each response map, there were dominant cell subpopulations (>60% of the total) that showed minimal DNA synthesis activity. However, most wells also contained a separate heterogeneous cell population that was actively incorporating BrdU. It should also be noted that the degree of heterogeneity could also be dependent on the compound concentration. The second set of data panels (third and fourth rows) shows the mitochondrial membrane potential response to the same 4 compounds after the same exposure time (3 h) but in primary rat hepatocytes. Both nefazodone and pimozide induced decreases in mitochondrial membrane potential but required higher concentrations than those inhibiting DNA synthesis in cycling HepG2 cells. However, irinotecan inhibited DNA synthesis at concentrations <1 µM but did not decrease mitochondrial membrane potential, even at 500 µM. Gemfibrozil was an example of a class of compounds that showed no inhibition of either mitochondrial membrane potential or DNA synthesis.
Changes in compound concentration and time drive heterogeneity of toxic response
The toxic response of cells involves a complex orchestration of biomarker activities, each of which is almost certainly differentially modulated by compound concentration. Thus, dissecting compound concentration effects on the heterogeneity of the toxic response and relationships between biomarker activities should enable a more relevant assessment of toxic activity as it develops in the cellular populations that comprise organs. We demonstrate this process of drilling down using cell population analysis of the mechanistic assay profiles from 18 example compounds.
Distribution map analysis of cell populations revealed concentration-dependent heterogeneous responses to compound treatment (
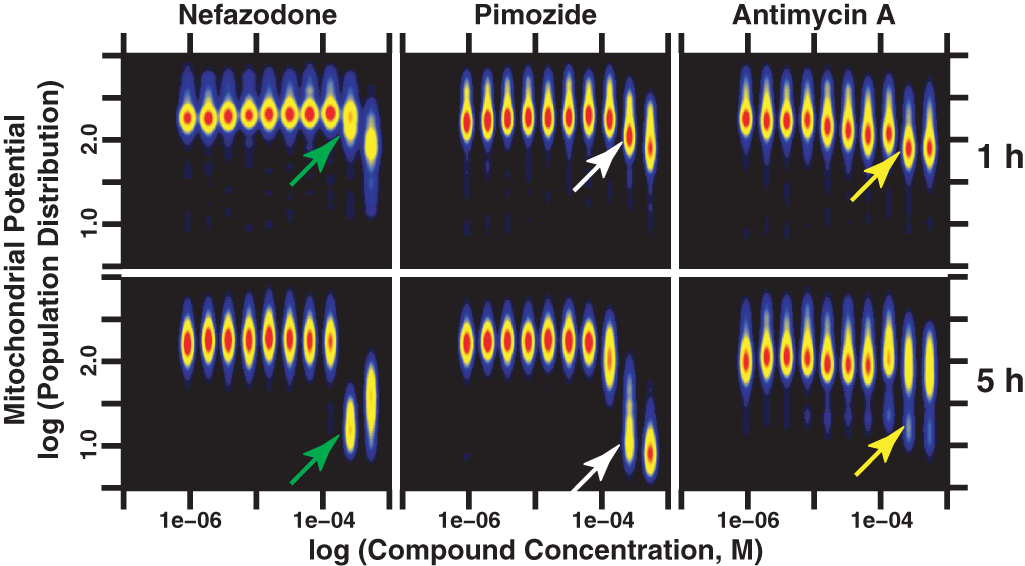
Use of cell population analysis to measure temporal and compound concentration-dependent heterogeneous toxic responses. These distribution maps present the primary hepatocyte cell population density distribution response at each concentration of 4 example compounds at 2 of the 5 time points measured. Nefazodone induced distinct mitochondrial membrane potential perturbations at 1 h versus 5 h. Nefazodone inhibited mitochondrial membrane potential at concentrations >250 µM at 1 h but produced an even more dramatic inhibition of mitochondrial membrane potential at ≥125 µM after 5 h (white arrows). Similarly, rat hepatocytes showed greater sensitivity to pimozide at 5 h versus 1 h but produced decreased mitochondrial membrane potential at a concentration of 125 µM. Antimycin A produced a more linear concentration-dependent inhibition of mitochondrial membrane potential at 1 h than did either nefazodone or pimozide. However, at 5 h, antimycin A induced a strongly heterogeneous mitochondrial membrane potential response relative to the population distribution exhibited by DMSO-treated cells (see
Cell population analysis was also used to measure temporal and compound concentration-dependent responses to ROS generation (
Interrogation of temporal changes and concentration dependency of biomarker relationships provide a new level of understanding of mechanisms of toxicity
In 1 demonstration of how compound concentration can direct a particular biomarker relationship, we simultaneously measured the generation of ROS and mitochondrial membrane potential in the same population after treatment of cells with drugs for 1 to 5 h.
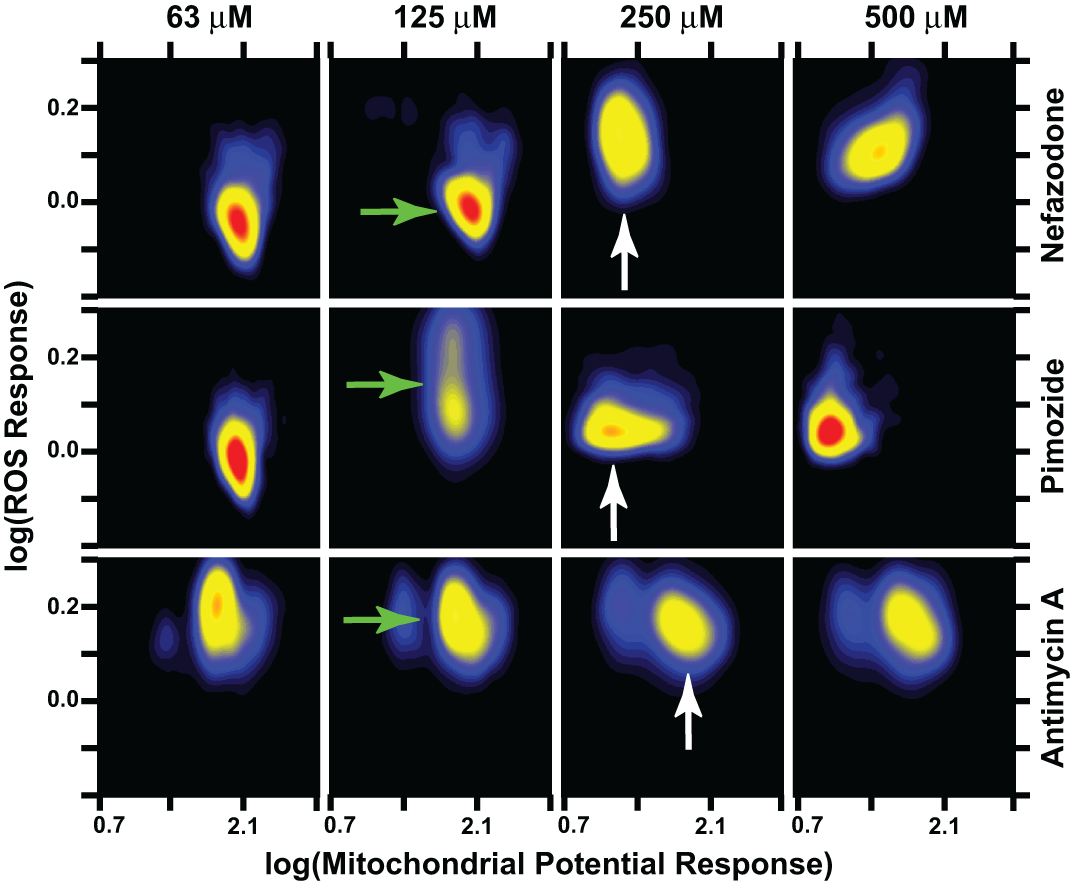
Building relationships between mitochondrial potential regulation and the level of reactive oxygen species (ROS) better defines the unique toxic responses of cells to a range of compounds. Cell population measurements of mitochondrial membrane potential and the generation of ROS were visualized using cell maps. The density distribution response of mitochondrial potential and ROS level for a cell population were measured at 10 different compound concentrations, 4 of which are shown here. Also, only 1 of the 5 time points, 5 h, is represented here. Nefazodone at 125 µM had little effect on ROS generation or mitochondrial membrane potential, whereas 125 µM pimozide induced a heterogeneous increase in ROS generation, and antimycin A showed a greater increase in ROS even at 63 µM but with a concomitant decrease in mitochondrial membrane potential in only a small subpopulation (green arrows). Pimozide at 250 µM exhibited only a small increase in ROS and a dramatic drop in mitochondrial membrane potential (white arrow; second row of maps). On the other hand, a heterogeneous population of cells maintained a strong uniform ROS generation response in the presence of 250 µM antimycin A, with only a small population of cells exhibiting reduced mitochondrial membrane potential. Note that these data represent a subset of example compound responses that are better visualized in the animated series found in
As shown in
To gain further insight into the relationship between the mitochondrial membrane potential and ROS generation responses that compounds induce in primary hepatocytes, we produced animated series of cell map sequences from measurements made in the same populations of cells. This set of animated series enables improved interpretation of biomarker activity relationships as a function of time and compound concentration. Each of the
Each compound generated a unique response in time and concentration. However, some general patterns arose. Compounds that induced ROS generally did so early on in cell populations exhibiting small decreases in mitochondrial membrane potential. This relationship was most pronounced at the earliest of the time points (1-3 h). For example, certain concentrations of compounds such as nefazodone, pimozide, antimycin A, CCCP, and clotrimazole showed distinct subpopulations with increased ROS generation but without decreased mitochondrial membrane potential. Another class of compounds that included miltefosine, irinotecan, and 2-methoxyestradiol showed a mixed response (e.g., diagonal movement of cell populations as a function of concentration in the cell maps) where increases in ROS generation were accompanied by decreased mitochondrial membrane potential at the same time and concentration.
In a second demonstration of how compound concentration can direct biomarker relationships, we compared the relationship between changes in lysosomal mass and membrane permeability in the same cell populations using the entire 18-compound set.
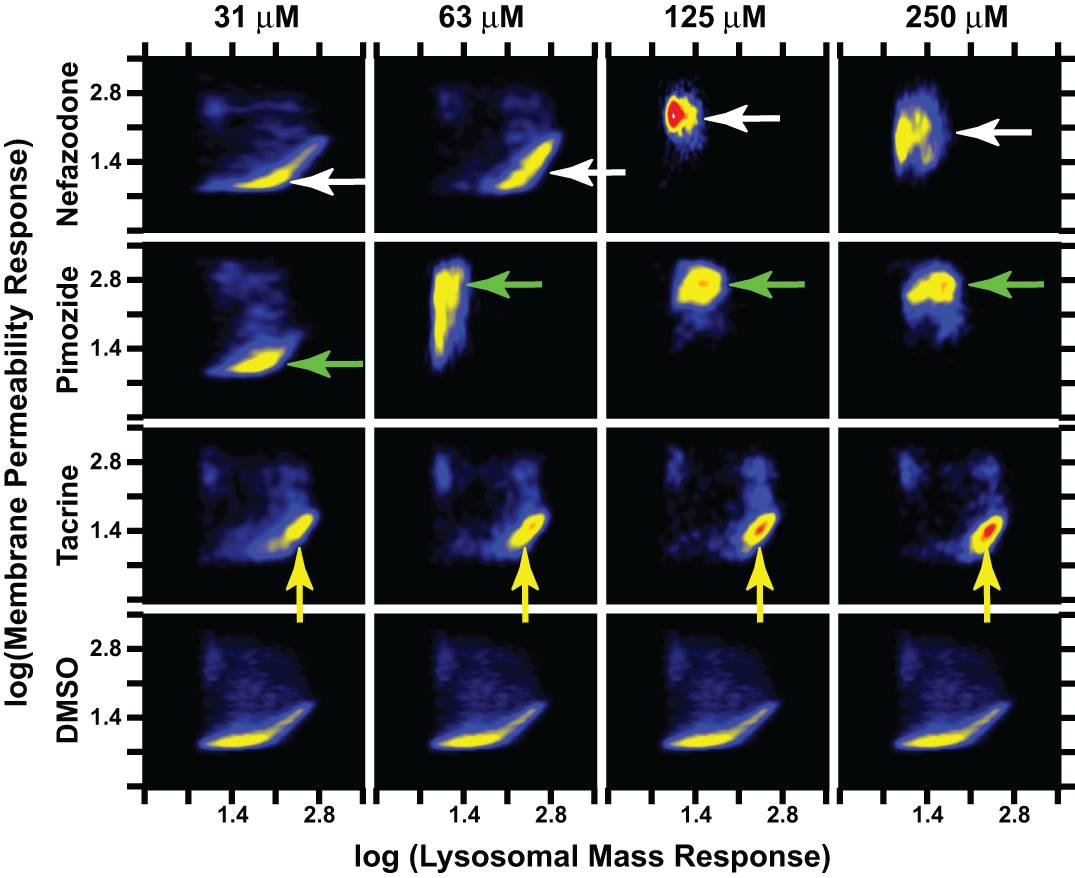
The mechanistic response relating lysosomal regulation and membrane permeability to treatment with compounds was concentration dependent for several compounds. Here, cell maps were again used to visualize the relationship between changes in membrane permeability and lysosomal mass that were induced by compounds in the same primary hepatocyte populations. Each example compound produced a unique response at 24 h. At 63 µM, nefazodone produced a subpopulation with increased lysosomal mass plus an increase in membrane permeability in a subpopulation. Nonetheless, 125 µM nefazodone induced a strong and homogeneous increase in membrane permeability as well as a decrease in lysosomal mass to a level comparable to control populations exhibiting minimal lysosomal mass (white arrows). The more soluble compound pimozide showed a less complex response at 24 h (green arrows). Pimozide induced negative population shifts in both lysosomal mass and membrane permeability at concentrations ≥63 µM. Tacrine belonged to a class of compounds demonstrating a concentration-dependent increase in a more homogeneous subpopulation with increased lysosomal mass but without a large increase in membrane permeability (yellow arrows). As with
The relationship between membrane permeability and lysosomal accumulation shown in
Discussion
New models for early safety assessment
Despite a century of effort, the tools and technologies currently used to predict human toxicity have failed to adequately minimize the failure rate in drug development and the risk of adverse reactions. Many of these failures are associated with toxicities that are not identified until the molecule has progressed to the clinic (i.e., the molecules were not triaged by traditional toxicology methods) or after commercialization and distribution to the public. Traditional toxicology is dependent on the use of vertebrate animals—rodents, dogs, and primates—to mimic the response of humans. These models are slow, expensive, and of limited capacity. Nonetheless, animal testing has built a large knowledge base on the mechanisms of toxicity associated with specific chemical structures and is still the gold standard required by the regulatory agencies. Unfortunately, this knowledge base is not sufficient to accurately predict the toxicity of a molecule in humans based on its behavior in animal models. The predictive power of animal testing is a subject of great controversy, with accuracy rates ranging from 50% to 70% depending on the target organ toxicity.
This controversy is based partly on the lack of agreement on a functional definition for “predictivity” because there are many possible definitions of predictivity for a successful platform. We support the following definition: “A cell-based predictive assay(s) must reflect the biology relevant to the system being modeled (e.g., rodent or human) to guide decisions on benefit vs. risk to continue development” (J. Reynolds, unpublished data, 2009). The metrics for evaluating a predictive assay(s) for drug safety include a combination of high specificity (>85%) and reasonably high sensitivity (>50%) relative to either animal models or known human responses (DILI) from large (>400) and diverse retrospective drug/compound studies, as well as information on the mechanism(s) of action to understand the detailed biology.
The most advantageous use of a predictive platform would permit discovery, safety, and medicinal chemistry scientists to make optimal decisions on either de-risking compounds or de-prioritizing compounds. We believe that the following characteristics are important in the implementation of such a platform: (a) the use of organ-specific cells, (b) the application of the optimal panel of functional biomarkers chosen for the organ-specific cells that can be correlated in the same cells, (c) the measurement of dose responses over a wide range of concentrations, (d) the measurement of temporal responses, and (e) the creation and use of a reference safety database with a library of compounds with safety data that can be used for creating predictive models. Although progress has been made to develop predictive in vitro safety models, in part through the integration of HCS technology, 3,4 many of the approaches described to date have been of limited utility for testing the number and nature of lead molecules in the late discovery phase. In this article, we focused on several components of this approach, which leverages the capability of HCS technology to elucidate the mechanisms of toxicity and capture the heterogeneity of the response.
Focused mechanistic assay profiles provide detailed information on toxic mechanisms of action that can guide lead development
In practice, one of the most important deliverables of early safety profiling is the information about mechanism of action. This knowledge can guide medicinal chemistry as well as optimize design and interpretation of non–good laboratory practice (GLP) animal studies. Mechanistic assay profiles facilitate the rapid evaluation of many aspects of a molecule’s toxic mechanism, including potency, pathway, and target specificity.
As shown here, a better understanding of toxic mechanisms of action can be achieved by analyzing cell population response heterogeneity and biomarker relationships. In one example, we used the safety risk index and initial mechanistic profile for the market-withdrawn antidepressant nefazodone as a guide to identify requirements for additional mechanistic profiling. We showed that nefazodone as well as other marketed drugs induced strong inhibition of DNA synthesis that was heterogeneous among the cell subpopulations at some concentrations. Although it is unlikely that nefazodone directly induced DNA damage, it probably acted to inhibit DNA synthesis by interfering with 1 or more of the metabolic and synthetic processes that regulate cell growth and division. Unlike pimozide, for which the mitochondrial membrane potential and ROS generation collapsed at high concentration, nefazodone modulated mitochondrial potential at high concentrations in a response that was coupled with ROS generation, suggesting that nefazodone could trigger an oxidative stress cascade while concomitantly decreasing mitochondrial membrane potential. These results are consistent with a mitochondrial electron transport system model that requires that some level of mitochondrial membrane potential be maintained to enable ROS generation. Evidence to support this conclusion comes from studies of mitochondrial cytochrome bc1 complex reconstituted into phospholipid vesicles. 16 After measuring a direct relationship between membrane potential and superoxide generation, the authors concluded that the bc1 complex may contribute significantly to superoxide generation by mitochondria in vivo and that the rate of superoxide generation can be controlled by modulation of the mitochondrial membrane potential. In summary, measuring the temporal and concentration-dependent relationship between ROS generation and mitochondrial membrane potential inhibition provided unique response profiles for each compound that can potentially be used as a component of a systems-based model to classify their toxic mechanisms of action.
The data relating lysosomal mass and membrane permea-bility provided additional information on the early ROS generation. After 24 h, the generation of ROS and an increase in membrane permeability were well correlated. For example, cells treated with nefazodone, pimozide, and antimycin A exhibited strong membrane permeability at 24 h and at concentrations at least 2-fold lower than the concentrations that induced measureable ROS generation at 5 h. However, compounds that induced little or no ROS generation still had the potential to modulate lysosomal mass and increase membrane permeability. For instance, irinotecan induced heterogeneous membrane permeability at concentrations where it also induced strong DNA damage (see
The detailed information that cell population analyses provides has to be balanced with the fact that undirected manual inspection of large mechanistic assay profiling databases using only graphical methods is not feasible. However, graphical views of the data provide insights that can be used to construct models to quantify the subpopulation responses. Thus, the predicted safety risk index was useful as a guide in drilling down into large databases to define mechanistic relationships. We therefore routinely used this index to first classify data into relevant activity groups and then took advantage of special tools to define compound toxic activities induced over a range of compound concentrations.
Thus, we demonstrated an approach to address complex toxic responses involving the orchestration of myriad cellular processes using CSB™ to dissect biomarker feature relationships. The example compounds, which were selected to have activities against a wide range of targets, exhibited distinct response profiles when their effects on biomarker feature relationships were used as a measure of activity. Furthermore, several of the compounds in the subset exhibited temporal and compound concentration-dependent responses in both biomarker relationships and the heterogeneity of their responses. Hence, we posit that coupling these individualized, mechanistic assay profiles with safety risk scores and initial insights to potential mechanism(s) of action will improve overall predictivity of toxicity in vitro and enable better decisions on de-risking or prioritizing compounds in development.
Interpreting mechanistic assay profiles in the context of in vivo toxicology
A comparison of the mechanistic profile of nefazodone (an antidepressant withdrawn for hepatic toxicity), tacrine (another centrally active drug associated with hepatic dysfunction), and pimozide (an antipsychotic not generally associated with hepatotoxicity) is intriguing. Both nefazodone and pimozide kill cycling cells such as HepG2 cells and inhibit BrdU incorporation so simple measures of cell metabolism and death cannot discriminate them. Both drugs inhibit mitochondrial function, as apparent in well-average AC50 measurements, but a more detailed assessment of the temporal and dose dependency of these activities revealed significant differences between these 2 drugs, which can be further contrasted with the activity of tacrine.
In vitro postmarket assessments of nefazodone found that it inhibits the bile salt exporter pump (BSEP) and complex I and IV of the mitochondrial respiration chain. 17,18 Despite these reports that nefazodone inhibited mitochondrial electron transport, the compound did not generate ROS in human hepatocytes 4 ; however, we show here that ROS was generated in rat hepatocytes. The apparent discrepancy between the human and rat model is likely due to multiple effects, including metabolic differences between the 2 species. 5 Nefazodone is primarily detoxified by phase II sulfation and glucuronidation—pathways that are typically more active in rodents. Thus, this study concludes that nefazodone has a profile safety alert consistent with hepatotoxicity due to a toxic mechanism involving oxidative stress induced by inhibition of the electron transport chain and generation of ROS that is followed by cell membrane leakage and eventual cell death.
Pimozide, clinically associated with cardiotoxicity, nevertheless is shown here to modulate hepatocyte mitochondrial function and ROS generation, increase plasma membrane permeability, and perturb DNA synthesis in HepG2 cells. Indeed, the profile described here for pimozide is similar in pattern and scope to nefazodone. However, if exposure levels are considered (Cmaxpimozide ~1 nM; Cmaxnefazodone ~1 µM), 19 it is clear that the hepatotoxic effects observed for pimozide at concentrations approximately 100 µM are elicited by super-physiological exposure levels. Note, however, that as these exposure data are typically not available in the early steps of an early safety assessment program, pimozide would necessarily generate a safety alert comparable to that generated by nefazodone.
Finally, the mechanistic assay profile for tacrine suggests a different toxicity mechanism. Tacrine has been reported to cause a reversible increase in plasma alanine transaminase (ALT) in the clinic. However, this observation was not apparent in preclinical studies. Following removal of tacrine from the market, additional research identified tacrine as a putative inhibitor of electron transport in isolated rat liver mitochondria with consumption of glutathione. 20-22 Nevertheless, 1 study failed to identify oxidative stress from tacrine exposure as the cause of glutathione consumption. 21 Tacrine did not elicit generation of ROS in this study. But, in agreement with the Galisteo et al. study, 21 alterations to hepatocyte membrane fluidity and permeability were observed. Presumably, changes to membrane fluidity can be linked to the increased release of enzymes noted clinically, and this has been demonstrated in mice with altered hepatocyte membranes or with drug treatment such as chlorpromazine in rat brain. 23,24 The results of the mechanistic profiling presented here would suggest that tacrine would not cause overt hepatotoxicity, which is consistent with findings from drug safety studies. Furthermore, the membrane permeabilization observed at less than cytotoxic concentrations may correlate with the ALT leakage observed in the clinic.
Future of early safety testing
The early safety models described herein, both the higher throughput predictive CellCiphr® platform and the detailed mechanistic profiles, represent significant advancements in the development of safety assessment tools that can be applied early in the development process. Integration of HCS technology with CSB™ toxicology models has enabled development of compound response profile databases necessary to build predictive models of preclinical and clinical outcome. This approach is uniquely positioned to address the needs of early safety assessment, but recognizing this tremendous opportunity requires further evolution of HCS technology as well as improved organ- and species-specific cellular models, improved panels of toxicity-relevant functional biomarkers to produce advanced reference databases and informatics, and comprehensive pharmacogenetic and toxicogenomic databases.
We have shown that a systems approach involving the measurement of biomarker feature relationships within single cells provides a higher level of mechanistic resolution than can be obtained in simpler single-parameter assays. Furthermore, we believe that high-resolution mechanistic data supplemented with information on the heterogeneity of the toxic response across time and concentration will become a better model of the organ response in vivo.