
Abstract
The cancer stem cell hypothesis posits that a subpopulation of cancer stem cells is frequently responsible for a tumor’s progression and resistance to treatment. The differential cellular morphology and gene expression between cancer stem cells and the majority of the tumor is becoming a point of attack for research into the next generation of therapeutic agents that may work through an induction of differentiation rather than apoptosis. Advances in the field of high-content imaging (HCI), combined with modern shRNA technology and subpopulation analysis tools, have created an ideal screening system to detect these morphological changes in a subset of cells upon gene knockdown. The authors examined several glioblastoma stem cell isolates pre- and postdifferentiation to elucidate the phenotypic effects caused by both serum differentiation and gene knockdown. Neural markers were first characterized in these cells at varying states of differentiation using HCI and immunoblots. The authors then chose one of these isolates, in both the pre- and postdifferentiated forms, for further analysis and screened for morphological changes upon shRNA knockdown of a panel of cancer testis antigens (CTAs). CTAs are a family of proteins that are normally expressed in male germ cells as well as heterogeneously expressed in some metastatic tumors. This gene family has also been implicated in the differentiation of normal human stem cells, therefore making it an ideal candidate for modulation in tumor stem cells. Using their approach, the authors identified the differential effects of gene knockdown in both cell types leading to either changes in neural stem cell marker expression or a decreased cell density likely due to growth arrest or cell death. The resolution that HCI brings to a screen at the subpopulation level makes it an excellent tool for the analysis of phenotypic changes induced by shRNA knockdown in a variety of tumor stem cells.
Introduction
H
The critical feature that HCI brings to the analysis of cellular phenotypes is subpopulation analysis. HCI’s ability to separate groups of cells under each treatment condition truly differentiates this method from that of whole-population readouts associated with simple plate readers. Populations of cells often do not respond uniformly to treatment, with the gene expression in each cell determined by cell cycle state, cell-to-cell contact, or other factors that frequently cause subpopulations to respond differently to a treatment or even remain completely unresponsive. 1,2 One such important subpopulation, cancer stem cells (CSCs), are an ideal model for HCI in conjunction with subpopulation analysis. The native undifferentiated state of cancer stem cells can be modified in a variety of ways, including compound exposure or RNA interference, to induce marked changes in gene expression and cellular phenotype monitorable with HCI. 3,4 Due to the nature of differentiation events in a tumor population containing cancer stem cells, many of these cells respond to treatment at different rates or differentiation patterns, giving HCI analysis of each subpopulation a decided edge versus other forms of analysis.
Over the past decade, CSCs have become an important area of study in the field of cancer research. These cells are frequently detected in blood, brain, breast, prostate, and colon tumors and are incredibly resilient. 5-7 This subset of cells, differentially resistant to chemotherapy and radiation treatment, likely plays a role in tumor recurrence in a variety of human cancers, and determining how they grow and respond to therapeutic agents must be a priority to identify effective cancer treatments. 8,9 Current chemotherapy focuses on killing the tumor with cytotoxic agents, targeting cancer cell–specific pathways, or inhibiting angiogenesis. Although these treatments may debulk the majority of the tumor, additional methods are required to stop the cancer stem cells from reinitiating tumor growth after therapeutic treatment. Our focus is on the potential of differentiating cancer stem cells leading to their senescence or increased susceptibility to adjuvant chemotherapeutic agents. Glioblastoma cancer stem cells were chosen as a model for characterization due to their relatively well-characterized nature, their widespread use, and the important role they play in one of the most deadly forms of cancer. 10,11
Cancer testis antigens (CTAs) are a poorly understood gene family that potentially plays a major role in the development of a variety of tumors. This family of proteins is normally expressed primarily in male germ cells, the placenta, and fetal ovaries, whereas a subset of CTAs is also natively expressed in human neural tissue. 12,13 In addition to expression in normal tissue, CTAs are heterogeneously overexpressed in metastatic tumors, indicating that this gene family may play a role in cancer progression. 13,14 The gene family came to our attention due to another potential role that it may play in the differentiation of normal human stem cells. 15,16 The restricted expression of CTAs in the majority of normal human tissue, combined with aberrant expression in malignant cancers and role in stem cell differentiation, makes CTAs interesting candidates for modulation in tumor stem cells. 17 Indeed, the limited expression of this gene family decreases the likelihood of adverse side effects due to treatment and is a prime reason for the development of CTAs as potential targets for cancer immunotherapy. 18,19
To determine how this gene family may interact with glioblastoma cancer stem cells, we used HCI subpopulation analysis to first characterize multiple clones of glioblastoma stem cells in both their undifferentiated and differentiated forms. We measured the subpopulations of cells expressing both stem cell and growth markers to distinguish between these clones and selected a representative cancer stem cell clone for further experiments. We then knocked down expression of a panel of CTAs to determine if the decreased expression of any of these genes led to partial or complete differentiation into an additional type of neural cell or inhibition of growth and eventual apoptosis. The combination of HCI subpopulation analysis, cancer stem cells, and shRNA technology allowed us to detect and characterize changes in these cells that may lead to novel methods of treatment for this particularly aggressive tumor type.
Materials and Methods
Cell culture and treatment
U87MG cells were grown according to American Type Culture Collection (ATCC, Manassas, VA) guidelines. Glioblastoma stem cells were isolated from primary tumors, mechanically dissociated, and grown as semiadherent neurospheres in the absence of fetal bovine serum (FBS) and presence of epidermal growth factor (EGF) and basic fibroblast growth factor (FGF) as previously described. 10,11 These cells were grown for up to 15 passages without significant changes in phenotype or neural stem cell marker expression. Glioblastoma stem cells were grown using Neural Progenitor Maintenance Media Bullet Kit (CC-3210; Lonza, Basel, Switzerland) supplemented with CC-4241 and CC-4242. Differentiated glioblastoma stem cells were grown in Dulbecco’s modified Eagle’s medium (DMEM; 12430-104; Invitrogen, Carlsbad, CA) supplemented with 10% FBS. All cells were grown in uncoated tissue culture–treated flasks prior to plating for HCI and cultured in a humidified atmosphere at 37°C and 5% CO2. For the assays described below, cells were plated onto poly-D-lysine-coated 96-well dishes (356640; BD Biosciences, Franklin Lakes, NJ) at a density of 10,000 cells in 100 µL of growth media as determined by a Vi-CELL viability analyzer (Beckman Coulter, Fullerton, CA). Cells were transduced with Mission lentiviral particles (Sigma-Aldrich, St. Louis, MO; Suppl. Table S3). A volume of 10 µL of prepared virus was added to cells at 3 to 5 infectious units per cell in a final concentration of 8 µg/mL of protamine sulfate and a volume of 50 µL of growth media for 18 h. Additional growth media were then added to a final volume of 100 µL, and the cells were grown for a total period of 6 days posttransduction.
Immunofluorescence and immunoblots
Cells were fixed with 3.7% formaldehyde for 20 min at 37°C and permeabilized with 0.1% Triton-X 100 for 10 min at 25°C. All following dilutions were performed in phosphate-buffered saline (PBS) at 25°C. Fixative was removed and each well washed with PBS. Cells were blocked using 1% bovine serum albumin (BSA) (15260-037; Invitrogen) for 1 h at 25°C. Primary antibodies to Sox2 (MAB4343; Millipore, Billerica, MA), nestin (Ab5968-100; Abcam, Cambridge, UK), and Ki67 (RM-9106-S; NeoMarkers, Fremont, CA) were diluted in 1% BSA, and this mixture added to each well overnight at 4°C. Each well was then washed 3 times with 200 µL of PBS and incubated for 1 h at 25°C with a solution containing 5 µg/mL goat α-mouse-Alexa-555 (A-21422; Molecular Probes, Eugene, OR), 5 µg/mL goat α-rabbit-Alexa-647 (A-21244; Molecular Probes), and 200 ng/mL Hoechst 33342 to detect nuclear material (21492; Molecular Probes) and stored at 4°C until analysis.
For immunoblots, the cells were rinsed once with ice-cold PBS and lysed with protein extraction reagent (78501; Pierce, Waltham, MA). The lysates were then centrifuged at 14,000 g for 15 min and a Bradford assay performed to determine the protein concentration of each lysate. Equivalent amounts (5 µg) of protein were resolved by sodium dodecyl sulfate polyacrylamide gel electrophoresis (SDS-PAGE) and transferred to nitrocellulose membranes. The membranes were then probed for the expression of glial fibrillary acidic protein (3670; Cell Signaling Technology, Danvers, MA), tyrosine hydroxylase (2792; Cell Signaling Technology), beta-III tubulin (1637; Chemicon, Temecula, CA), and glyceraldehyde-3-phosphate dehydrogenase (2118; Cell Signaling Technology).
Fluorescent imaging and statistical analysis
Cell images were captured using a Cellomics Arrayscan VTI (Thermo Scientific, Waltham, MA) and analyzed with the Target Activation BioApplication. Two or 3 channels were read at a magnification of 10×. A minimum of 1000 individual cellular images or 20 fields were captured for each condition. For each cell, along with the intensity from each channel, nuclear area was measured. For heat map analysis, Arrayscan data were transformed to a log2 format and further analyzed using unsupervised K-means clustering to group subpopulations with similar profiles. All populations were compared to control populations treated with an shRNA to green fluorescent protein (GFP) and clustered across all plates with the same cell type. Subpopulation clusters were derived from the entire population of each cell type screened and intensities based on the standard deviation away from the mean of the control (shGFP-treated) population.
Results and Discussion
To distinguish the phenotypic differences between populations of undifferentiated and differentiated cancer stem cells, we grew 2 clones of glioblastoma stem cells in the presence of FBS over a period of 6 months. These clones, previously isolated and characterized by Pallini and colleagues, 10 were surgically resected from patients with glioblastoma multiforme and grown in the absence of serum. These glioblastoma stem cell clones (1 and 28) are either p53+ (clone 1) or p53– (clone 28) and express both the neural stem cell marker CD133 and the nuclear proliferation marker Ki67.
Both of the clones chosen for differentiation had previously grown as loosely attached or unattached neurospheres in the basal stem cell media (
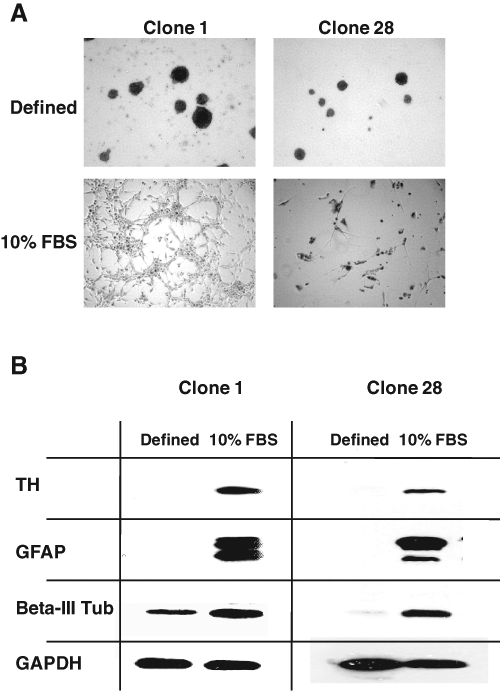
Changes in glioblastoma stem cell morphology upon serum differentiation. Light micrographs were taken of differentiated and undifferentiated cancer stem cells. These clones were isolated from primary tumors and passaged as neurospheres. They were then enzymatically dissociated into single-cell isolates and grown as described below. Stem cells from separate patients were maintained in tissue culture–treated flasks as neurospheres in defined basal media containing epidermal growth factor (EGF) and basic fibroblast growth factor (bFGF; defined). (
Western blots were performed to verify the changes in cellular phenotype between the undifferentiated and differentiated cells. We chose protein markers that are commonly expressed in neural tissue and confirmed that the undifferentiated clones had developed a differentiated neural phenotype (
In conjunction with Western blot analysis, these clones were further characterized for the presence of neural, stem cell, and growth markers using HCI of both differentiated and undifferentiated clones. Ki67, a nuclear protein and marker of proliferation, is expressed in all active phases of the cell cycle
25
and is frequently used in a clinical setting to determine the fraction of tumor cells actively growing and is therefore a measure of tumor grade.
26
Both clones 1 and 28 in both differentiated and undifferentiated forms, as well as U87MG cells—a glioblastoma-derived cell line control—were dissociated into single-cell suspensions, plated onto poly-D-lysine-coated plates, and grown for 24 h prior to fixation. These cells were then fixed, permeabilized, and stained for the expression of Ki67 (
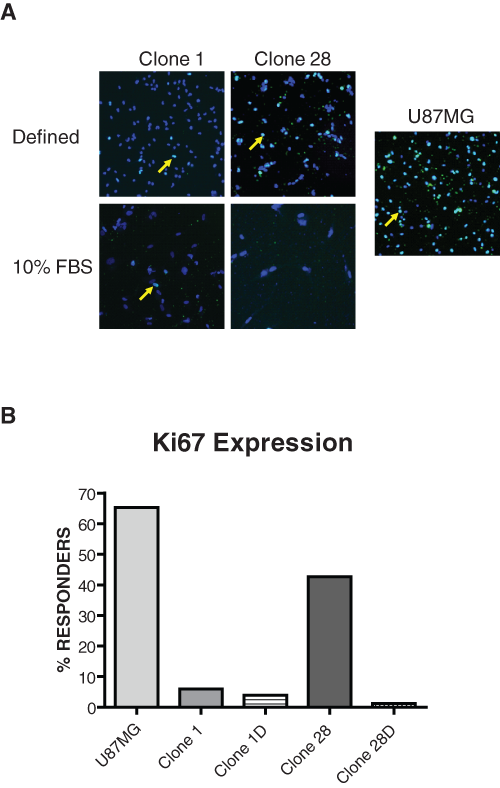
Fetal bovine serum (FBS) differentiation of glioblastoma stem cells leads to decreased Ki67 expression. Both differentiated and undifferentiated cells, as well as a U87MG control line, were plated from single-cell suspensions for high-content analysis. (
The intermediate filament protein nestin is expressed in both neural and neural stem cells. Although changes in expression of this marker are useful for determining differentiation events, the cytoplasmic staining also makes it an excellent option for determining changes to overall cellular morphology. Differentiated and undifferentiated stem cells were plated as in
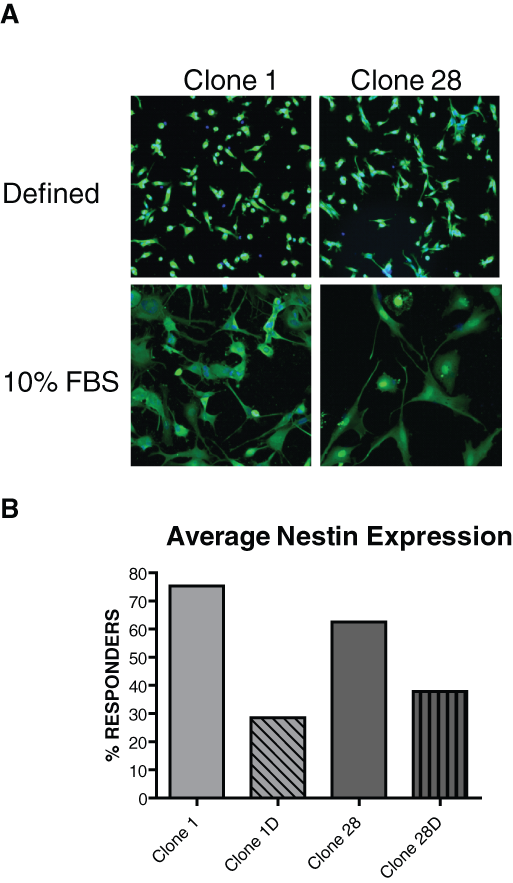
Fetal bovine serum (FBS) differentiation of glioblastoma stem cells leads to decreased expression of the neural stem cell marker nestin. As in
To determine how these clones would respond to shRNA gene knockdown in a high-content screening setting, we knocked down 1 family of genes in these cells and stained for the presence of the neural stem cell transcription factor Sox2 and the filament protein nestin. In addition to these neural stem cell markers, we obtained an additional 4 nuclear parameters—total DNA intensity, average DNA intensity, variation of DNA intensity, and nuclear area—through staining of each cell’s DNA using Hoeschst dye. Changes in these nuclear markers sometimes suggest a cell’s cell cycle position or apoptotic state. For instance, cells with a low total DNA intensity indicating 2N DNA content and a moderate nuclear area frequently reside in the G0/G1 stage of the cell cycle, whereas cells with a high total DNA intensity indicating 4N DNA content frequently reside in the G2/M compartments.
1
Clone 1 was chosen for further analysis due to its high levels of stem cell marker expression, growth rate in suspension, and lack of senescence upon differentiation. This clone also adhered well to poly-D-lysine-coated plates, making it an excellent option for high-content screens. Due to the potential role of cancer testis antigens in several forms of human tumors, as well as its relatively poor overall characterization, this family of genes was chosen for knockdown. A panel of commercially available shRNA-expressing lentiviruses was used to knock down expression of 61 members of the cancer testis antigen gene family. The differentiated and undifferentiated stem cells were plated for this assay as in
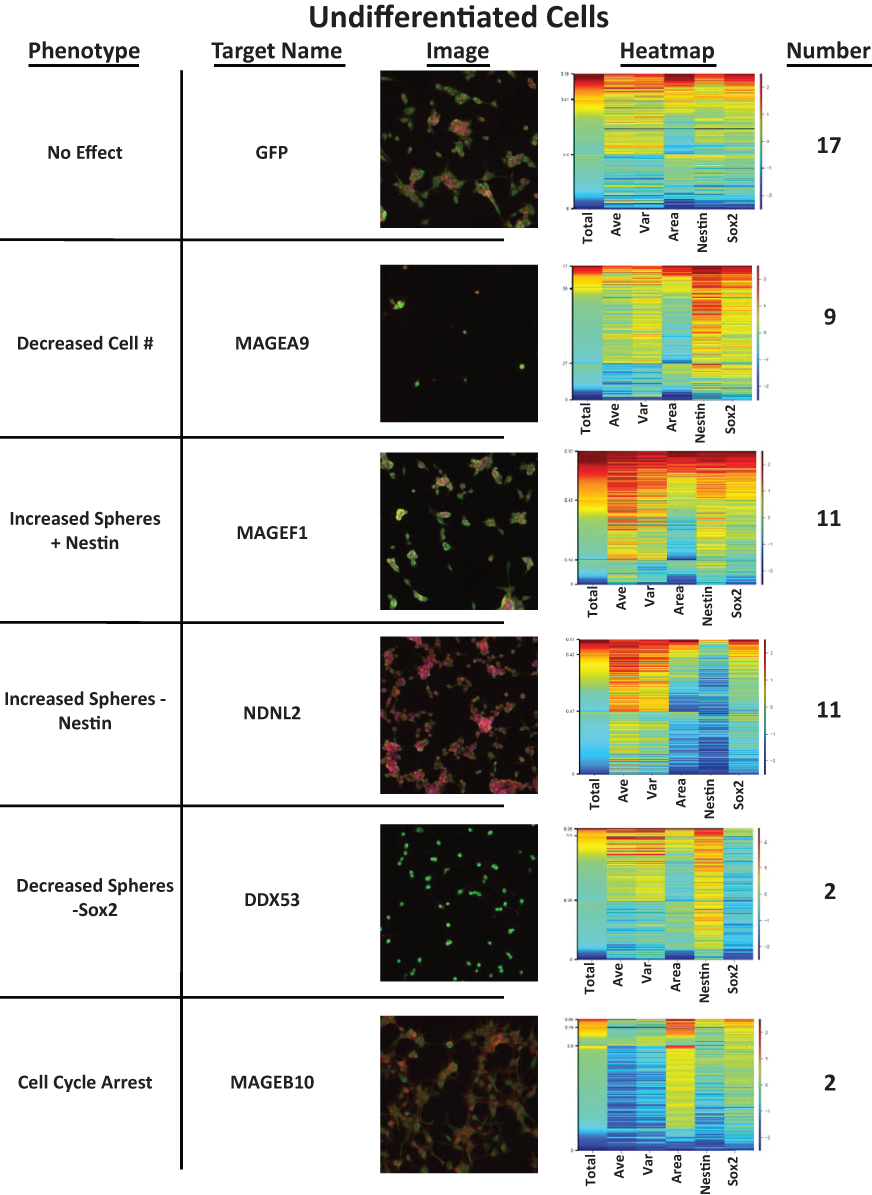
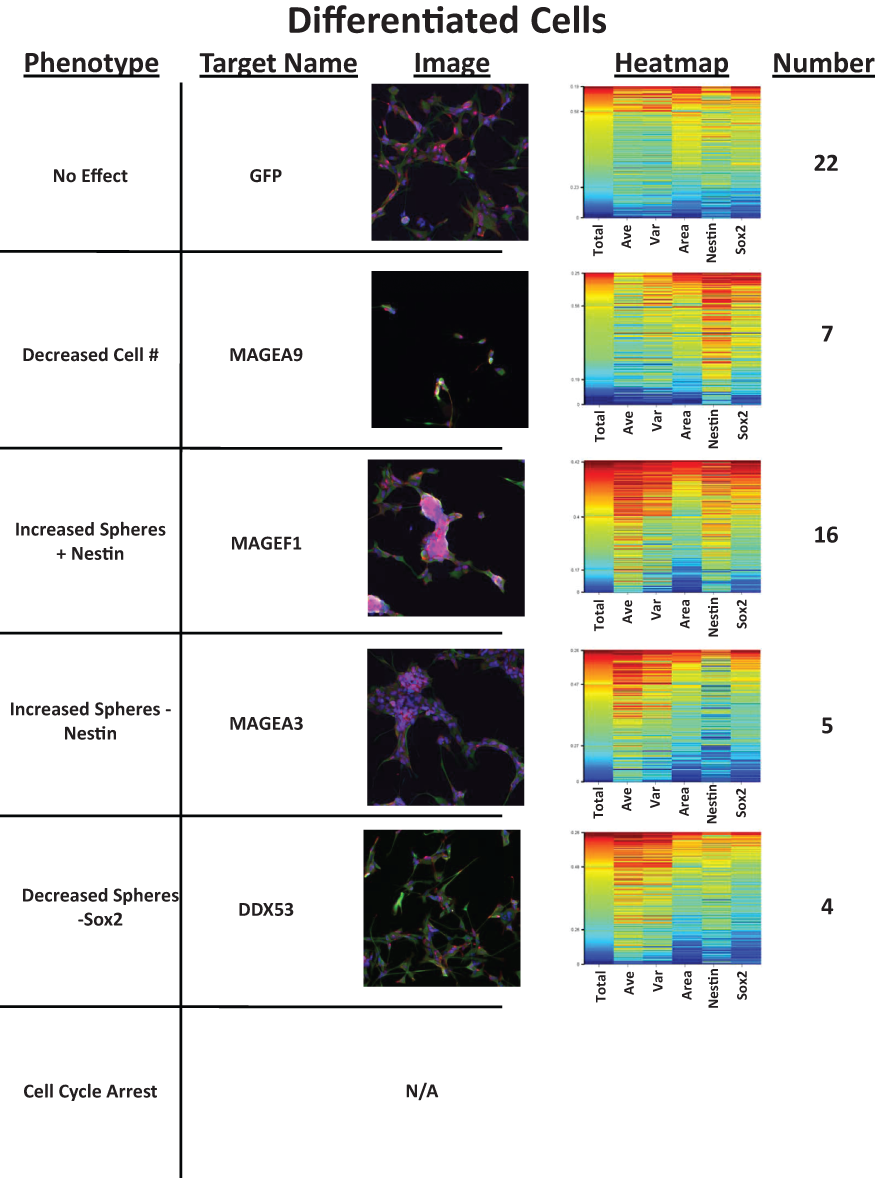
Knockdown of cancer testis antigens (CTAs) in undifferentiated glioblastoma stem cells leads to multiple phenotypes. Undifferentiated glioblastoma stem cells were plated as in
The first category of genes contains those that caused no change in the cellular morphology upon knockdown and were similar to the knockdown of shGFP. These cells retained high levels of nestin and Sox2 expression while maintaining a semiadherent morphology. Arrayscan imaging limits analysis of this cell type to 6 to 7 days postplating due to the propensity of these undifferentiated cells to form neurospheres that image and mask poorly using HCI technology. This is balanced by the necessity of allowing the shRNA knockdown at least 2 cell cycles, of 48 to 72 h each, to effectively alter each cell’s phenotype, and thus a 6-day knockdown was chosen. Seventeen of the tested constructs caused no or little effect on the observed phenotype in the undifferentiated cells.
The second category consists of 9 shRNAs that decreased the total cells in each well, likely through apoptosis induction or possibly through a halt in the cell cycle extremely early in the knockdown. These are shRNAs that would historically be the most interesting in a cancer setting due to their ability to stop the growth of a cancer stem cell line. Indeed, a follow-up screen may focus on differentiating these targets into those that caused cell cycle arrest or cell death.
The third and fourth categories consist of genes whose knockdown led to increased sphere formation in the undifferentiated cells. These categories are divided based on whether the neural stem cell marker nestin was increased or decreased upon gene knockdown. Eleven distinct knockdowns were found for each of these 2 phenotypes. The genes knocked down in these cells may relate to cellular adhesion, adhesion to the poly-D-lysine matrix, or even the differentiation state. In contrast to knockdowns that led to increased sphere formation were 2 classes of constructs whose gene knockdown led to a decreased tendency to form spheres. These 2 constructs caused the cells to grow with an adherent morphology as well as decreasing the expression of the stem cell marker Sox2. These cells spread out over the surface and were well separated upon imaging. Most of these cells also increased their expression of nestin and were decreased in overall area. Fifth were the 2 genes whose knockdown led to a cell cycle arrest phenotype in what appeared to be the G1 phase of the cell cycle. DNA total intensity and nuclear area data support this conclusion based on our previous work. 1 These 2 constructs also require further study to determine if they are viable mechanisms to target cancer growth via cell cycle arrest. Due to the difficulty of working with cancer stem cells in a screening setting, these screens were performed as single runs and only those gene knockdowns that could be phenocopied with multiple shRNA classified with a specific phenotypic effect. The final group of constructs contains those that gave widely divergent phenotypes, potentially due to off-target effects, and remain unclassified due to these divergent phenotypes.
Although quite a few of the shRNA knockdowns led to phenotypic changes in the differentiated clone 1, there were fewer constructs leading to altered phenotypes when compared to the undifferentiated cells (Suppl. Table S2). Interestingly, however, several of the constructs appear to have increased sphere formation in the differentiated cells, leading to a more “stem-like” phenotype and increasing the expression of the neural stem cell markers Sox2 and nestin even while in the presence of serum. The constructs inducing these changes were frequently those found to increase sphere formation in undifferentiated clone 1. Representative examples of the changes induced by the constructs in the differentiated clone 1 can be found in
Knockdown of cancer testis antigens (CTAs) in differentiated glioblastoma stem cells leads to multiple phenotypes. Undifferentiated glioblastoma stem cells were plated as in
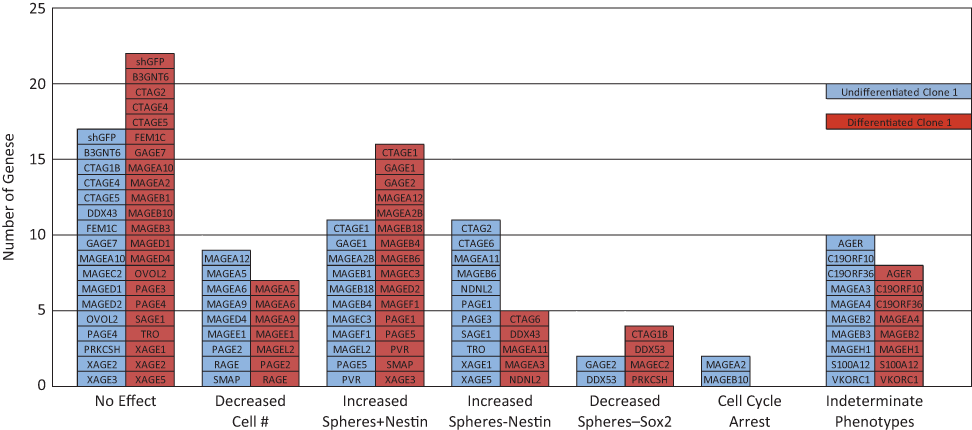
Comparison of cancer testis antigen (CTA) shRNA knockdowns in undifferentiated and differentiated glioblastoma stem cells. The number of knockdowns generating each phenotype in either differentiated or undifferentiated clone 1 was compared across the 6 most common observed morphologies. Knockdowns in which multiple constructs to the same target led to irreproducible divergent phenotypes are listed under “Indeterminate Phenotype.” Each bar consists of the individual CTA knockdowns that led to each phenotype in each clone.
Although glioblastoma stem cells have been previously characterized following differentiation, they rarely have been used as a screening tool in both differentiated and undifferentiated forms. Due to the heterogeneous nature of a tumor, targeted agents may have widely divergent effects on the various subpopulations found in a patient, and it is critical to understand how these multiple cell types may respond differentially to treatment. The use of differentiated and undifferentiated cells derived from a single CSC line offers a unique opportunity to compare the effects of gene knockdown in 2 lines genetically identical but extensively different in gene expression patterns and overall morphology. The characterization of these various subpopulations and phenotypes could also be beneficial in the clinic as the ratios of each cell type likely vary from tumor to tumor and patient to patient. Even the 2 tumor isolates studied above generated differentiated lines that, although similar in marker expression, were phenotypically distinct and would possibly respond differently to treatment.
The application of subpopulation characterizations to cancer stem cells and the phenotypes generated through gene knockdown in those cells is an extension of previous work we have performed using these methods as compound selection tools in drug discovery. 1,2 We have found that they are useful to a wide range of screening settings and have been used at Eli Lilly to characterize differential subpopulations in standard transformed laboratory cell lines in settings ranging from cell cycle and apoptosis to angiogenesis. In several cases, the insights developed using subpopulation analysis identified both potential novel targets for drug discovery and compounds that had been previously overlooked in traditional target-based assays. In the case of cancer stem cells, the purpose of the heat maps as we see it is to allow for facile subpopulation analyses whereby individual parametric (or multiple) changes can be assigned to other concurrent events within the same cell or cell population. Thus, the ability to assign a particular cell cycle “compartment” to a change in a given analyte helps us to better understand the biology behind such changes. For example, in the NDNL2 knockdown samples, loss of nestin staining is independent of cell cycle compartment. In other words, reduced nestin expression occurs in all cells regardless of their cycling state.
The goal of modern cancer therapy is to stop tumor growth, most frequently through induction of apoptosis. Most anticancer agents, while using numerous mechanisms and pathways, attempt to attack a tumor by killing it. These treatments range from general cytotoxic agents to agents targeted to specific cellular pathways, as well as those attempting to restrict the vascularization of the tumor. We and others propose that tumor growth may also be stopped using differentiation events leading to eventual senescence. 27 This form of treatment may not be effective on all cellular subpopulations in a tumor but could be used to effectively treat the undifferentiated subpopulation of cancer stem cells that exist in many common human tumors. This form of treatment, used in conjunction with more traditional forms of anticancer treatments, may provide an additional method to target the most aggressive tumors and those most likely to recur after chemotherapy.