
Abstract
Filoviruses such as Ebola (EBOV) and Marburg (MARV) are single-stranded negative sense RNA viruses that cause acute hemorrhagic fever with high mortality rates. Currently, there are no licensed vaccines or therapeutics to counter filovirus infections in humans. The development of higher throughput/high-content primary screening assays followed by validation using the low-throughput traditional plaque or real-time PCR assays will greatly aid efforts toward the discovery of novel antiviral therapeutics. Specifically, high-content imaging technology is increasingly being applied for primary drug screening. In this study, the authors describe the challenges encountered when optimizing bioassays based on image acquisition and analyses for the highly pathogenic filoviruses Ebola and Marburg. A number of biological and imaging-related variables such as plating density, multiplicity of infection, the number of fields scanned per well, fluorescence intensity, and the cell number analyzed were evaluated during the development of these assays. Furthermore, the authors demonstrate the benefits related to the statistical analyses of single-cell data to account for heterogeneity in the subcellular localization and whole-cell integrated intensity of the viral antigen staining pattern. In conclusion, they show that image-based methods represent powerful screening tools for identifying antiviral compounds for highly pathogenic viruses.
Introduction
E
To circumvent current assay limitations, visual insights into host-pathogen interactions are important for the development of host-oriented therapeutics, as it will provide critical information regarding whether the disruption of viral processes by small-molecule therapeutics will result in cellular toxicity, phenotypic changes, and/or the modulation of host biological responses. In fact, major advances in optical microscopy combined with the power of automated image processing have led to development of high-content imaging (HCI) assays, 16 to measure multiple cellular responses to drugs or biological stimuli in single cells. This emerging technology has made a significant impact on drug discovery. However, application of this technology for the quantitative measurement of pathogen infected cells or phenotypic alterations of the host cells following pathogen infection is still fraught with logistic and technical difficulties for screening and identifying compounds against deadly pathogens.
The present work describes the development and optimization of the HCI assays for mammalian cells infected with Ebola (EBOV) and Marburg (MARV) filoviruses and addresses the challenges related to the bioassays, image processing, and the need for the development of improved analytical tools to account for heterogeneity in a biological response.
Materials and Methods
Cell culture
Vero76 (African green monkey kidney) cells (ATCC CRL-1587) were grown in Dulbecco’s minimal essential medium with low bicarbonate, 10% fetal bovine serum, 1 mM sodium pyruvate, and 1% nonessential amino acid.
Viral strains
Recombinant Zaire Ebola virus (EBOV) engineered to express the enhanced green fluorescent protein (EBOV-eGFP) gene was a kind gift from Dr. Stuart Nichol (Centers for Disease Control and Prevention [CDC], Atlanta, GA). The generation and characterization of this virus has been described previously. 17 The EBOV-eGFP and human-derived Marburg Musoke viruses were propagated in Vero76 cells, and viral titer was determined using a standard plaque assay. 5
Chemical library
The chemical library (580 compounds) used for screening represents a portion of the National Cancer Institute (NCI) diversity set and compounds accumulated from distinct sources. All compounds were dissolved in DMSO to a concentration of 10 mM. In the primary screen, compounds were tested at a final concentration of 20 µM with a final DMSO concentration of 0.5%.
Antibodies
The viral gene specific antibodies used in this study were Ebola Zaire anti-glycoprotein (GP) (6D8) and antimatrix protein VP40 (AE11) and Marburg Musoke anti-GP (9G4). All antibodies were tested for their specificity by Western blot analysis and by immunofluorescence. Purified mouse IgG (Invitrogen, Carlsbad, CA) was used as isotype control, whereas goat anti-mouse IgG (H+L), Dylight 488 conjugated (Thermo Scientific, Waltham, MA), and Zymax Rabbit anti-mouse IgG (H+L) alkaline phosphatase conjugate (Invitrogen) were used as secondary antibodies for immunofluorescence and Western blot analyses, respectively.
Western blots
Ebola antigen-specific antibodies anti-GP (6D8) and anti-VP40 (AE11) have been previously tested using Western blot and immunofluorescence. 11 The specificity of the Marburg viral antibodies was tested by Western blots using lysates generated from VLPs. Marburg VLPs were generated as previously described. 10,18 Briefly, Marburg VLPs were generated using recombinant baculovirus constructs expressing GP, VP40 matrix protein, and nucleoprotein (NP) from coinfected insect cells. After 48 h, supernatants were cleared of cellular debris, and VLPs were purified by sucrose step gradient ultracentrifugation. Purified VLPs (30 µg) were analyzed by immunoblotting.
Ebola infection assays
For Ebola infection assays, Vero76 cells (5-40 × 103 cells/well) were seeded in 96-well BD high-content imaging plates (BD Biosciences, Franklin Lakes, NJ) and allowed to incubate overnight. Next day, cells were infected with EBOV-eGFP (100-µL volume) at multiplicity of infection (MOI) of 5, unless indicated otherwise. The cells were incubated in the presence of the virus for 48 h at 37°C and 5% CO2. At the end of the incubation time, cells were fixed in 10% formalin for 3 days and then washed 3 times with phosphate-buffered saline (PBS). Cells infected with Ebola-eGFP were stained with HCS CellMask™ Deep Red cytoplasmic/nuclear stain (Invitrogen, 5 µg/mL diluted in PBS) and nuclear Hoechst dye 33342 (Invitrogen, 1 µg/mL diluted in PBS).
To correlate eGFP expression with Ebola infection, Vero cells infected with 5 MOI of EBOV-eGFP for 48 h were fixed, washed (as described above), and then incubated at room temperature (RT) with blocking buffer (3% bovine serum albumin [BSA]–PBS). After 1 h, cells were washed with PBS and incubated with anti-GP (6D8) antibody (4 µg/mL diluted in blocking buffer) or isotype control (4 µg/mL diluted in blocking buffer). For staining with anti-VP40 antibody, the cells were permeabilized with 0.2% Triton X-100 for 20 min at RT, washed, blocked, and then incubated at RT for 1 h with anti-VP-40 (AE11) antibody (4 µg/mL diluted in blocking buffer) or isotype control (4 µg/mL diluted in blocking buffer). After washing, cells were stained for 1 h at RT with goat anti-mouse Alexa 568 secondary antibody. The cells were washed with PBS and then stained with the HCS CellMask™ Deep Red cytoplasmic/nuclear stain (Invitrogen, 5 µg/mL diluted in PBS) and nuclear Hoechst dye 33342 (Invitrogen, 1 µg/mL diluted in PBS).
For compound screening, Vero cells (40,000 cells/well in a 96-well format) were pretreated with 20 µM of the compounds from the library or with different concentrations of Bafilomycin A1 (50, 100, 200, and 300 nM) for 1 h and then infected with 5 MOI of Ebola eGFP in the presence of compound. After 48 h, cells were fixed in 10% formalin for 3 days, washed with PBS, and then stained with nuclear Hoechst dye 33342 and CellMask™ Deep Red cytoplasmic/nuclear stain.
Marburg infection assays
For Marburg Musoke infection assays, cells were infected with 20 MOI of the virus (100-µL volume), unless indicated otherwise. After 2 h, cells were washed 3 times with PBS and then further incubated for 24, 48, or 72 h with complete medium (200-µL volume). At the end of the incubation time, cells were fixed in 10% formalin for 3 days and then washed 3 times with PBS. Cells were blocked for 1 h at RT or overnight at 4°C with 3% BSA prepared in PBS and then incubated with anti-Marburg GP monoclonal antibody (9G4, 2 µg/mL diluted in blocking buffer) for 1 h at RT. After washing with PBS, the cells were stained for 1 h at RT with rabbit anti-mouse Dylight 488 secondary antibody (2 µg/mL diluted in blocking buffer), washed, and then stained with CellMask™ Deep Red cytoplasmic/nuclear stain (Invitrogen, 5 µg/mL diluted in PBS) and nuclear Hoechst dye (Invitrogen, 1 µg/mL diluted in PBS).
Image acquisition
Automated image acquisition was performed using an Opera confocal reader (model 3842-Quadruple Excitation High Sensitivity [QEHS], PerkinElmer, Waltham, MA). Images were acquired as 2 exposures using a 10× air objective and a bin factor of 1. The first exposure used the 488-nm and 640-nm lasers to excite the viral and cell body fluorophores, respectively, and was directed to the sample with a 405/488/640-nm triple dichroic. The emission light was split by a 580-nm SP dichroic mirror and collected on separate cameras through 562/40-nm and 690/70-nm band-pass filters. The second exposure used a 425-nm LP to steer the UV (350 nm) to the sample (to excite the nuclear stain). The visible emission was directed to the nonconfocal camera by a 475-nm LP filter with the emission defined with a 450/50-nm band pass. An additional visible fluorophore was excited by a 561-nm laser with the emission directed to camera 1 and was directed to the sample with a 405/561/640-nm triple dichroic and 510-nm LP dichroic. The emission was defined with a 600/40-nm band-pass filter. Exposure 1 required identical UV filters be selected, but the arc lamp remained unchecked to collect data. The optimal z position for the 488-nm signal was determined using a delta correction script.
Image analysis
Images were analyzed within the Opera environment using standard Acapella scripts. The algorithm was used to identify objects such as nuclei based on Hoechst dye and cytoplasm based on CellMask™ Deep Red cytoplasmic/nuclear stain. The intensity and subcellular localization of viral infection was determined by either eGFP (EBOV-eGFP infection) or Dylight 488 (Marburg Musoke infection) fluorescence. For each condition, images from 6 fields/well (~1700 cells) were acquired with the script calculating the percent positive cells and the mean fluorescence intensities in the cytoplasmic, membrane, or nuclear region.
Statistical data analysis
Equations for signal-to-noise ratio, percent coefficient of variation, and Z′ values, as defined by Zhang et al 19 and Inglese et al, 20 were used for data analyses.
To determine the minimal number of cells required for the assay, single-cell data from all 6 fields/well were analyzed in Acapella and exported to Excel. To ensure statistical significance, single-cell data from each well infected with the virus were compared to wells with no virus under similar conditions using analysis of variance. The number of cells needed for analysis to be ensured of a percentage change of 20% to 100% in mean percent infection between the wells infected with virus and wells not infected with the virus was assessed at 95% and 99% confidence levels. A false negative (Type II) error rate of 20% was assumed. These analyses were performed using SAS, version 9.2 (Cary, NC) and NQuery Advisor, version 7.0 (Cork, Ireland).
Results
Optimization of Ebola infection assays
To monitor the replication of EBOV, Vero cells were infected with recombinant Ebola Zaire virus that was engineered to express the eGFP gene. The eGFP, expressed following EBOV infection, was distributed throughout the cytoplasm and was also present in the nucleus (
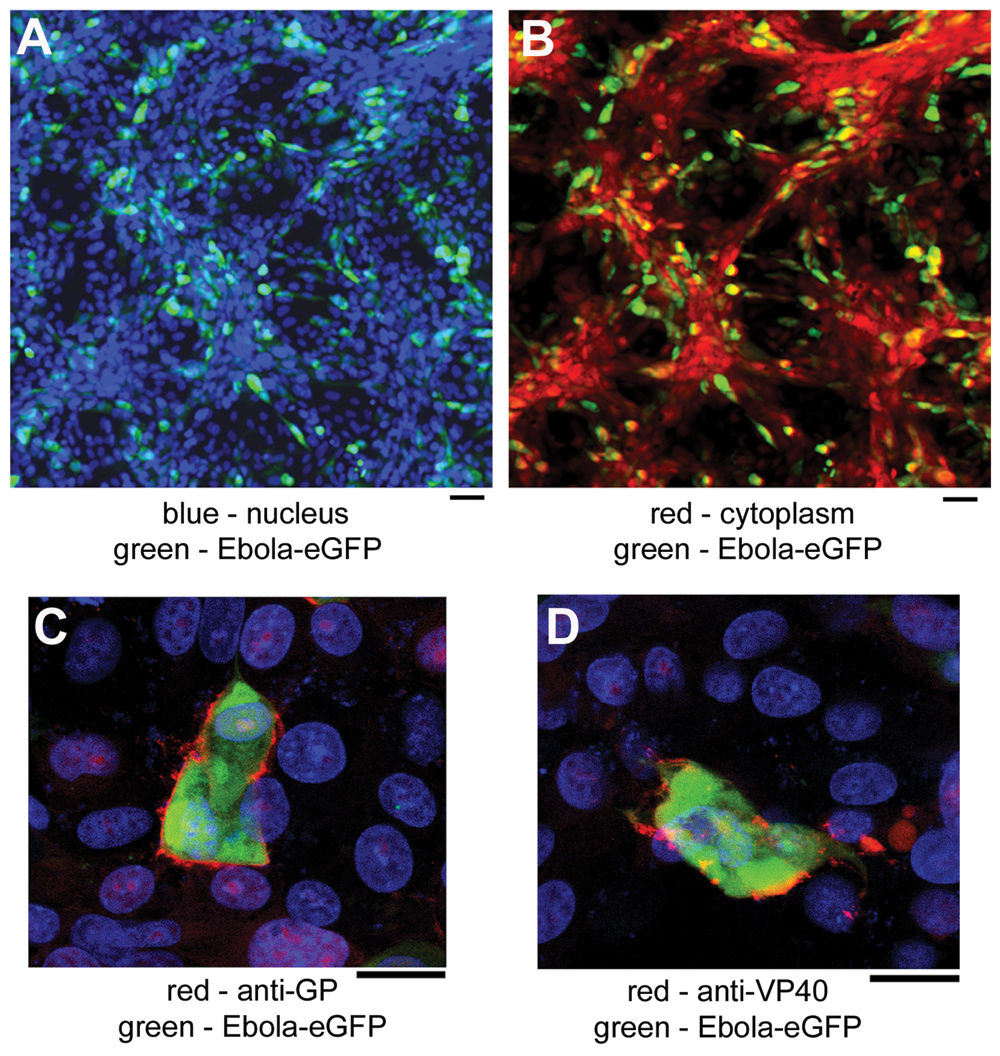
Automated imaging of Vero cells infected with Ebola enhanced green fluorescent protein (eGFP). (
To optimize the EBOV-eGFP infection assays for high-content screening purposes, several different variables such as cell number, MOI, and incubation time for viral infection were examined. The most critical variable was cell density, which was found to have a profound effect on viral infection and the robustness of the assay. Vero cells seeded at densities ranging from 5 × 10³ to 40 × 103 showed a cell number–dependent increase in EBOV-eGFP infection (
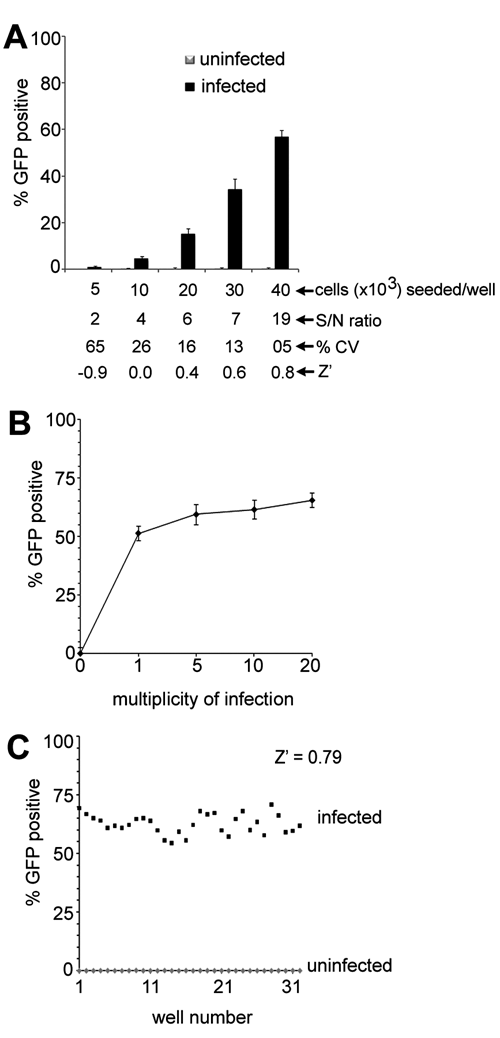
The efficiency of Ebola enhanced green fluorescent protein (eGFP) infection and robustness of the assay. (
Optimization of Marburg infection assays
Marburg virus–expressing eGFP is not currently available. Hence, to optimize the high-content imaging assay for Marburg Musoke infection, a monoclonal antibody targeting the viral GP was generated and tested in lysates of Marburg VLPs. Western blot analysis verified that the antibody specifically recognized the GP protein (
Optimization of the Marburg Musoke infection assay. (
To monitor the influence of cell density on Marburg viral infection, Vero cells were seeded at cell densities ranging from 5 × 10³ to 40 × 103/well and incubated for time points of 24, 48, and 72 h. Incubation times of 24 and 48 h indicated that approximately 1% and 4% of the cells, respectively, were infected with the virus (data not shown). At 72 h, the percentage of infected cells generally increased with increasing cell density. However, beyond 30,000 cells, the percent infection was reduced (
Image analysis to monitor viral replication
The requirement of a high cell number and longer incubation times for efficient viral infection, during which cells continue to divide, posed a challenging problem during image analysis. The cells took on a 3-D, tissue-like morphology with tightly bunched cells, which made it difficult to obtain an accurate segmentation of individual cells within each image (
Image segmentation and masks. Top panel: images acquired were segmented to mark the boundaries of individual objects. Left: images acquired from UV channel were used to mark the boundaries of the nuclei. Middle: cell boundaries were marked on the images obtained from a 640-nm laser channel (cytoplasm channel). Right: markings of the boundaries of the cells infected with green fluorescent protein (GFP)–labeled Ebola virus. Bottom panel: masks were created for individual objects using the boundaries defined by the corresponding images in the top panel. Left: nuclear mask. Middle: whole-cell mask; right: masks on viral infected cells overlaid on the whole-cell mask.
Heterogeneity in single-cell viral staining requires the determination of a minimum cell number to minimize data acquisition and analysis time, as well as to minimize data storage requirements. To this end, single-cell tables generated via Acapella were used to determine the minimum number of cells required to provide statistically significant data sets for both Marburg Musoke and Ebola infections. Initially, 6 fields/well were acquired using the 10× air objective, to ensure sufficient data set size for statistical analysis. The complete separation of the uninfected and infected distributions (data not shown) generated 99% and 95% confidence tables that were identical for both Ebola and Marburg Musoke and thus an identical minimum cell number for both infections (Suppl. Table S1 and
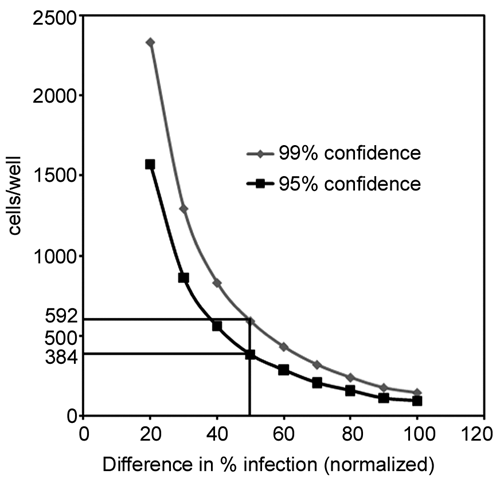
Statistical analysis of single-cell data. A plot showing the relationship between cells/well and percent change in infection (normalized).
Validation of the optimized Ebola-eGFP assay for compound screening
To test the potential of using the optimized HCI assay for small-molecule chemical screens, Vero cells were infected with EBOV-eGFP in the absence or presence of Bafilomycin A1, a potent and specific inhibitor of vacuolar H+ ATPase, which prevents endosome acidification. A dose-dependent reduction in EBOV-eGFP infection was observed with increasing concentration of Bafilomycin A (
Compound screening in the Ebola–enhanced green fluorescent protein (eGFP) infection assay. (
Screening for antiviral compounds
To further explore the potential of the HCI assay to identify antiviral compounds against EBOV infection, a chemical library consisting of 580 compounds was screened at a single concentration of 20 µM in duplicate plates against EBOV-eGFP infection. A representative scatter plot of the data is shown in
Discussion
The study of pathogens and their interaction with the host cells is a complex and dynamic process. Viral pathogens in particular are dependent on host cell machinery for successful infection and replication. Hence, image-based screens to monitor viral infection following either gene targeted knockdown strategies and/or treatment with chemical compounds will serve to identify critical host targets and therapeutic lead molecules. Imaging screens, as applied to infectious diseases, are highly challenging, especially for deadly pathogenic strains such as filoviruses, as the infections have to be performed in a Biosafety Level 4 (BSL4) environment, with all of the procedures for handling these infectious pathogens usually conducted under biological safety cabinets. The infection assays, although performed in a 96-well format, are higher throughput than the traditional methods used for therapeutic testing. Although dispensing of the virus in 384-well or higher well format is theoretically possible, it would require large liquid handling and robotic workstations and thus large dedicated safety cabinets. Moreover, the highly pathogenic nature of the viruses requires stringent fixation conditions for safety purposes. For developing assays, this must be taken into consideration as it may affect the fluorescence of the GFP protein or alter the recognition of epitopes by antiviral antibodies. The availability of the Ebola-eGFP virus that expresses eGFP during replication has made the assay design very simple, less time-consuming, and image processing easy due to the uniform expression of the measured response within the cell cytoplasm. However, careful consideration needs to be given if using viral antigen-specific antibodies that compartmentalize to different subcellular regions. The abundant distribution of the viral glycoproteins on the plasma membrane requires accurate image segmentation by the masking script. The nonuniform “hot spot” staining on the plasma membrane (frequently at the top of the cell) with Ebola anti-VP40 antibody makes this antibody a poor choice for screening, as images taken in a single confocal plane would result in the inaccurate measurement of infected cells. This problem can be overcome by taking serial z sections of the cells; however, this would result in longer imaging and processing times and increase data storage requirements.
Another important parameter dictated by the biology was the requirement of plating a high cell number and a 48- to 72-h infection period for optimal replication and spread of the virus. This resulted in cells showing tissue-like 3-D morphology instead of a single monolayer. However, this biological challenge was addressed by (1) collecting the data at the lowest possible magnification (10× air) and the highest possible resolution (bin factor 1), (2) using accurate segmentation algorithms to locate and define cells or subcellular structures (i.e., nucleus, cytoplasm, plasma membrane), and (3) selecting the optimal focal plane during imaging. Thus, the biology dictated some of the criteria and conditions selected for image acquisition and processing.
In addition to the biological assay, it was important to optimize the image acquisition and analysis steps to account for the heterogeneity in the measured response, reduce data storage, and shorten the screening time. One approach that was employed was to minimize the number of fields imaged/well without compromising the statistical validity. Specifically, statistical analysis of single-cell data revealed that images from a minimum of 592 cells (single field) were sufficient to provide 99% confidence for data sets, when 50% of the cells exhibited viral infection or inhibition.
During image processing, a wide variety of measurements, including shapes, textures, intensities, and localizations, can be captured, which are then used to create unique representations, or “phenotypic signatures,” of each cell. For the viral infection assays, some of the parameters that were analyzed were the staining intensity of the nuclei and the cytoplasm (for Ebola-eGFP infection), the staining intensity in the plasma membrane (for Marburg infection), nucleus size, total number of cells analyzed, and number and percentage of cells that showed virus-positive staining. Measurement parameters such as the fluorescence intensity of viral infected cells and the percentage of cells infected together may provide clues regarding whether compounds are inhibiting viral replication or viral spread. Customized data-mining algorithms and statistical tools are currently being developed to address this issue.
Finally, we successfully applied an optimized infection assay to screen for antiviral compounds. The image-based screens allowed for cellular quantitation of the viral infection based on fluorescence intensity in whole cells and also identified compounds that exhibited cellular toxicity. A reduction in cell number observed for high concentrations (20 µM) of compounds NSC 168468 or 188491 was a clear indication of cellular toxicity. Such quantitative measurements will help facilitate the discarding of false positives, as well as identify small-molecule “hits” for lead optimization. Compound NSC 168468 has been reported to have multidrug resistance (MDR) selective activity, 21 and this may account for its observed cellular toxicity. Compound NSC 188491 is a nucleoside analog and has been shown to be a moderate activator of p53, 22 as well as an inhibitor of both protein kinase C and positive transcription elongation factor b. 23 Based on our dose-response study, compound NSC 188491 showed a 70% inhibition of viral replication (at a low compound concentration of 1.5 µM) and a much reduced cell toxicity, thereby suggesting that this compound may be a promising lead for guiding the identification of a more potent analog with a reduced toxicity profile. Recently, a similar image-based screening approach was applied to identify an Ebola inhibitor. 24 Although the biological conditions used for the infection assay in both studies were similar, the present study provides a detailed report of the steps that were involved during the assay optimization. In addition, in this study, we used the Evotec (PerkinElmer) Opera instrument equipped with 4 cameras for simultaneous imaging and parallel image processing capability, thereby increasing the overall speed of image acquisition and analysis. The flexibility of the Acapella image-processing software allows for customizing scripts based on the unique requirement of different applications.
In conclusion, we have developed and optimized high-content imaging assays for quantitating mammalian cells infected with the lethal filoviruses Ebola and Marburg. Similar approaches can be applied for developing screening assays for other pathogenic viruses—after taking into consideration the biology (cell types, viral pathogenicity, cell morphology, and antigen localization) and issues related to image acquisition and analysis.
Footnotes
Acknowledgements
We thank Lindsay Longobardi for technical support and Diana Fisher for statistical analysis of the data.
This project was funded by the Defense Threat Reduction Agency (to RGP and SB). Opinions, interpretations, conclusions, and recommendations are those of the authors and are not necessarily endorsed by the US Army.