
Abstract
Compounds that interfere with the synthesis of either mitochondrial DNA or mtDNA-encoded proteins reduce the levels of 13 proteins essential for oxidative phosphorylation, leading to a decrease in mitochondrial adenosine triphosphate (ATP) production. Toxicity caused by these compounds is seldom identified in 24- to 72-h cytotoxicity assays due to the low turnover rates of both mtDNA and mtDNA-encoded proteins. To address this problem, the authors developed a 96-well format, high-content screening (HCS) assay that measures, in eukaryotic cells, the level of Complex IV–subunit 1, an mtDNA-encoded protein synthesized on mitochondrial ribosomes, and the level of Complex V–α subunit, a nuclear DNA-encoded protein synthesized on cytosolic ribosomes. The effect of several antibiotics and antiretrovirals on these 2 proteins was assessed, in transformed human liver epithelial cells, 6 days after compound treatment. The results confirmed effects of drugs known to reduce mtDNA-encoded protein levels and also revealed novel information showing that several fluoroquinolones and a macrolide, josamycin, impaired expression of mtDNA-encoded proteins. The HCS assay was robust with an average Z′ factor of 0.62. The assay enables large-scale screening of compounds to identify those that potentially affect mtDNA-encoded protein levels and can be implemented within a screening paradigm to minimize compound attrition.
Introduction
T
Recent advances in screening methods in the field of mitochondrial biology have revealed that drug-induced mitochondrial dysfunction is a contributing factor to toxicity. 2 Mitochondria make 95% of the cell’s adenosine triphosphate (ATP) and are also essential for many other functions such as fatty acid oxidation, steroid synthesis, heme synthesis, and apoptosis. Structurally complex, mitochondria contain several hundred copies of circular DNA (mitochondrial DNA), ribosomes, 22 types of tRNA, and more than 1000 types of proteins. 3 Thirteen polypeptides, all subunits of proteins involved in oxidative phosphorylation, are encoded by mtDNA and synthesized on mitochondrial ribosomes. All other proteins located within mitochondria are nuclear DNA encoded, synthesized on cytosolic ribosomes, and subsequently imported to the mitochondria.
Drugs that interfere with the synthesis of either mtDNA or mtDNA-encoded proteins impair oxidative phosphorylation, causing a decrease in the cell’s ATP supply. As a consequence, adverse events such as lactic acidosis, lipodystrophy, myelosuppression, peripheral neuropathy, and optic neuropathy are associated with these drugs. 4 Notable examples of such drugs are nucleoside reverse transcriptase inhibitors (NRTIs) and some antibiotics. 4 NRTIs, given in the treatment of human immunodeficiency virus (HIV) infection, can potentially affect an off-target, DNA polymerase γ, the enzyme responsible for replicating mtDNA. As a result, mtDNA replication is affected, 4,5 with a subsequent decrease in mtDNA-encoded proteins. Antibiotics that target protein synthesis on bacterial ribosomes as their primary mode of action can also decrease mtDNA-encoded proteins because bacterial ribosomes and mitochondrial ribosomes share structural similarities, 6,7 a characteristic thought to be due to the evolutionary origin of mitochondria from bacteria. 3
Although 24- to 72-h high-throughput cell viability/cytotoxicity assays are routinely used in compound toxicity screening, they seldom identify compounds that reduce levels of mtDNA-encoded proteins. This is because both mtDNA and the proteins they encode have low turnover rates. 3 For instance, the half-life of mtDNA from rat liver is ~10 days, 8 and the half-life of the 3 mtDNA-encoded subunits of Complex IV from the rat hepatoma cell line, H4-II-E, is ~4 days. 9 Moreover, the proteins involved in oxidative phosphorylation have to fall below a critical threshold in order for mitochondrial ATP synthesis to be impaired, the threshold varying for each cell type. 3 Hence, compounds that alter mtDNA-encoded protein levels have usually been detected by Western blotting 6 or lateral-flow dipstick immunoassays 10 of cells grown in the compound of interest for several days, but neither of these techniques is amenable to high-throughput screening (HTS). To address this problem, we have developed a high-content screening (HCS) assay that identifies compounds that affect mtDNA-encoded protein levels in adherent eukaryotic cells. This 96-well format HCS assay measures the level of Complex IV–subunit 1, an mtDNA-encoded protein synthesized on mitochondrial ribosomes, and the level of Complex V–α subunit, a nuclear DNA-encoded protein synthesized on cytosolic ribosomes and imported to mitochondria. To validate the assay, several antibiotics and NRTIs were screened for their effect on Complex IV–subunit 1 and Complex V–α subunit levels in transformed human liver epithelial (THLE-2) cells, 6 days after compound treatment. We show that the HCS assay identified drugs that are known to impair mtDNA-encoded protein levels and also revealed novel information on a 16-membered lactone ring macrolide and several bacterial topoisomerase inhibitors. The HCS assay was robust with an average Z′ factor of 0.62 and can be implemented in large-scale compound screening to identify compounds that affect mtDNA-encoded protein levels.
Materials and Methods
All chemicals were purchased from Axxora LLC (San Diego, CA), Toronto Research Chemicals (Toronto, Canada), or Sigma (St. Louis, MO), except for trovafloxacin, which was obtained from Pfizer’s chemical sample bank (Groton, CT). Cell culture media and supplements were from Lonza (Walkersville, MD) and Invitrogen (Carlsbad, CA).
Mouse monoclonal antibodies against Complex I–NDUFB8 subunit (clone 20E9DH10C12), Complex II–30kD subunit (clone 21A11AE7), Complex IV–subunit 1 (clone 1D6E1A8), Complex IV–subunit 2 (clone 12C4F12), and Complex V–α subunit (clone 15H4C4) were from MitoSciences Inc. (Eugene, OR). The mouse monoclonal antibody against mitochondrial heat shock protein 70 was from Thermo Fisher Scientific (Rockford, IL). Alexa Fluor®488 goat anti-mouse IgG2a antibody and Alexa Fluor®594 goat anti-mouse IgG2b antibody were from Invitrogen. The IRDye 680–conjugated goat anti-mouse antibody was from LI-COR Biosciences (Lincoln, NE).
THLE-2 cell culture conditions
THLE-2 cells (catalog CRL-2706) were obtained from the American Type Culture Collection (ATCC; Manassas, VA) and subcultured less than 14 times. The cells had a doubling period of 24 h. The cell culture medium used for these cells was made as specified by the ATCC and contained bronchial epithelial cell basal medium (Lonza, Walkersville, MD) supplemented with the individual components of a bronchial epithelial growth media bullet kit (with the exception of gentamicin and epinephrine) from Lonza, 10% fetal bovine serum, 5 ng/mL epidermal growth factor, 70 ng/mL phosphoethanolamine, and 50 units/mL penicillin-streptomycin. Cells were grown in a cell culture incubator at 37°C in a 5% CO2 atmosphere.
Immunostaining procedure in the HCS assay
THLE-2 cells were seeded in collagen-coated black-walled clear-bottom 96-well plates at 1000 cells/200 µL/well in cell culture medium. The plates were incubated overnight at 37°C in 5% CO2 to allow attachment of cells to the plates. Stock solutions of compounds were made in DMSO. The following day, the culture medium in the 96-well plates was replaced with culture medium containing the test compounds at the desired concentrations, the final DMSO concentration being 0.5%. Vehicle-treated samples had DMSO added at 0.5% with no compound. Cells were then grown in the presence of the compounds at 37°C in 5% CO2 for 6 days, with the medium and compounds being replaced on the fourth day. After a 6-day compound treatment, the cells were rinsed twice in phosphate-buffered saline (PBS), fixed in 4% paraformaldehyde in PBS at room temperature for 20 min, rinsed 3 times in PBS, permeabilized in 0.1% Triton X-100/PBS for 10 min, blocked in 10% goat serum/PBS for 1 h at room temperature, and incubated overnight at 4°C in 50 µL/well of the following primary antibodies in 10% goat serum/PBS: 7.5 µg/mL anti–Complex IV–subunit 1 antibody (IgG2a isotype) and 2.5 µg/mL anti–Complex V–α subunit (IgG2b isotype). The next day, the cells were rinsed 3 times in 1% goat serum/PBS and incubated for 2 h at room temperature, away from light, in 50 µL/well of the following secondary antibodies in 10% goat serum/PBS: 2 µg/mL Alexa Fluor®488 goat anti-mouse IgG2a antibody (to visualize Complex IV–subunit 1) and 2 µg/mL Alexa Fluor®594 goat anti-mouse IgG2b antibody (to visualize Complex V–α subunit). The cells were rinsed 3 times in PBS and the nuclei stained with 300 nM 4′,6-diamidino-2-phenylindole dihydrochloride (DAPI) for 10 min. The plates were then sealed and either scanned as described in the next section or stored at 4°C in the dark and scanned the following day.
HCS analyzer settings and image analysis
The 96-well plates were scanned in a Thermo Fisher Scientific Cellomics® ArrayScan® VTI High Content Screening Reader using a 10× objective. The fluorescence of the 3 dyes—DAPI (representing the nuclei), Alexa Fluor®488 (representing Complex IV–subunit 1), and Alexa Fluor®594 (representing Complex V–α subunit)—was measured in channels 1, 2, and 3, respectively. Image analysis was done using the Compartmental Analysis Bioapplication (Thermo Fisher Scientific). Details on the parameter settings used for the image analysis are shown in
Parameter Settings Used in the Image Analysis
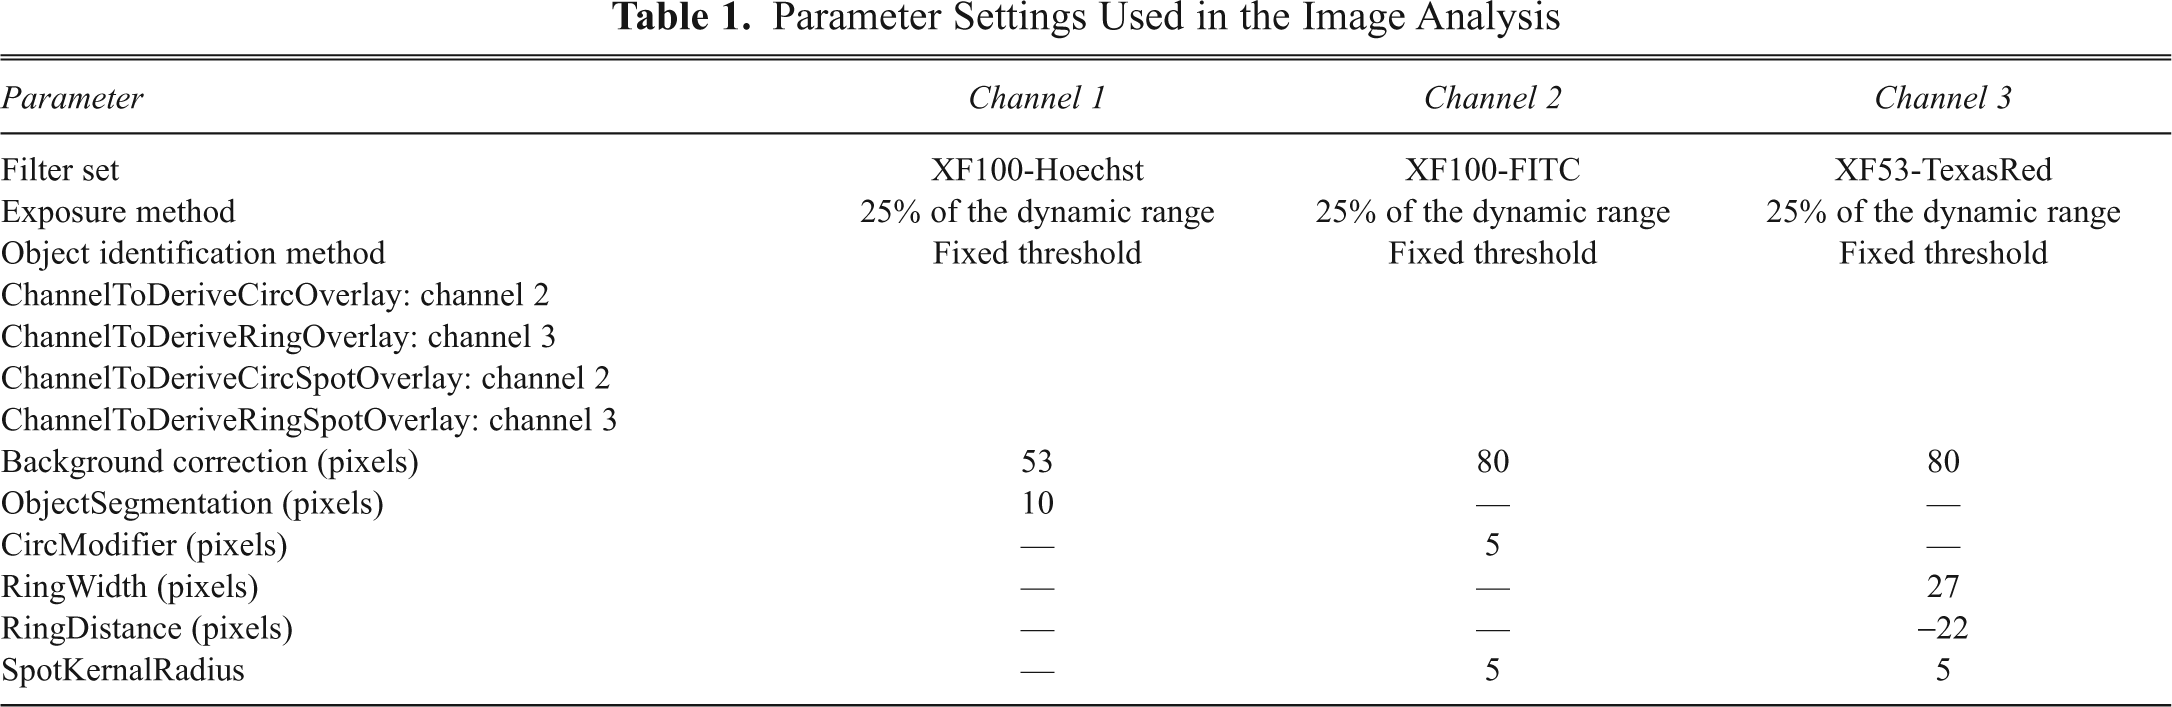
Raw data were exported from vHCS™View (Thermo Fisher Scientific), and IC50 values were generated using GraphPad Prism 4 (San Diego, CA) with nonlinear regression analysis.
The signal-to-noise ratio (S/N) was defined as S/N = |µc − µb|/[(σc 2 + σb 2))^0.5], where µc and σc are the mean and standard deviation of the fluorescence signal obtained with the secondary antibody in the presence of the primary antibody, and µb and σb are the mean and standard deviation of the fluorescence signal obtained with the secondary antibody in the absence of the primary antibody.
The Z′ factor was calculated using the formula Z′ = 1 − 3(σp + σn)/|µp − µn|, where µp and σp are the mean and standard deviation of the positive control, respectively, and µn and σn are the mean and standard deviation of the negative control. 11
Gel electrophoresis and Western blotting
THLE-2 cells were seeded in collagen-coated 6-well plates at 30,000 cells/well in cell culture medium and incubated overnight at 37°C, 5% CO2. The following day, the cell culture medium was replaced with culture medium containing the test compounds at the desired concentrations, the final DMSO concentration being 0.5%. Vehicle-treated samples had DMSO added at 0.5% with no compound. After compound treatment, cells were collected by trypsinization, centrifuged at 25,000 g for 10 min, rinsed in PBS, and lysed in extraction buffer containing 50 mM Tris, 150 mM NaCl, 0.5% NP40 (nonyl phenoxylpolyethoxylethanol), and 1% protease inhibitor cocktail (Sigma P8340), pH 7.4. Protein concentrations of the lysed samples were determined by the BCA method (Thermo Fisher Scientific).
Twenty-µg aliquots of protein were subjected to sodium dodecyl sulfate polyacrylamide gel electrophoresis on NuPAGE® Novex® 12% Bis-Tris gels (Invitrogen) with NuPAGE® MOPS SDS Running buffer (Invitrogen) and then transferred to polyvinylidine difluoride membranes using NuPAGE® Transfer buffer (Invitrogen) supplemented with 20% methanol. Membranes were blocked in blocking buffer (Rockland Immunochemicals, Boyertown, PA) for 1 h and incubated overnight, at 4°C, in a cocktail of the following antibodies diluted in the blocking buffer/0.1% Tween-20: anti-mitochondrial heat shock protein 70 (mtHSP70) antibody diluted 500-fold (per manufacturer’s instructions), 0.1 µg/mL anti–Complex V–α subunit antibody, 5 µg/mL anti–Complex II-30kD subunit antibody, 1 µg/mL anti–Complex IV–subunit 2 antibody, and 1 µg/mL anti–Complex I-NDUFB8 antibody. The membranes were rinsed 3 times in PBS/0.1% Tween-20 and incubated for 1 h, away from light, in IRDye 680-conjugated goat anti-mouse antibody (LI-COR Biosciences) diluted to 0.2 µg/mL in blocking buffer/0.1% Tween-20. The membranes were rinsed 3 times in PBS/0.1% Tween-20 and finally in PBS. The proteins were visualized with an Odyssey Infrared Imaging System (LI-COR Biosciences).
Results
HCS assay performance
The aim of this study was to develop an HCS assay that detects compounds that affect mtDNA-encoded protein levels in adherent eukaryotic cells. To find an optimal plating density, THLE-2 cells were plated at densities of 300 to 5000 cells/well in 96-well plates, left to adhere overnight at 37°C in 5% CO2, treated with the vehicle (0.5% DMSO), grown for 6 days, fixed, immunostained, and subjected to quantitative image analysis. Six days after vehicle treatment, THLE-2 cells plated at ≥3000 cells/well were overconfluent, cells plated at ≤400 cells/well were sparse, and cells plated at 1000 cells/well were 70% to 80% confluent. We selected 1000 cells/well as the optimal plating density. Complex IV–subunit 1 was chosen as the marker for an mtDNA-encoded protein due to the availability of a suitable antibody for visualizing this protein. To verify that the test compounds do not alter protein synthesis on cytosolic ribosomes, the assay was multiplexed so that the level of Complex V–α subunit, a nuclear DNA-encoded protein made on cytosolic ribosomes, could be monitored. Both the anti–Complex IV–subunit 1 antibody and the anti–Complex V–α subunit antibody have been shown to identify proteins localized in the mitochondria. 10,12,13
Optimal concentrations of each antibody for the assay were determined by titrating each of the primary antibodies separately with a varying amount of the appropriate isotype-specific secondary antibody. The fluorescence signal due to Complex IV–subunit 1 was measured as the Mean CircSpot Total Intensity in channel 2, and the fluorescence signal due to Complex V–α subunit was measured as the Mean RingSpot Total Intensity in channel 3 (see Materials and Methods). For Complex IV–subunit 1, the highest S/N ratio (see Materials and Methods) was obtained with 7.5 µg/mL anti–Complex IV–subunit 1 antibody and 2 µg/mL Alexa Fluor®488 goat anti-mouse IgG2a antibody (S/N was 15.6). For Complex V–α subunit, the highest S/N ratio was obtained with 2.5 µg/mL anti–Complex V–α subunit antibody and 2 µg/mL Alexa Fluor®594 goat anti-mouse IgG2b antibody (S/N was 9.2).
A series of control experiments was performed to determine possible effects of interference of fluorescence signals with accuracy of image analysis. Fluorescence due to Alexa Fluor®488 goat anti-mouse IgG2a antibody in the absence of the anti–Complex IV–subunit 1 antibody was negligible (
Determination of Possible Interference of Fluorescence Signals with Accuracy of Image Analysis
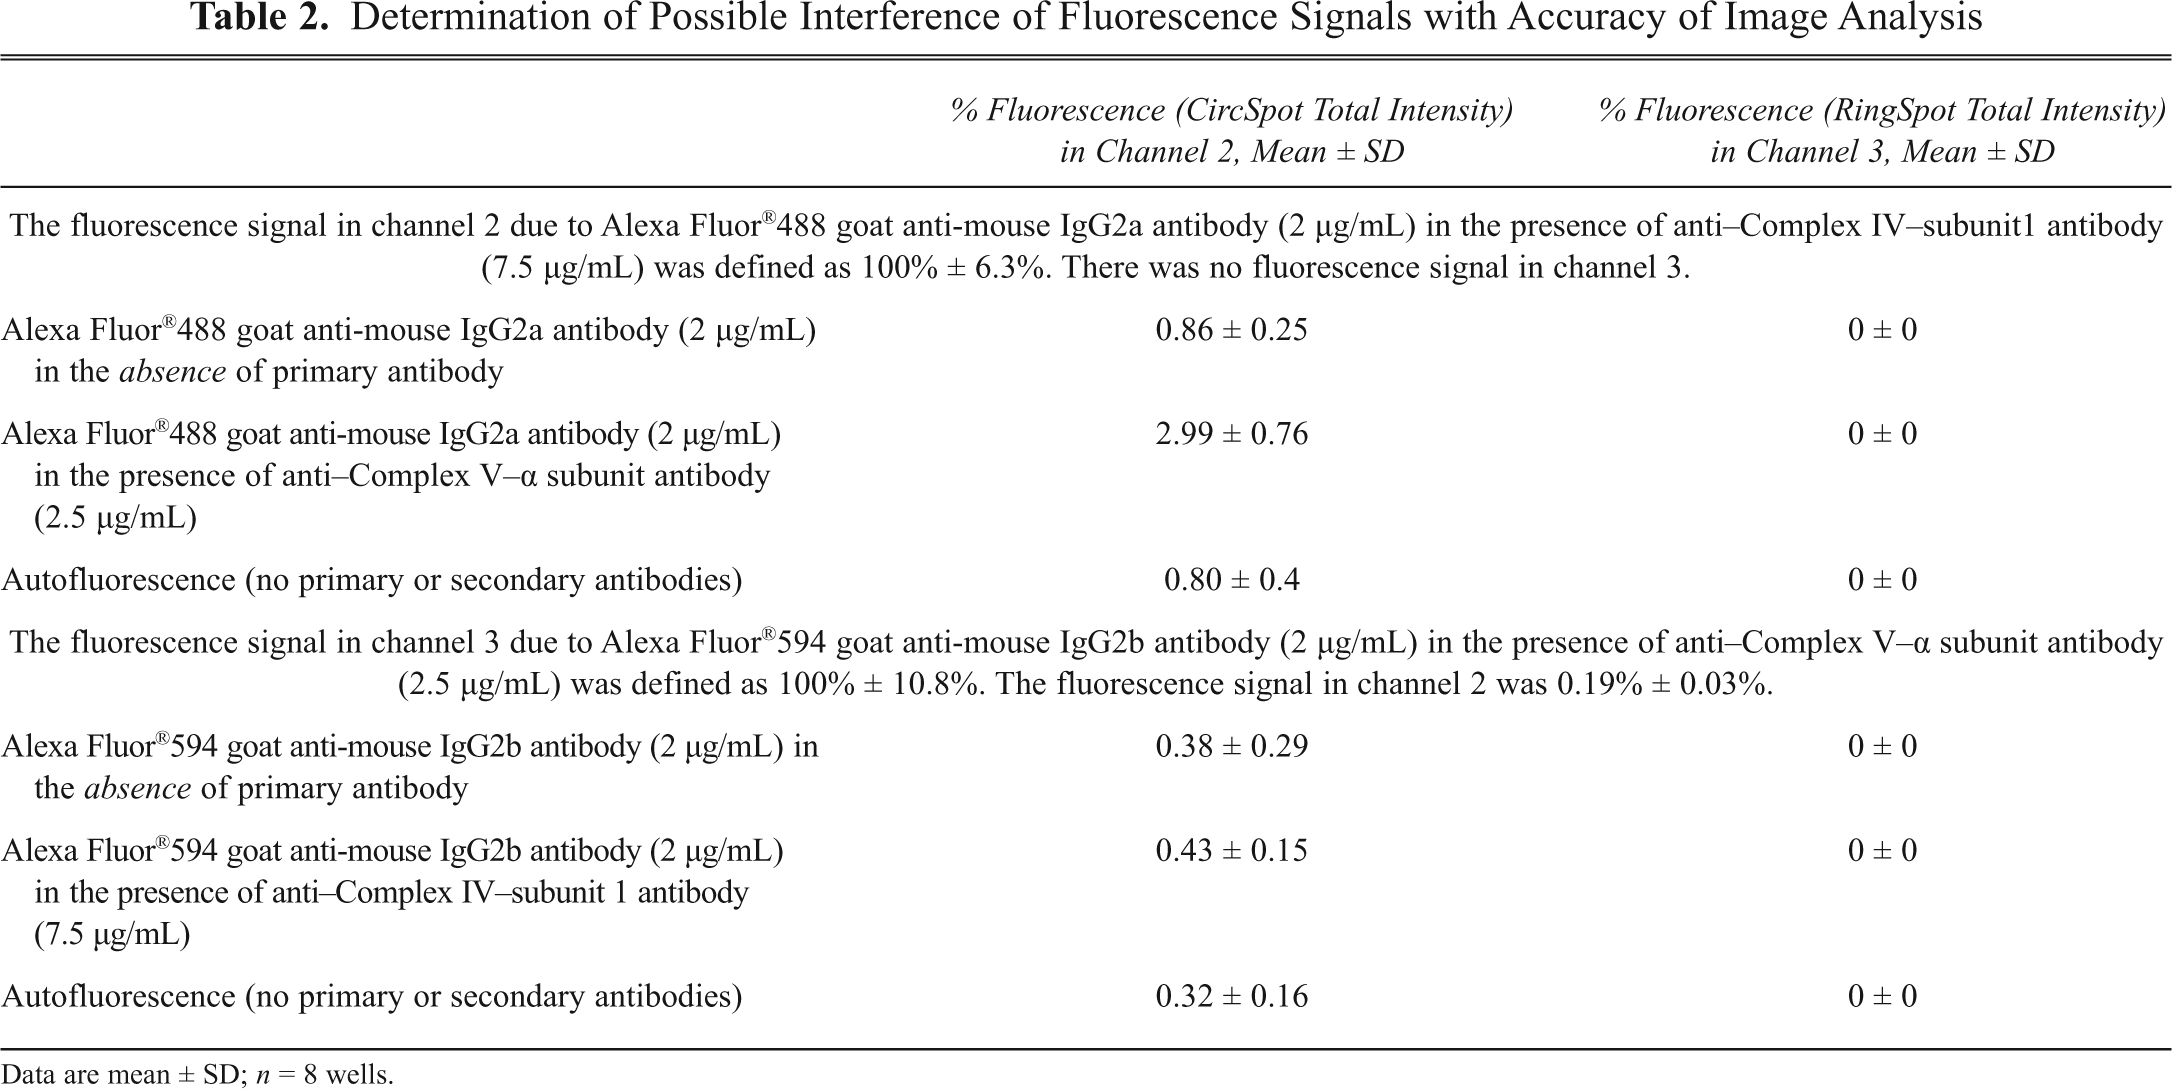
Data are mean ± SD; n = 8 wells.
To validate the HCS assay, THLE-2 cells were grown in 100 µM linezolid for 6 days in the 96-well format, and the levels of Complex IV–subunit 1 and Complex V–α subunit were measured by quantitative image analysis. Linezolid, an antibiotic that impairs bacterial protein synthesis,
14
was chosen as a positive control because it is known to impair protein synthesis on mitochondrial ribosomes as an off-target, causing a decrease in mtDNA-encoded protein levels,
6
and 100 µM linezolid decreased Complex IV–subunit 1 levels (
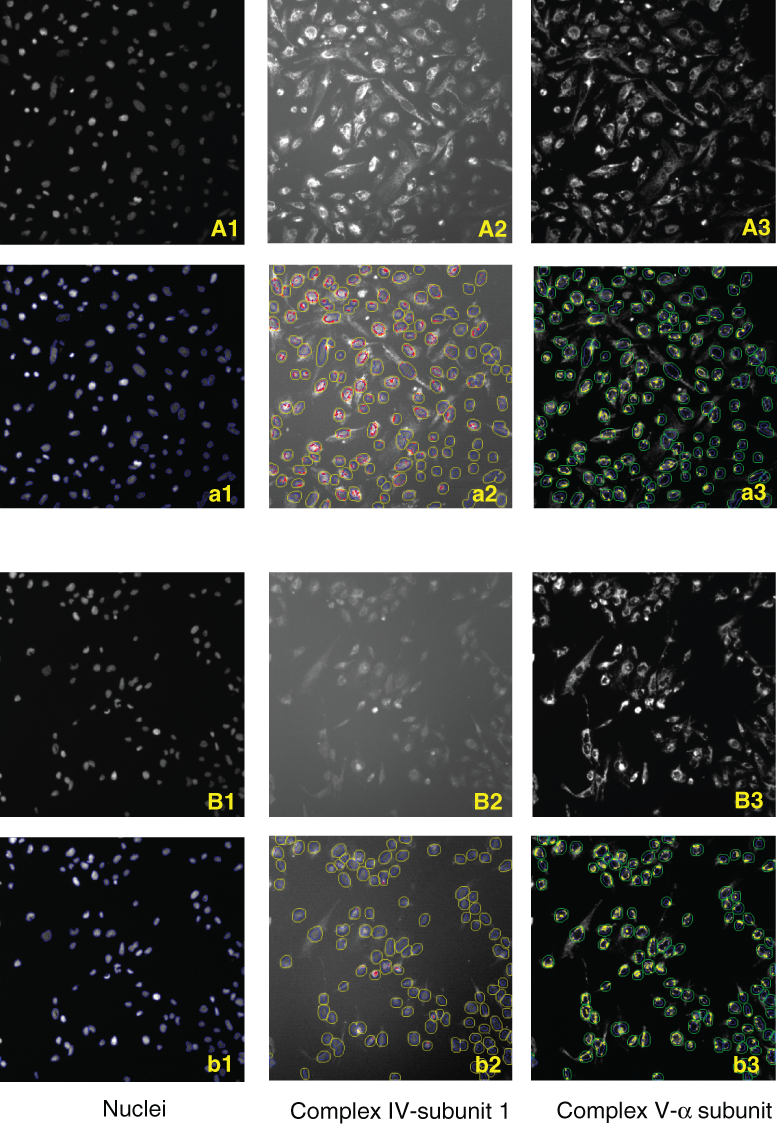
High-content screening (HCS) image analysis of transformed human liver epithelial (THLE-2) cells grown in (
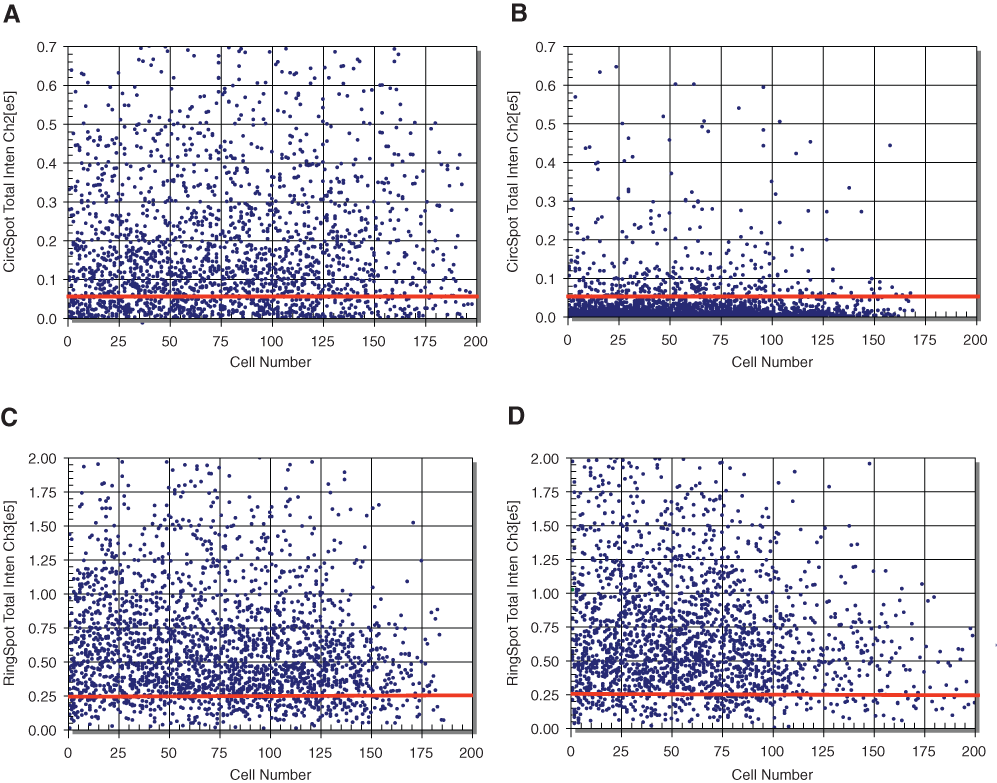
Scatter plots of Complex IV–subunit 1 levels (represented by the CircSpot Total Intensity in channel 2) and Complex V–α subunit levels (represented by the RingSpot Total Intensity in channel 3) in vehicle-treated transformed human liver epithelial (THLE-2) cells (
To assess the robustness of our HCS assay in its ability to detect changes in Complex IV–subunit 1 levels, we measured the assay’s Z′ factor. The Z′ factor of an assay is a statistical parameter indicating assay performance. 11 The positive control was 100 µM linezolid, and the negative control was the vehicle. The Z′ factor measured on 3 separate occasions using the Mean Circ Spot Total Intensity in channel 2 (i.e., the fluorescence signal due to Complex IV–subunit 1) ranged from 0.51 to 0.75, with an average of 0.62. Because assays with Z′ factors between 0.5 and 1.0 are considered robust and reliable, 11 we were satisfied with the performance of our HCS assay.
HCS of antibiotics that target bacterial ribosomes
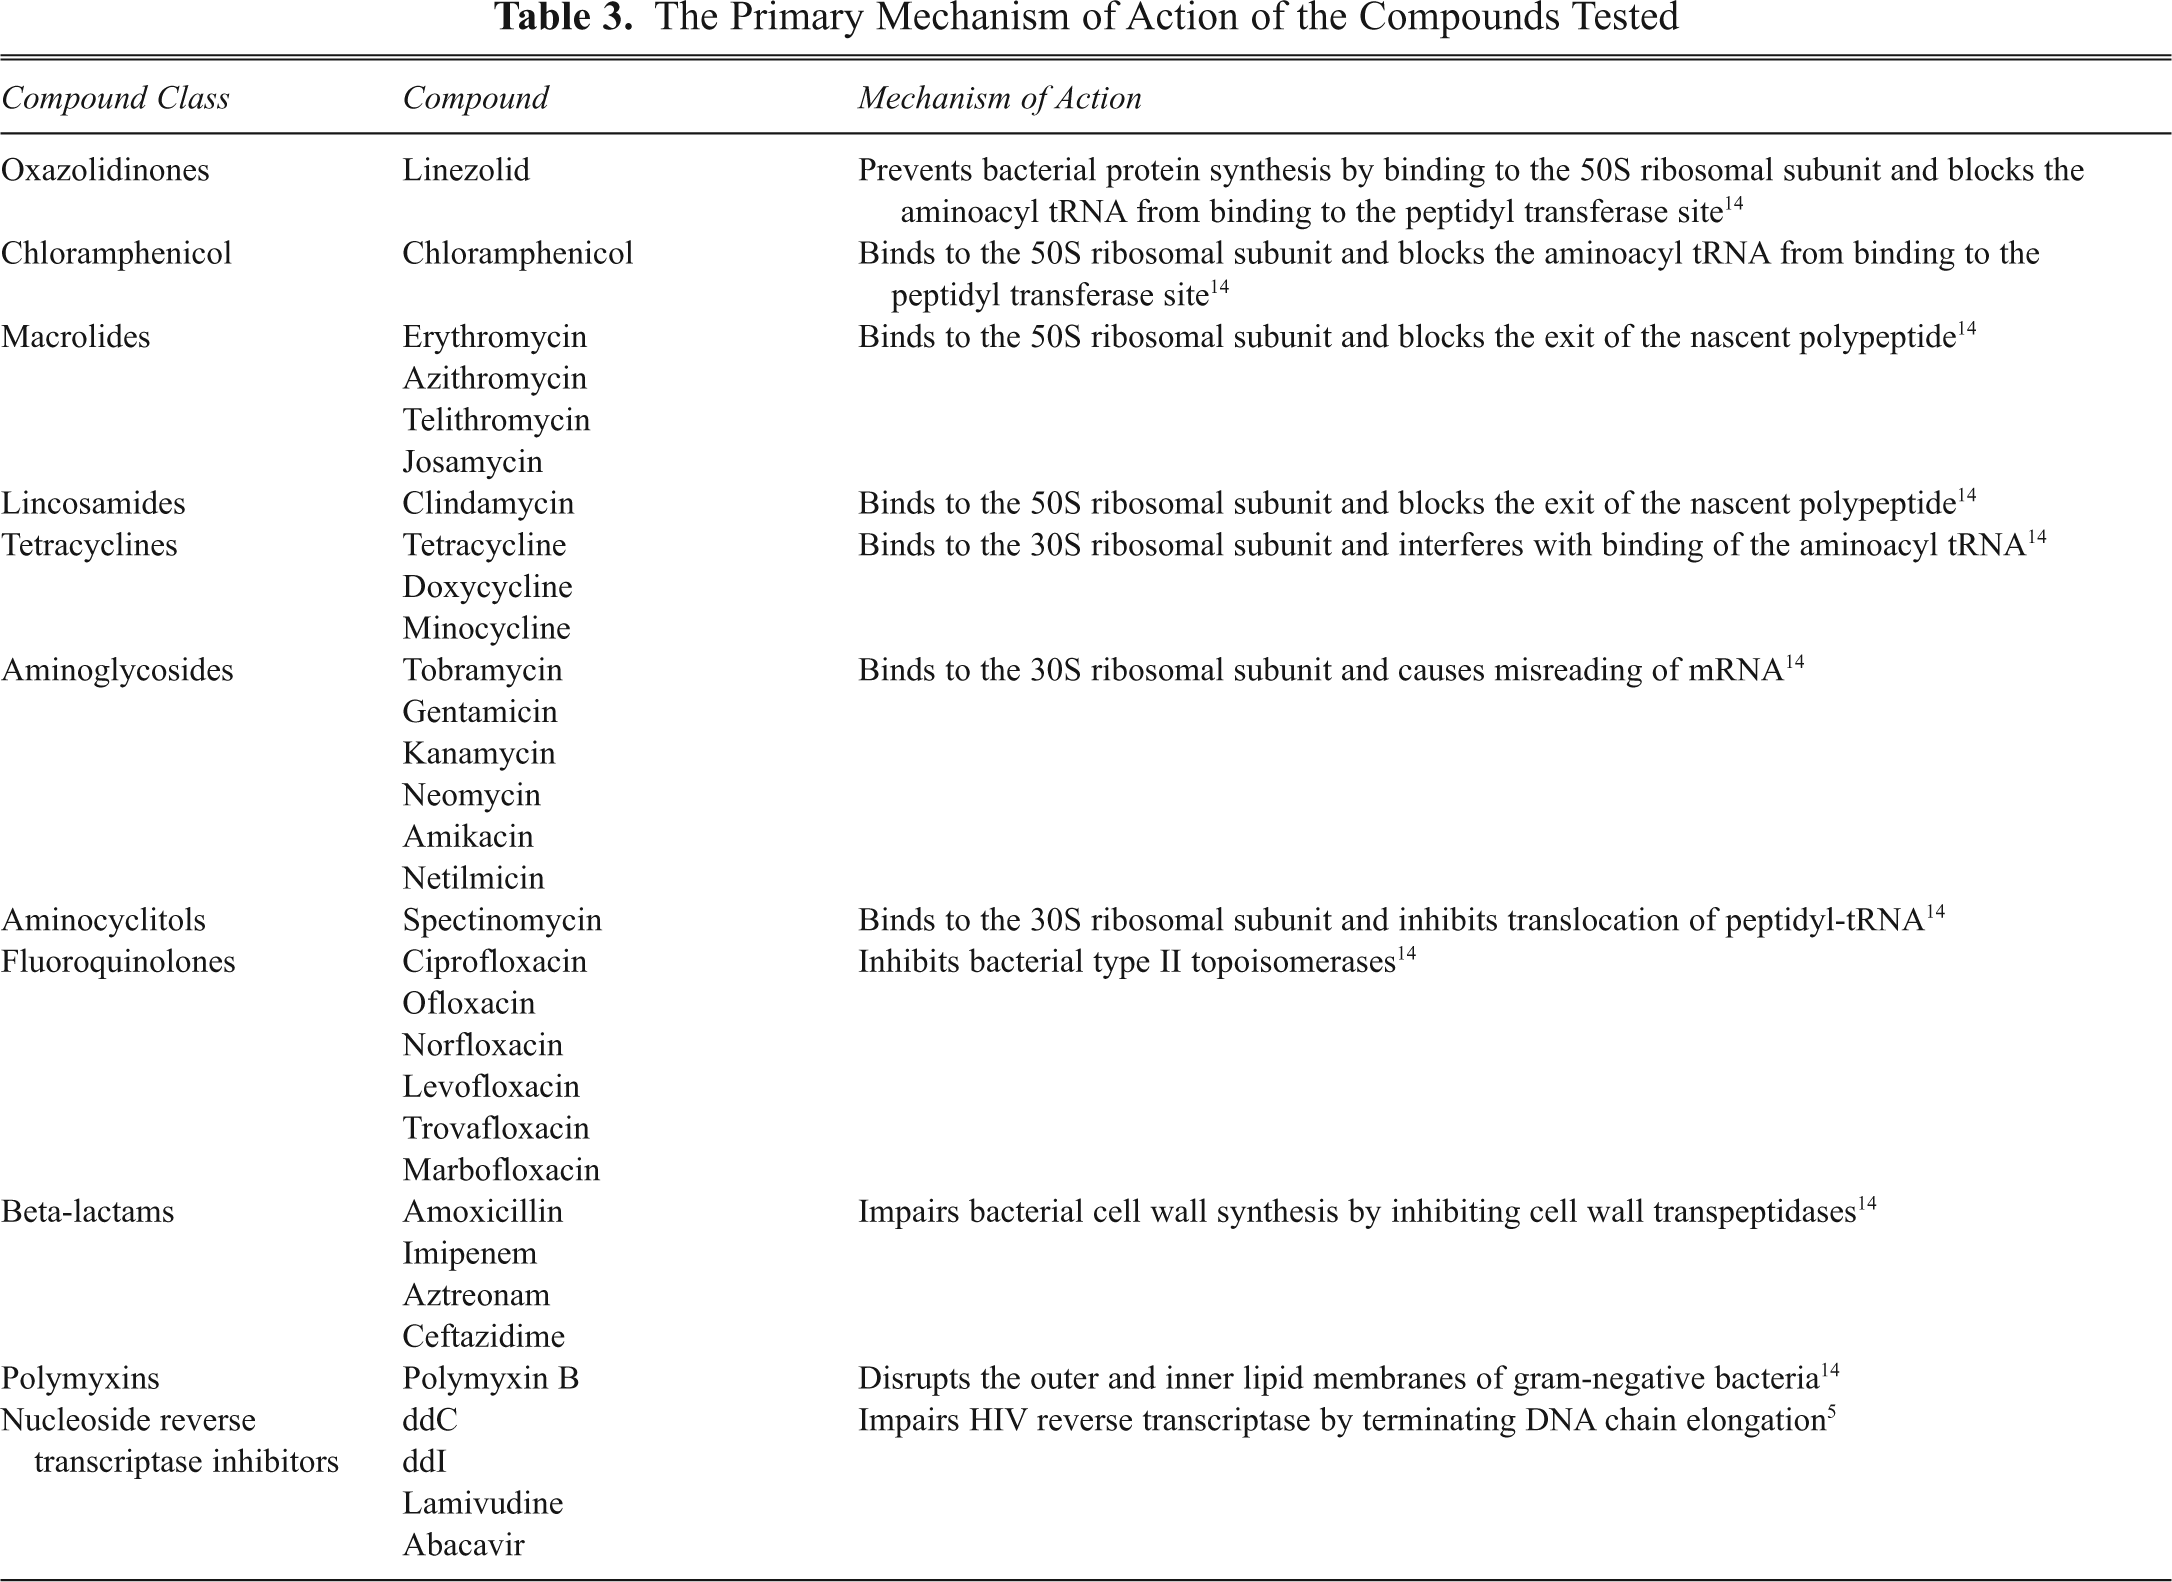
We next tested the effect of a selection of ribosomal antibiotics (
The Primary Mechanism of Action of the Compounds Tested
Linezolid (
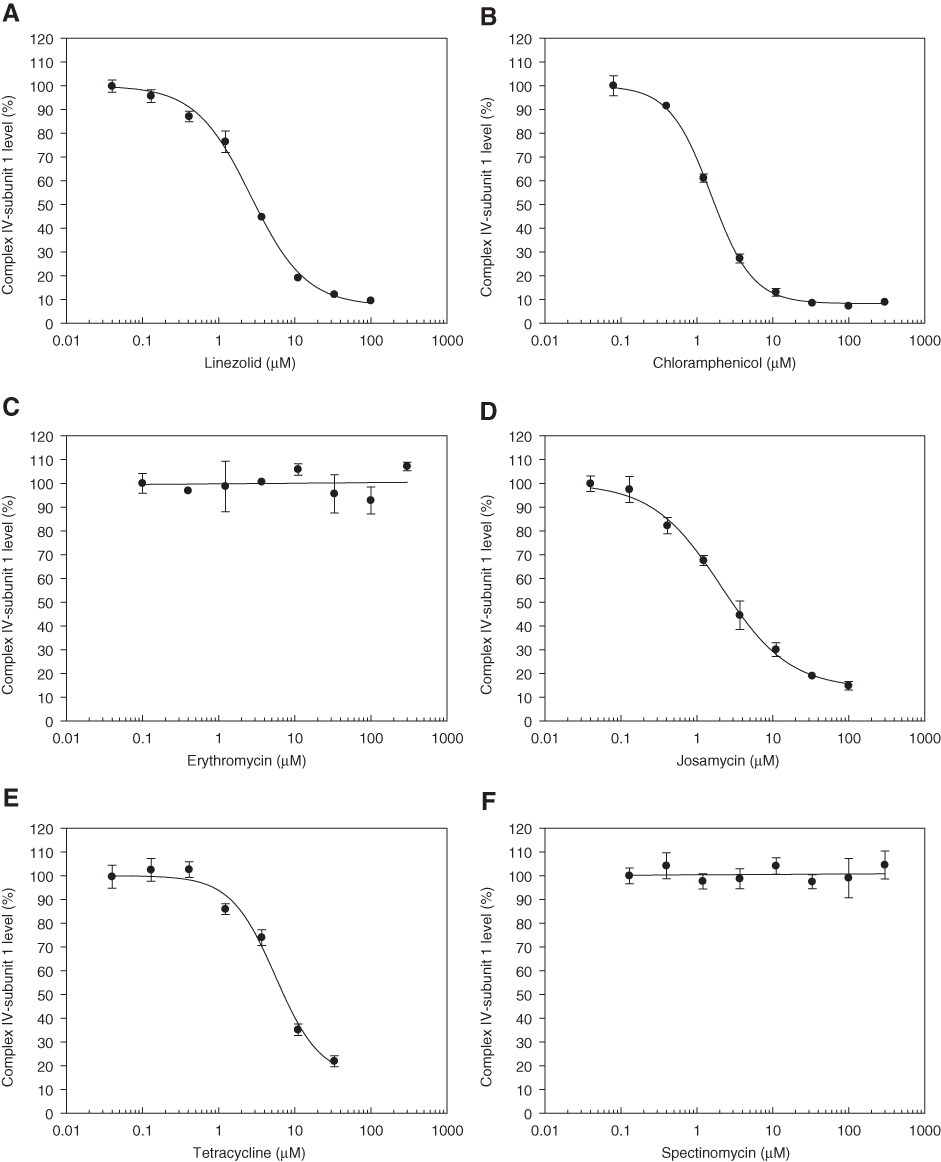
Concentration response plots of (
The Effect of the Test Compounds on the Levels of Complex IV–Subunit 1 and Complex V–α Subunit in Transformed Human Liver Epithelial (THLE-2) Cells, 6 Days after Compound Treatment
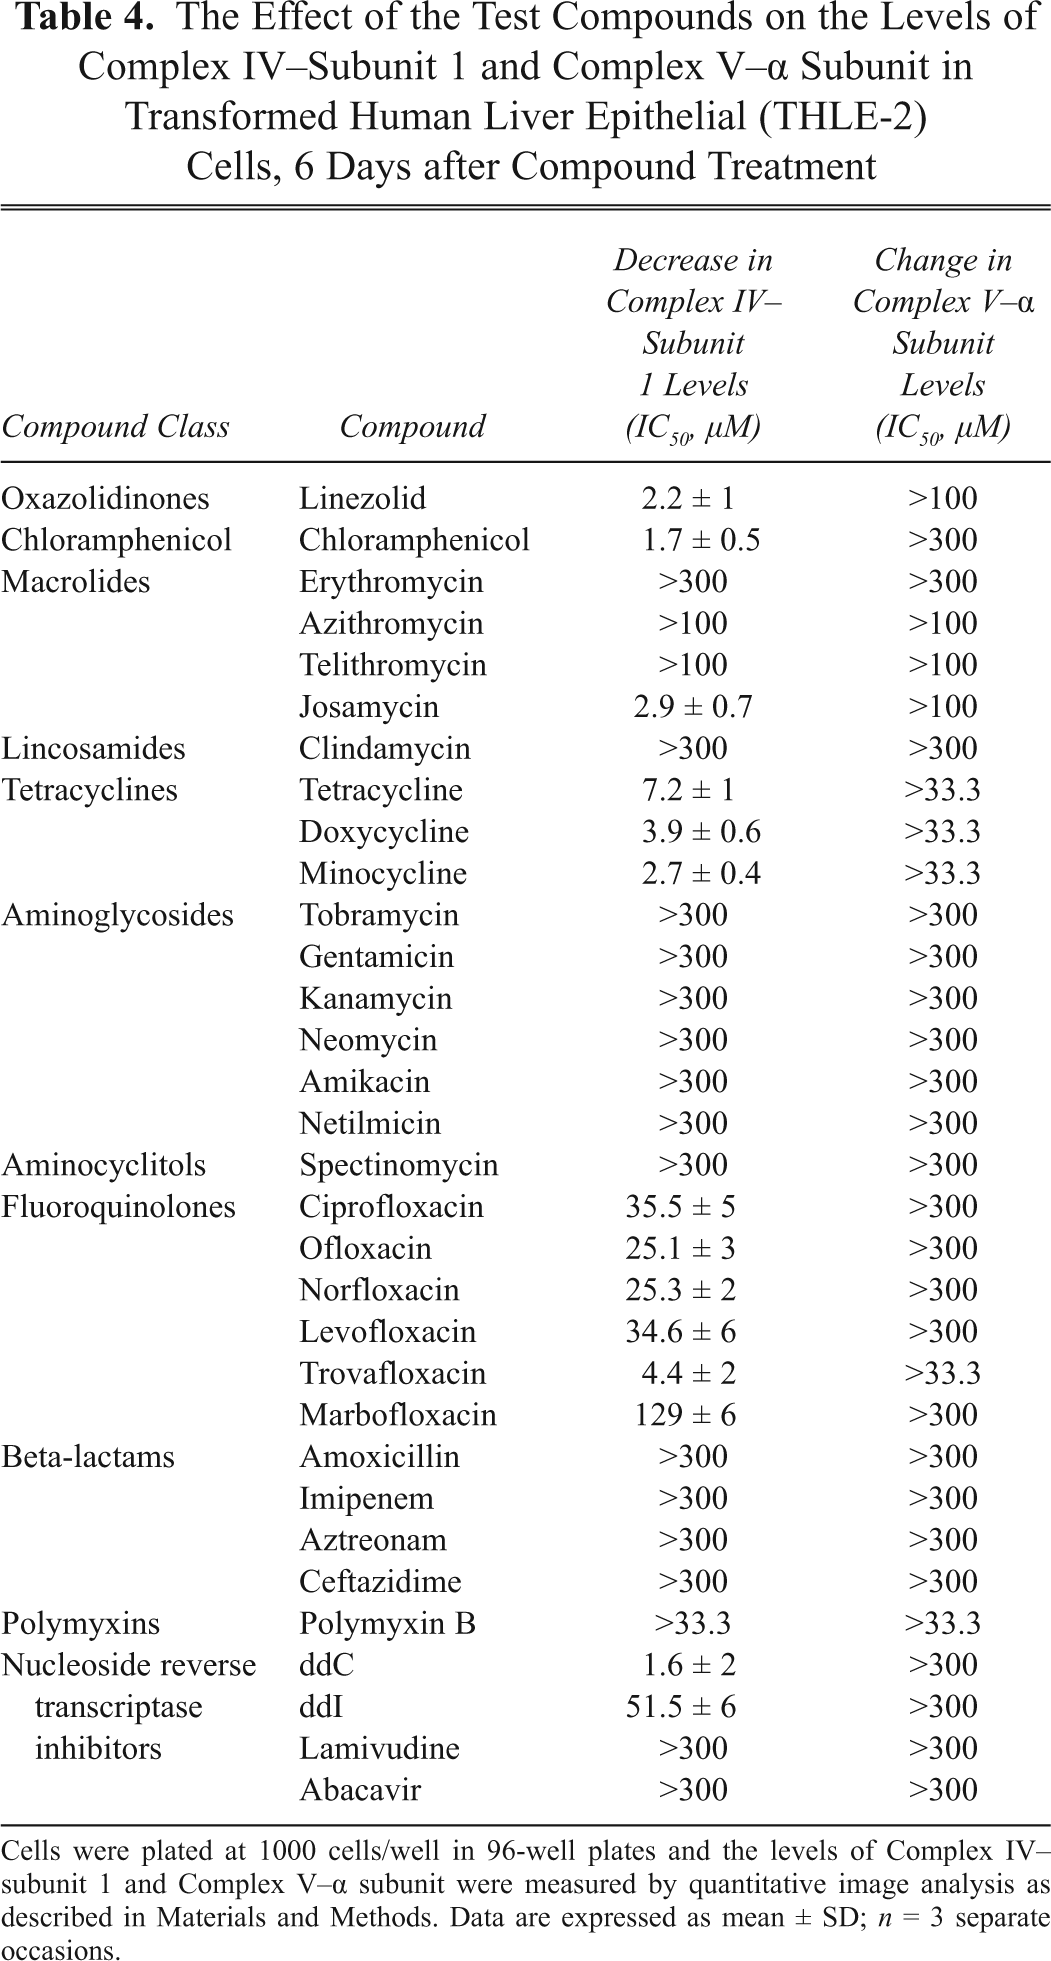
Cells were plated at 1000 cells/well in 96-well plates and the levels of Complex IV–subunit 1 and Complex V–α subunit were measured by quantitative image analysis as described in Materials and Methods. Data are expressed as mean ± SD; n = 3 separate occasions.
The macrolide, erythromycin, had no impairment on Complex IV–subunit 1 levels in THLE-2 cells (
Tetracycline (
HCS of antibiotics that target bacterial DNA synthesis
Antibiotics that target bacterial DNA synthesis include the fluoroquinolones, drugs that inhibit bacterial type II topoisomerases.
14
Ciprofloxacin, ofloxacin, norfloxacin, and levofloxacin decreased Complex IV–subunit 1 levels in THLE-2 cells with similar IC50 values (
Western blot analysis of THLE-2 cells grown in a selection of fluoroquinolones
To obtain an independent cross-check of the decrease in mtDNA-encoded protein caused by the fluoroquinolones in the HCS assay, we performed a Western blot analysis of THLE-2 cells grown in 3 fluoroquinolones, ciprofloxacin, ofloxacin, and norfloxacin. The proteins were analyzed with a cocktail of antibodies against mtDNA-encoded Complex IV–subunit 2 (a sub-unit of Complex IV different from that measured in the HCS assay) and 4 nuclear DNA-encoded proteins: mtHSP70, Complex V–α subunit, Complex II–30kD subunit, and Complex I–NDUFB8 subunit. The Complex I–NDUFB8 subunit, although nuclear DNA encoded, requires the presence of mtDNA-encoded Complex I subunits for its assembly into Complex I.
Western blot analysis of cells grown in 100 µM ciprofloxacin for 2 days showed a slight decrease in the levels of both Complex IV–subunit 2 and Complex I–NDUFB8 subunit, in comparison with vehicle-treated cells (
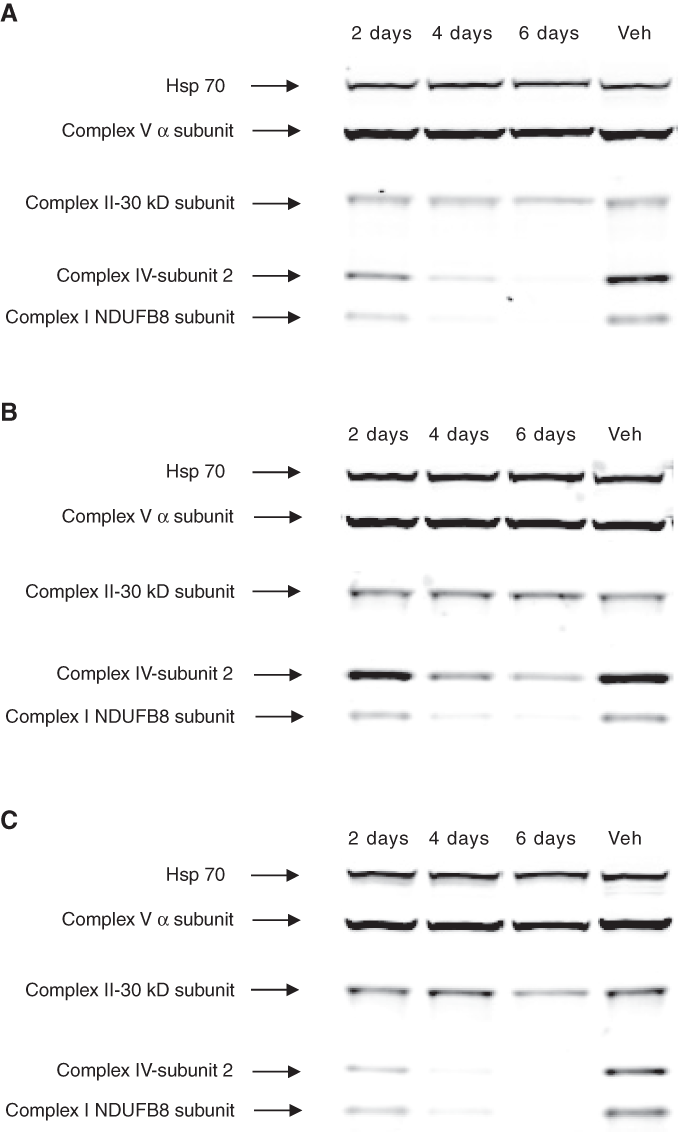
Western blot analysis of transformed human liver epithelial (THLE-2) cells grown in (
Overall, the Western blot results corroborated the HCS assay results, showing that ciprofloxacin, ofloxacin, and norfloxacin, at 100 µM, markedly reduced the level of mtDNA-encoded proteins, over a 6-day treatment.
HCS of antibiotics that disrupt either bacterial cell wall synthesis or bacterial lipid membranes
Amoxicillin, imipenem, aztreonam, and ceftazidime, antibiotics that impair bacterial cell wall synthesis by inhibiting cell wall transpeptidases,
14
did not change Complex IV–subunit 1 levels in THLE-2 cells even at 300 µM, nor did they change Complex V–α subunit levels (
HCS of nucleoside reverse transcriptase inhibitors
Four NRTIs were tested for their effect on the levels of both Complex IV–subunit 1 and Complex V–α subunit in THLE-2 cells, 6 days after compound treatment. 2′, 3′-dideoxycytidine (ddC) and 2′, 3′-dideoxyinosine (ddI) decreased Complex IV–subunit 1 levels, with ddC being more potent (
Discussion
The aim of the present study was to develop an HCS assay that identifies compounds that affect mtDNA-encoded protein levels in adherent eukaryotic cells, as these compounds are seldom identified in 24- to 72-h cytotoxicity assays. Our HCS assay was designed so that the level of an mtDNA-encoded protein synthesized on mitochondrial ribosomes could be monitored along with the level of a nuclear DNA-encoded protein synthesized on cytosolic ribosomes. However, mtDNA-encoded protein levels could potentially be measured with other parameters of cell health such as mitochondrial membrane potential. Although the HCS assay was done in 96-well format, it could conceivably be done in 384-well format. However, there may be technical difficulties in maintaining cells in a monolayer over a 6-day period in a 384-well format due to the very small surface area in each well. In addition, certain types of adherent cells may not grow well in a monolayer over several days even in a 96-well format: in our experience, HepG2 cells tended to grow in clumps after 3 to 4 days.
The HCS assay that we developed was able to identify drugs that are known to impair mtDNA-encoded protein levels. One of these drugs is linezolid, an antibiotic that prevents bacterial protein synthesis by blocking aminoacyl tRNA from binding to the peptidyl transferase center within the 50S subunit of the bacterial ribosome. 14 Besides acting on its intended target, linezolid can also block protein synthesis on mitochondrial ribosomes. 7 Nagiec et al. 6 have shown, by Western blotting, that linezolid decreases Complex IV–subunit 1 levels in human erythroleukemia cells. The decrease in Complex IV–subunit 1 seen in linezolid-treated THLE-2 cells in our HCS assay is in accord with these results.
The HCS assay also confirmed the inhibitory effect of chloramphenicol on mtDNA-encoded protein levels in THLE-2 cells (
Our results from the HCS assay showed that the macrolides, erythromycin (
Little is known about the effect of bacterial type II topoisomerase inhibitors on either mtDNA synthesis or mtDNA-encoded protein synthesis. Mammalian mitochondria are known to have type I and type II topoisomerases, enzymes that cleave one or both strands of DNA duplex, respectively.
18
However, the homology between mitochondrial type II topoisomerase and its bacterial counterpart is not known. Our results showed that the fluoroquinolones had a strong effect in decreasing mtDNA-encoded proteins, whereas nuclear-DNA-encoded protein levels were unaffected (
The HCS assay identified ddC and ddI as drugs that decrease mtDNA-encoded protein, whereas no decrease was seen with lamivudine or abacavir (
In conclusion, we developed a robust 96-well format, image-based HCS assay to identify compounds that affect mtDNA-encoded protein levels in adherent eukaryotic cells. The assay enabled us to identify compounds that are known to interfere with mtDNA/mtDNA-encoded protein synthesis. Moreover, our results revealed new information, showing that josamycin and several fluoroquinolones can decrease mtDNA-encoded protein levels. The assay can be implemented in large-scale compound screening, early in preclinical safety assessments, to help minimize compound attrition.
Footnotes
Acknowledgements
We sincerely thank Dr. Sesha Tekur (Thermo Fisher Scientific) for valuable support and advice on imaging.