
Abstract
CL-Quant is a new solution platform for broad, high-content, live-cell image analysis. Powered by novel machine learning technologies and teach-by-example interfaces, CL-Quant provides a platform for the rapid development and application of scalable, high-performance, and fully automated analytics for a broad range of live-cell microscopy imaging applications, including label-free phase contrast imaging. The authors used CL-Quant to teach off-the-shelf universal analytics, called standard recipes, for cell proliferation, wound healing, cell counting, and cell motility assays using phase contrast movies collected on the BioStation CT and BioStation IM platforms. Similar to application modules, standard recipes are intended to work robustly across a wide range of imaging conditions without requiring customization by the end user. The authors validated the performance of the standard recipes by comparing their performance with truth created manually, or by custom analytics optimized for each individual movie (and therefore yielding the best possible result for the image), and validated by independent review. The validation data show that the standard recipes’ performance is comparable with the validated truth with low variation. The data validate that the CL-Quant standard recipes can provide robust results without customization for live-cell assays in broad cell types and laboratory settings.
Keywords
Introduction
C
High-content, long-term, label-free assays provide a useful tool for drug discovery, toxicology, and bioproduction, as well as for stem cell and cancer research. Common applications include the quantification of cell region growth, cell counts, cell motion, wound healing, apoptosis, neurite outgrowth, angiogenesis tubule formation, and fluorescence intensity/expression levels over time. Walk-away automation is required, and high-content image analytics (analysis module) must reliably and accurately discriminate target structures (cell bodies, cell regions, etc.) without human interaction, across a range of complex imaging conditions (both biological and systematic).
Live-cell kinetic phenotypes characterizing cells undergoing dynamic interactions are highly complex. The conventional high-content analytics that rely on simple thresholding on high signal-to-noise (S/N) florescence staining are inadequate for measuring kinetic phenotypes. Consequently, analytics are developed by teams of highly skilled algorithm scientists for very specialized assay and imaging conditions, 1-14 which is a costly and time-consuming process, and the resulting analysis modules cannot be easily updated for changing assay conditions such as cell types or imaging platforms. A totally new generation of analysis technology is required.
CL-Quant (Nikon Corporation, Yokohama, Japan) is a new solution platform for broad, high-content, and live-cell image analysis. Its machine learning technologies and teach-by-example interfaces make it possible for nonexperts to quickly create scalable and novel image analytics.
CL-Quant contains the following teachable core modules:
Image segmentation: teachable enhancement of image patterns of interest for cellular region segmentation
Region partition: teachable enhancement of cell boundaries for fine cellular region partition
Phenotyping: teachable measurement discrimination rules for object classification
The key common attributes of these machine learning–based modules are as follows:
Intuitive learning: teach-by-example interfaces
Fast learning: instant feedback of learning results
Incremental learning: error correction update
Stable learning: maintaining previous outcomes while adding new examples
Soft outcome: output confidence values (0-255) rather than binary data for flexible use
We used CL-Quant machine learning modules to teach off-the-shelf, universal analytics called “standard recipes” for cell proliferation, cell count, wound healing, and cell motility applications, using the standard graphical user interfaces without special programming. Similar to application modules, standard recipes are intended to work robustly across a wide range of assay conditions (different cell types, magnifications, operators, etc.) without modification by the end user. However, recipes are different from traditional modules because they encode user teaching rather than image- processing programming. Thus, they are a dynamic algorithm that can be created or updated through user teaching, rather than a fixed algorithm that can be configured through parameter modification. Here we report the validation of these fully automated standard recipes.
Materials and Methods
Imaging system and image acquisition
Live-cell, phase contrast movies were acquired for this study using the BioStation CT and IM incubation and imaging systems. The BioStation CT allows imaging experiments to be conducted without removing the cells from the incubator. Consisting of a standard-sized tissue culture incubator with an inverted microscope inside, BioStation CT holds 30 vessels ranging from 96-well plates to 75-cm2 flasks, which are moved between the microscope stage and the vessel rack via a robotic device while maintaining precise levels of CO2, humidity, and temperature. BioStation CT acquires images from 2× to 40× magnification with apodized phase contrast (APC) optics and 2× to 40× magnification with fluorescent images using 3-color LED illumination.
The BioStation IM is a compact cell incubation and monitoring system that facilitates a broad array of long-term time lapse experiments, including studies of cell growth, morphology, and protein expression, by providing consistent environmental control of temperature, humidity, and gas concentration in combination with phase and fluorescence imaging of exceptional quality.
Cell proliferation benchmark images
Forty phase contrast movies of cells growing in culture were acquired on the BioStation CT of 7 cell types (CHO, Cos-7, HEK193, HeLa, INS1, NIH3T3, PC12), imaged every 30 min for 24 to 48 h. The movies were acquired at 2×, 4×, 10×, and 20× magnifications (10 movies per magnification). For validation, 5 image frames per movie were stratified sampled to create a benchmark data set of 200 images. The samples were selected systematically at the frame in the second time point, at the 25th percentile time point, 50th percentile (middle) time point, 75th percentile time point, and the second to last frame.
Cell count benchmark images
A subset of cell proliferation benchmark images where individual cells are distinguishable was used for the cell count benchmark data set. We found that individual cells could not be reliably identified by eye in the PC12 and INS1 movies even after careful image examination, so we removed these from the benchmark data set as no truth (discussed below) could be reliably created. Then, 10× images from the 25th percentile time point were chosen (40 images), and the resulting benchmark data set includes 31 images at 10× magnification.
Wound-healing benchmark images
Six phase contrast movies showing wound closure (cells migrating into a scratch in the monolayer culture) of 3 different cell types (MDCK, keratinocytes, and fibroblasts) were acquired on the BioStation IM and CT at varying sampling rates and length. Five frames per movie were stratified and sampled as described above to create a benchmark data set of 30 images.
Cell motility benchmark images
Thirty-nine phase contrast movies of 7 cell types (HeLa, NIH3T3, CHO-K1, Cos-7, HEK293, PC12, INS1) were acquired on the BioStation IM. Images were acquired once per minute. Sequences from the beginning of the movie (minimum 100 frames) where cells were relatively isolated were used for tracking validation.
Truth creation strategy
Standard recipe performance is validated through comparison with truth. Typically, performance is validated through comparison with manually created truth. 15,16 We used this approach for cell counting and cell motility validation. For cell proliferation and wound-healing studies, we created optimal results by developing a custom recipe for each test movie and used this as the truth.
Individual cells were manually counted to provide truth for benchmark image sets. One hundred percent sampling of the cells in the image was done for cell counting. True cell counts were calculated for each data set. For cell motility, true cell tracks—linked (x, y, t) vertices for cells in the movies—were created manually. Cells that did not divide or leave the field of view were chosen (100 cells in total). The truth was reviewed and any discrepancies resolved.
Automated quantification
All of the standard recipes perform image background detection followed by mask refinement. A segmentation recipe for image background detection is taught by drawing. To facilitate more robust analysis, multiple pattern channels enhancing image content were created, and background detection was taught using a combined image that encodes the pattern information along with the original image. A core set of pattern channel–based background segmentation recipes is used for all the applications, followed by application-specific refinements as described below. The cell-counting recipe uses a teachable machine learning technology for mask partition, also described below.
Pattern channels
CL-Quant provides pattern channel functions that can be taught interactively to generate enhanced images isolating certain types of image patterns such as bright, dark, and texture. In CL-Quant, operators add pattern channels for use in combined channel segmentation teaching (
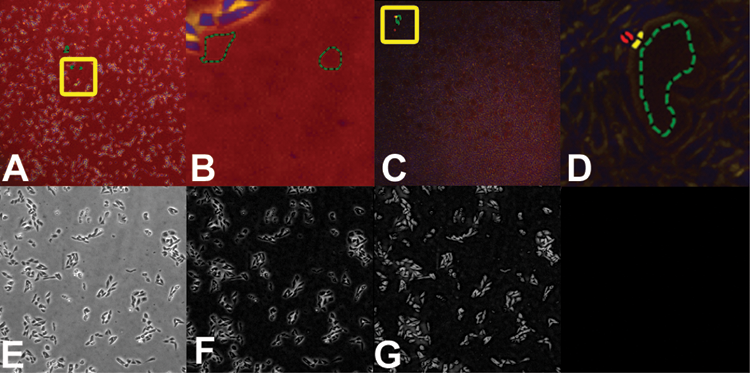
Segmentation teaching for 2× and 4× magnifications. (
Segmentation teaching
Users can flexibly teach segmentation recipes using a teach-by-example interface and CL-Quant’s machine learning technology for image segmentation.
17
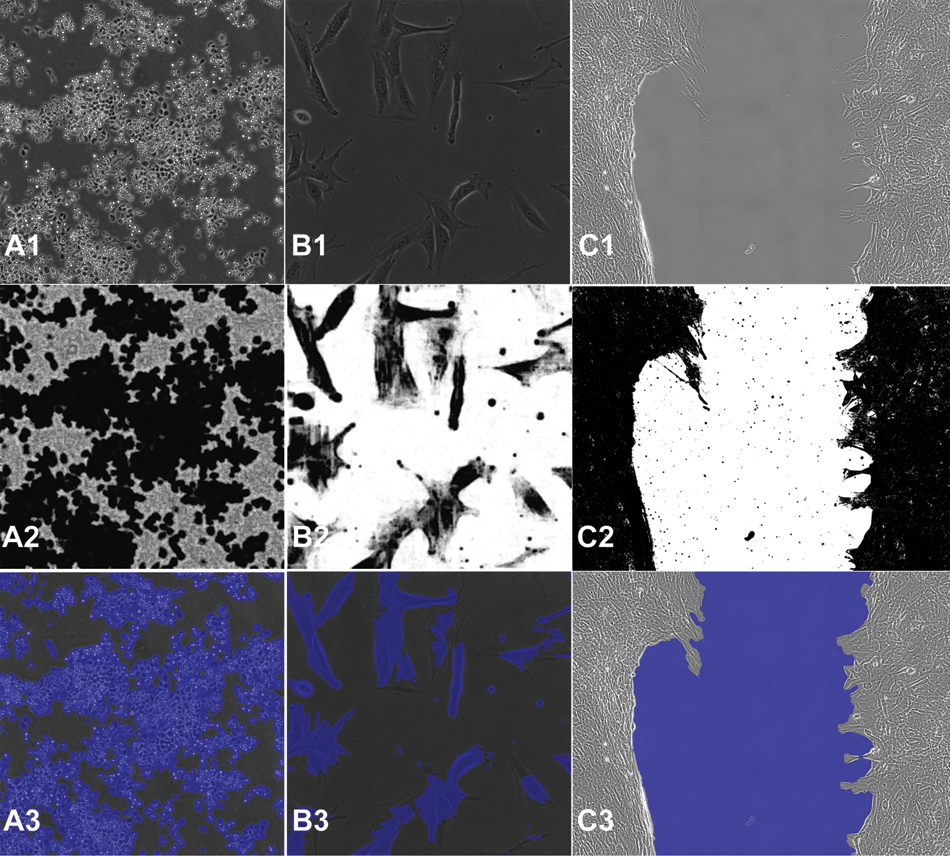
Original and confidence images, as well as segmentation masks for the cell proliferation and wound-healing standard recipes. By column: (
CL-Quant makes it possible to transform an input image to an enhanced image that can be easily segmented using a drawing interface, replacing traditional methods of image processing (i.e., programming or applying image-processing functions). This is the most challenging step in image analysis. It can be taught using multiple images and is updateable at a later time with additional images. It creates a model that is encoded into a segmentation recipe that can be automatically applied to transform and segment new images.
Partition teaching
Cell region partitioning is the process of identifying individual cells in segmented regions. Cell region partition is an extremely difficult problem in computing because there are too many variables and uncertain factors for a simple algorithm. In CL-Quant, users can flexibly teach a partition recipe using a drawing interface and a teachable region boundary enhancement technology.
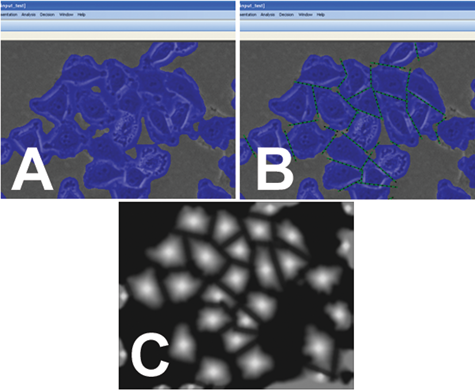
Illustration of cell partition teaching. (
The machine learning engine finds the optimal relationship between the membership image and the feature images that are derived from multiple filtering of the original image in a multiresolution manner, resulting in the recipe that is the set of the best-fitting coefficients. Then the recipe can be applied to another (similar) image for cell partitioning. If the cutting result is not satisfactory, the user can perform additional teaching in an error correction mode. The created recipe can be applied to new images where features are combined into the membership images using the fitting coefficients (recipe), and cell partitioning is performed based on multiple thresholding levels applied to the membership image.
Cell proliferation recipe
Two standard recipes were created: one for 2× and 4× magni- fications and one for 10× and 20×. Both recipes generate pattern channels and were taught on the combined pseudo-color images where the original and pattern channels are mapped to R,G,B (see
The cell proliferation recipe can be applied to any phase contrast movie to quantitatively measure the rate of cell growth in terms of cell area and confluency (ratio of the cell region area to the image area).
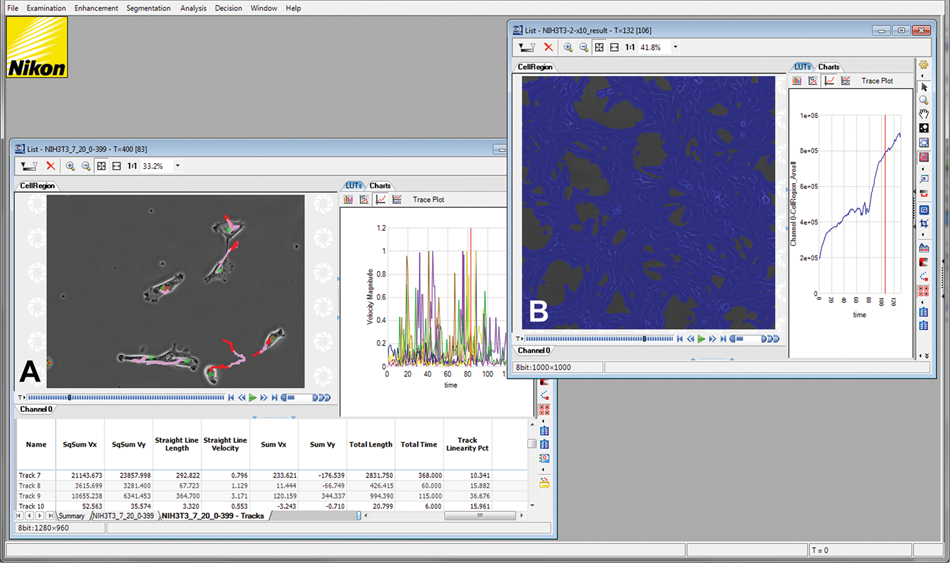
CL-Quant screenshot showing processing results for the (
Cell counting recipe (10×)
The cell-counting recipe uses the same 10×/20× segmentation recipe as the cell proliferation recipe above. Cell partition teaching was done initially using an image from the Cos-7 cell line and updated with an image of the HeLa cell type. The cell partition recipe divides a cell region mask into a number of individual regions corresponding to individual cells (Suppl. Fig. S1); cell counts and individual cell morphology and intensity measures are calculated.
Wound-healing recipe
The wound-healing standard recipe uses the same 2×/4× segmentation recipe as the cell proliferation recipe above, but its threshold settings are adjusted to segment the “wound” or substrate area rather than the cell regions. The detection mask is refined by filling holes and removing small detection regions. Because the application is intended to measure the shrinkage of the wound, the wound is restricted to be less than its original size by conditioning later frames with earlier frames, thereby ensuring background regions that may appear outside the wound area are ignored. The wound area is measured.
Cell motility recipe
The cell motility standard recipe uses the same 10×/20× segmentation recipe as the cell proliferation standard recipe. After mask refinement, CL-Quant’s motility tracking recipe is applied. The tracking module can be simply configured using common parameters (max velocity, size, etc.) and performs mask-based tracking. It will maintain cell separation over time when cells come together. One advantage of using masks for tracking is that detailed morphological characterization can be done over time, which can be a sensitive metric for comparing different experimental conditions. 18
The motility recipe can be used to extract a wide array of single-cell tracking metrics, including single-cell descriptors of movement (i.e., displacement, velocity acceleration, etc.), morphology (i.e., compactness, length-width ratio, etc.), and intensity (i.e., mean, total, standard deviation of intensity in the cell). Moving averages of these measures can be calculated. In addition, measurements and model parameters that describe the entire track (i.e., total length, diffusion constant, persistent, etc.) are provided.
Test metrics: cell proliferation and wound healing
Standard recipe result masks and truth masks are compared using the following test metrics for sample frame t:
CPoint (t): total truth mask area normalized by the image size averaged over all benchmark images
εp(t): oversegmentation area averaged over all benchmark images evaluated relative to truth mask
εm(t): undersegmentation area averaged over all benchmark images evaluated relative to truth mask
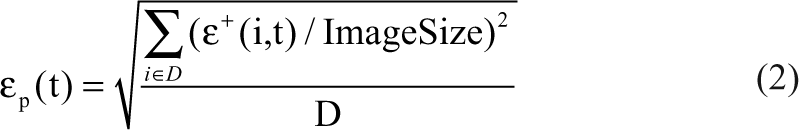
cP+ (t): expresses oversegmentation as the positive error bar extending from the truth mask mean = CPoint (t) + εp(t)
cP− (t): expresses undersegmentation as the negative error bar extending from the truth mask mean = CPoint (t) – εm(t)
Because the exact cell border is difficult to recognize and ±1 pixel detection discrepancy around the lengthy cell region border can accumulate to large error, we therefore excluded a 4-pixel region around the truth mask when calculating under- and oversegmentation metrics.
The test metrics are defined as follows:
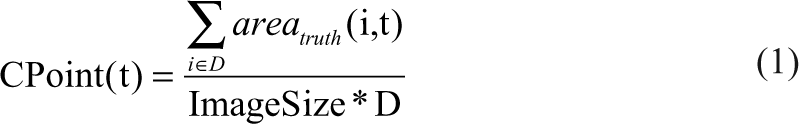
where
D = number of data sets
ImageSize = image area (must all be the same)
i = data set index
t = sample or time index
areatruth (i, t) = area of truth mask at time point t and data set i
ε+ (i, t) = area of oversegmentation of detection mask at time sample t, data set i. Physical meaning = area of (Detectionmask − Truthmask)
ε- (i, t) = area of undersegmentation of detection mask at time sample t, data set i. Physical meaning = area of (Truthmask − Detectionmask)
Test metrics: cell count
Standard recipe cell counts are compared with manual cell counts for each image. The absolute value of the difference between the two is divided by the manual counts to obtain the percent error of the standard recipe on that image. The mean error over all images is reported.
Test metrics: cell motility
Standard recipe tracks and manual tracks are compared using the following metrics:
Average object tracking error: number of incorrect tracking time points over the entire track divided by the total number of time points in the track
Average matching tracking sensitivity: for each truth track, the number of objects in the detected track that has ≥10% overlay with the truth track, divided by all objects in the truth track
Results
Cell proliferation and wound-healing results
The 3 standard recipes for cell proliferation (2 recipes) and wound healing (1 recipe) prove to be robust and accurate across a large range of cell lines and movies acquired by different operators at different times (
Cell proliferation validation data are shown for the (
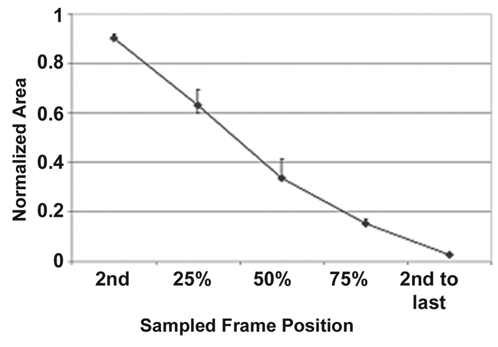
Wound-healing recipe validation data. The curves show the segmentation accuracy at the sampled time points (n = 6 images at each time point covering 3 cell lines). The upper error bar, the cP+ (t) value, indicates the amount of oversegmentation as compared with the truth, and the lower error bar, the cP− (t) value, indicates the amount of undersegmentation relative to the truth. The actual data are shown in Supplemental Table 3.
Cell counting and motility
The cell-counting and motility standard recipes are likewise robust and accurate across several cell types and a sizable set of validation images and movies (
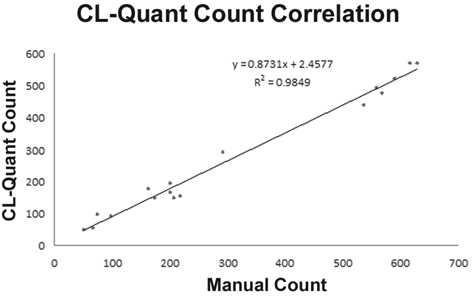
Cell count results. Manual and machine scoring of cell counts show close correlation (r 2 = 0.9849). The mean error over all images is 11.9%, which is within the range you would expect to see between human counters. Forty images covering 5 cell lines were used in the study.
Discussion
Screening systems require walk-away automation, and therefore validation of the automated image analysis is necessary. Standard recipes are meant to be used off-the-shelf without modification by end users, and therefore they must be robust for a given application over a variety of cell lines and operators.
Here we have compared the performance of 2 cell proliferation standard recipes, one for 2× and 4× magnifications and one for 10× and 20× magnifications, with that of multiple recipes developed for each cell type and magnification combination. Similarly, a single wound-healing standard recipe is compared with multiple custom wound-healing recipes. The results show that the standard recipe performance is very close in accuracy to the custom recipes at all time points as the cells undergo proliferation and migration. Generally, the standard recipes tend to slightly oversegment relative to the custom recipe, and this is a necessary accuracy trade-off to achieve robustness across the many cell lines and conditions. However, the degree of oversegmentation is stable at the different confluency levels, and therefore the standard recipes are equally sensitive to detected changes in migration or proliferation as the custom recipes.
In this study, we have also compared cell-counting and cell motility standard recipe performance with manual truth. The goal is to show good correlation with manual truth, even though manual analysis is also not perfect. The results show good correlation and accuracy as compared with truth for the cell-counting and cell motility recipes.
Teachable analytics
Teachable analytics address a critical issue in the high-content analysis (HCA) industry—how to develop novel analyses that are robust and scalable with less cost and risk. For end users, teachability allows the configuration of accurate analyses for their specific research. Indeed, in some cases, it could provide a software tool that can be tailored to address novel applications that were not even conceived of at the time the software was sold. For industry, it provides a way to create a lineup of application analyses without needing a team of costly image analysis and pattern recognition specialists.
CL-Quant’s learning technologies provide nearly instant results in the teaching mode; recipes can literally be developed in minutes. However, it can take more time to review the recipe performance on multiple images and then update the recipe with additional teaching in an error correction mode. The recipes validated in this study were taught by our junior technical staff, and we estimate that the process of recipe creation, performance review, and teaching update took less than 40 working hours each.
Much of the discussion of supervised machine learning technologies for use in HCA has centered on its use for phenotyping 19-21 after the images have been segmented using traditional image analysis methods. In addition to phenotyping, CL-Quant can be taught for image segmentation, which is arguably the most fundamental step in HCA. CL-Quant provides teachable interfaces to supervised machine learning technologies providing segmentation, object partition, and object phenotyping (classification) capabilities. As compared with nonsupervised learning methodologies, teaching in CL-Quant is much faster, providing instant feedback of the teaching results, and only the desired data are generated. For example, if you want to segment punctate cells, only cells that have a punctate appearance will be detected. In contrast, unsupervised learning approaches will detect and cluster all foreground patterns (i.e., punctate and flat cells) in the image. These would then need to be filtered using a gating or phenotype classification step, which increases processing and teaching time.
Conclusion
CL-Quant’s machine learning technologies are unique in the field. CL-Quant’s flexible segmentation learning technologies enable fundamental image analytics for broad applications to be quickly developed with less time and cost. In this study, we prove that these teachable analytics can be used to provide robust and accurate off-the-shelf performance for target applications. We are leveraging this strength of CL-Quant to quickly develop and validate a suite of new application recipes.
Footnotes
Acknowledgements
This research was supported in part by grant number 6R44MH075498 from the National Institute of Mental Health.