
Abstract
Autophagy is believed to be an important process during tumorgenesis, and in recent years it has been shown to be modulated in response to a number of conventional anticancer agents. Furthermore, the development of targeted small molecule inhibitors, such as those to the PI3K-AKT-mTOR pathway, has presented a molecular link between the disruption of this signalling cascade and the process of autophagy. The cellular consequence of stimulating or inhibiting autophagy in cancer cells is not completely understood, so it is important that this process be monitored, along with antiproliferative and apoptotic biomarkers, in the preclinical setting. The field of autophagy is still evolving, and there is a constantly changing set of criteria for the assessment of the process in cells, tissues, and organs. The gold standard technique for analyzing autophagy in mammalian cells remains transmission electron microscopy, which has many limitations and is often difficult to perform on in vivo tissue including human tumor xenografts. In order to monitor autophagy in human tumor xenogaft tissue, we have taken the approach to develop an immunohistochemical (IHC) method for the detection of the autophagosome-associated protein, microtubule-associated protein 1 light chain 3 (LC3), in human tumor xenografts. After synthesis, LC3 is cleaved to form LC3-I, and upon induction of autophagy, LC3-I is conjugated to the lipid phosphatidylethanolamine to form LC3-II, which is tightly bound to the membrane of the autophagosome. It is thought that detection of endogenous LC3-II by IHC could be difficult because of the relatively low level of expression of the protein. Here we present the validation of an IHC method to detect LC3 in human tumor xenografts that we believe is able to distinguish LC3-I from LC3-II. It is hoped that this assay can become a useful tool for the detection of autophagy in preclinical xenograft models and determine the effects of anticancer therapies on the autophagic process.
Introduction
Autophagy (Greek for “self-eating”) is a dynamic intracellular recycling process in which membrane structures sequest and degrade long-lived proteins and organelles. The process of autophagy can be induced in response to pathogen infection, nutrient or environmental stresses. The process begins with the development of a double membrane structure inside an intact cell. The exact origins of this structure are much debated, but it is thought to arise from a ribosome-free region of the rough endoplasmic reticulum (Dunn 1990; Yokota et al. 1993) or a pre-existing structure called the phagophore (Stromhaug et al. 1998). The double membrane enwraps a portion of the intracellular cytoplasm and forms a structure called the autophagosome. The autophagosome then fuses with an endosome to form the amphisome, and finally, this structure fuses with a lysosome to form an autolysosome. Upon formation of the autolysosome, the inner membrane of the autophagosome breaks down and the contents are degraded by acid hydrolases, which results in recycling of the macromolecules. The molecular control of this process in yeast has been shown to be caused by a number of complexes involving autophagy-related gene (Atg) proteins (Yang and Klionsky 2010). The subsequent identification of a number of homologs of Atg proteins in mammalian cells has enabled the identification of the uncoordinated like kinase (ULK) complex required for the initiation of autophagy, class III PtdIns3K complexes required for autophagosome formation, and the LC3-II and Atg12–Atg5–Atg16L complex thought to be required for elongation and expansion of the phagophore membrane (Yang and Klionsky 2010).
Over the past ten years, research in the field of autophagy has grown immensely. The role of the autophagic process and its contribution to a number of diseases including cancer, neurodegenerative disorders, and inflammatory bowel disease have become a major focus of research (Larsen and Sulzer 2002; Levine and Kroemer 2008; Mizushima et al. 2008). However, it remains unclear whether autophagy protects against or contributes to the pathogenesis of these diseases. The induction of autophagy by a number of widely used oncology treatments, including temozolomide, tamoxifen, and γ-irradiation (Bursch et al. 1996; Kanzawa et al. 2004; Paglin et al. 2001), and more recently, novel targeted agents, (especially those of the PI3K/AKT/mTOR pathway), has raised questions as to the role of autophagy in cancer cell physiology. When the PI3K pathway is activated, mTOR suppresses autophagy by phosphorylating Atg13 (Maiuri et al. 2007). Indeed, inhibiting the mTOR pathway in mammalian cancer cell lines has demonstrated an enhancement of autophagy, which has been associated with antitumorigenic effects (Chresta et al. 2010; Takeuchi et al. 2005). Despite the role autophagy is thought to play in the cytotoxic response to these agents, it is still unclear whether autophagy consistently results in suppression of tumorigenesis or whether it provides cancer cells with a survival mechanism to escape harsh environments (Kondo et al. 2005).
As interest in the regulation of autophagy and its role in a number of disease areas increases, researchers are faced with a perplexing challenge. The existence of a number of straightforward assays to assess autophagy in yeast has not been reciprocated in other model systems, and there is great debate over the acceptable methods to use to assess autophagy in higher eukaryotes (Klionsky et al. 2008). The complexities and controversies surrounding autophagy analysis are currently the subject of a number of recent reviews from the field and will not be addressed in depth here (Klionsky et al. 2008; Mizushima et al. 2010). However, it is obvious that to assess autophagy in response to novel and/or existing pharmaceuticals, in preclinical and clinical material, we must start to investigate the methodology to detect this process.
In this article, we have taken the approach of using immunohistochemistry (IHC) to develop a method of detecting the autophagosome-related protein, microtubule-associated protein 1 light chain 3 (LC3), a mammalian homologue of the yeast protein Atg 8, in human tumor xenografts. Microtubule-associated protein 1 light chain 3 is synthesized in its pro-form, and the last twenty-two amino acids at the C-terminal are cleaved to form LC3-I. Upon induction of autophagy LC3-I is conjugated to phosphatidylethanolamine to form LC3-II which is tightly bound to the membrane of the autophagosome. Microtubule-associated protein 1 light chain 3-II is a marker of autophagosomes, and its punctate staining has been used quantitatively for this purpose in vitro. Therefore, accumulation of LC3-II suggests either that the process of autophagy has been stimulated and/or that the maturation of autophagosomes has been blocked (such as by the addition of chloroquine [CQ]). When autophagy reaches the degradation phase of the process, LC3-II is converted back to LC3-I through protease cleavage (Kabeya et al. 2000; Mizushima et al. 2010).
Here we demonstrate the development of an IHC method that we believe, in human tumor xenograft tissue, is able to distinguish between the diffusely stained LC3-I and the distinct puncta, which have been reported to be associated with LC3-II (Kabeya et al. 2000). Furthermore, we present a validation of the assay in vitro, comparing it to established immunofluorescent and immunoblotting assays (Chresta et al. 2010).
Materials and Method
Cell Culture
Human U87MG (glioma), HCT116 (colorectal), PC3 (prostate), BT474c and MCF-7 (breast), and H838 (non-small cell lung cancer; NSCLC) were obtained from the American Tissue Type Culture Collection (http://www.ATCC.org) and cultured as follows: U87MG in Eagle’s Minimum Essential Medium (supplemented with 1% glutamine, nonessential amino acids, sodium pyruvate, and 10% fetal calf serum [FCS]), HCT116 in McCoys (supplemented with 1% glutamine and 10% FCS), PC3 in Iscove’s Modified Dulbecco’s Medium (supplemented with 1% glutamine and 10% FCS), BT474 in Dulbecco’s Modified Eagle’s Medium (DMEM, supplemented with 1% glutamine, 1% oxaloacetate, 10% mineral supplement and 10% FCS), MCF-7 in DMEM (supplemented with 1% glutamine and 10% FCS), and H838 cells in Roswell Park Memorial Institute (RPMI)-1640 media supplemented with 10% FCS, respectively. All media and supplements were purchased from Invitrogen (Paisley, UK).
In Vivo Studies
Female nude (nu/nu:Alpk; AstraZeneca) mice were housed in negative pressure isolators (PFI Systems Ltd., Milton Keynes, UK). Experiments were conducted as previously described in full accordance with the United Kingdom Home Office Animal (Scientific Procedures) Act 1986 (Chresta et al. 2010). Human tumor xenografts were established by subcutaneous (s.c.) injection of 1 × 10⁶ or 5 × 10⁶ tumor cells per mouse. When tumors reached a defined size (0.4 cm3), selected mice were humanely killed. Tumors were excised, cut into 2- to 3-mm slices, and fixed in 10% formalin buffer for twenty-four hours before embeding in paraffin wax for immunohistochemical (IHC) staining.
In Vitro Studies
To increase the number of autophagosomes, H838 cells were treated with CQ (Sigma-Aldrich Inc., Dorset, UK) to a final concentration of 50 µM. Control cells were given an equivalent volume of distilled water (d.H2O; control). Twenty-four hours later, cells were harvested using standard techniques and pellets were prepared for IHC and immunoblotting as described below.
Immunohistochemistry
U87MG tumor xenograft sections (5 µm thick) were dewaxed and rehydrated as described previously (Randall and Foster 2007). The following antigen retrieval techniques were then applied: no pretreatment, incubation for ten minutes with Proteinase K (Dako UK Ltd., Cambridgeshire, UK), or two minutes of microwave treatment at 110°C in either citrate (pH 6.0) or EDTA (pH 8.0) buffer. In all cases, the endogenous peroxidase activity was blocked with 3% H2O2. Nonspecific protein binding was blocked by normal goat serum (NGS) diluted 1:20 in 0.05% tris buffered saline + 0.05% Tween-20 or Rodent Block-M (RBM; Biocare Medical, Concord, CA, USA). The primary biotinylated monoclonal mouse anti-LC3 antibody (nonoTools, Teningen, Germany) was applied in dilutions ranging from 1:25 to 1:1,000 (Table 1 ) and incubated for one hour. Subsequently, mouse-labeled polymer (Dako) was applied for thirty minutes, followed by ten minutes incubation with diaminobenzidine tetrahydrochloride solution diluted to 0.05% in imidazole-HCl buffer, pH 7.5. The slides were counterstained for one minute using Carazzi’s hematoxylin (Clin-Tech, Guildford, UK). Mouse immunoglobulin gamma (Dako), diluted to the same concentration as the specific primary antibody was used as a negative control. Stained sections were dehydrated and mounted under glass coverslips with Histomount (RA Lamb, Eastbourne UK).
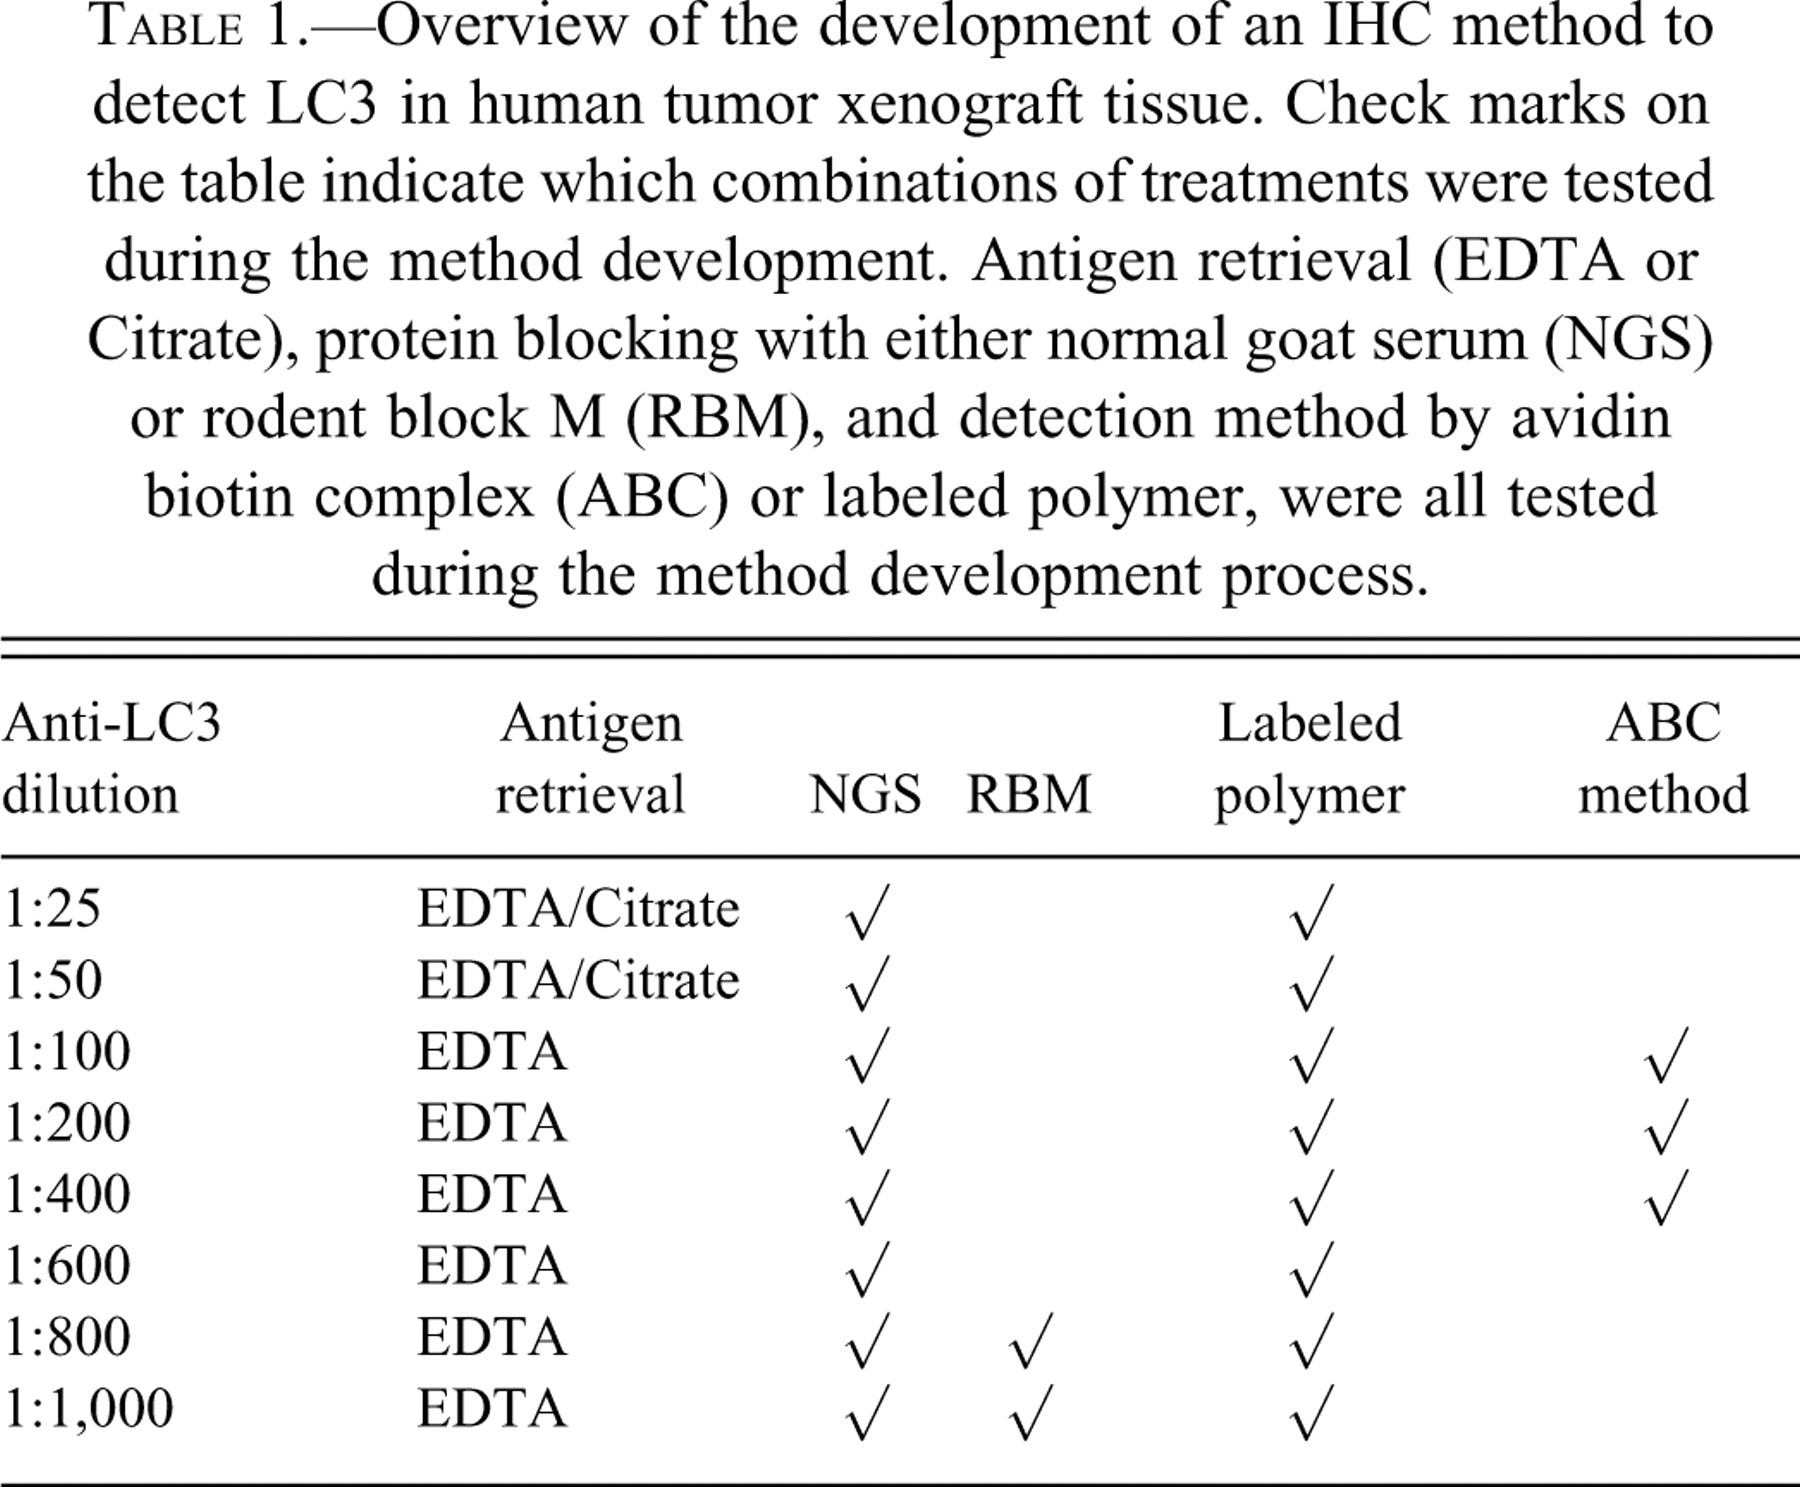
Overview of the development of an IHC method to detect LC3 in human tumor xenograft tissue. Check marks on the table indicate which combinations of treatments were tested during the method development. Antigen retrieval (EDTA or Citrate), protein blocking with either normal goat serum (NGS) or rodent block M (RBM), and detection method by avidin biotin complex (ABC) or labeled polymer, were all tested during the method development process.
Alternatively, following antigen retrieval and H2O2 treatment, nonspecific protein binding was blocked with serum-free protein block (Dako) and anti-LC3 antibody was applied 1:100, 1:200, and 1:400 in blocking solution. The signal was then detected by an avidin-biotin complex (ABC) method with the Vectastain Elite ABC kit (Vector Laboratories, Inc., Burlingame, USA) and incubated for ten minutes with diaminobenzidine tetrahydrochloride solution. All sections were counterstained, dehydrated, cleared, and mounted as described above. Table 1 provides an overview of the development of the staining method.
For the IHC staining of the H838 cultured cells, a cell suspension in phosphate-buffered saline (PBS) buffer was adjusted to a concentration of one million cells per milliliter. Cells were centrifuged onto Super Frost Plus slides using a Shandon Cytospin 3 (Thermo Scientific, Runcorn, UK). The Cytospin cell preparations were fixed with 99.9% methanol (Fisher Scientific Ltd., UK) for ten minutes, after which they were air-dried for thirty minutes and stained for the presence of LC3-II using the IHC method described above using the labeled polymer detection system.
Immunofluorescence
H838 cells were cultured on glass coverslips and treated as described above. Cells were fixed with 4% paraformaldehyde for twenty minutes at room temperature. Following two washes in PBS, ice-cold methanol was added and the cells were permeabilized at −20°C for ten minutes. Coverslips were washed in PBS and blocked in 5% NGS, 0.1% Triton in PBS and incubated for one hour at room temperature. The primary anti-LC3 antibody (nonoTools), diluted 1:50 in blocking solution, was added and the cells were incubated overnight at 4°C. After three washes in PBS, a goat anti-mouse secondary antibody, Alexa Fluor (Invitrogen, Eugene, Oregon, USA) diluted 1:400 in PBS with the addition of Hoechst (1:4,000), was added to coverslips and incubated for two hours at room temperature. Coverslips were washed four times with PBS and mounted on SuperFrost Plus slides with Vectashield H-1000 mounting medium (Vector Laboratories Inc.). Cells were imaged on an Axio Imager A1 microscope (Carl Zeiss, Oberkochen, Germany) fitted with an AxioCam HRc5 lens and processed in Adobe Photoshop.
Immunoblotting
Protein lysates were prepared from frozen tumors using the FastPrep-24 (MP Biomedicals, UK) in 10× lysis buffer (#9803; Cell Signaling, Danvers, MA, USA) containing phosphatase inhibitor cocktail I and II (P2850 and P5726; Sigma-Aldrich) and protease inhibitor cocktail (P8340; Sigma-Aldrich). Protein concentration was determined by bicinchoninic acid assay (Pierce, Rockford, IL, USA). Tissue culture cell lines were lysed in the same buffer as above and incubated for thirty minutes on ice. Twenty micrograms of protein per sample were resolved on 12% Bis-Tris sodium dodecyl sulfate polyacrylamide gel electrophoresis gels (Invitrogen), transferred to polyvinylidine fluoride membranes (Millipore, Watford, UK), and incubated with the LC3 antibody described above at a dilution of 1:1,000 (nonoTools, Teningen, Germany) or glyceraldehyde-3-phosphate dehydrogenase (1:2,000; Abcam, Cambridge, UK) and subsequently stained with horseradish peroxidase-conjugated anti-rabbit or anti-mouse immunoglobulin gamma (1:2,000; Cell Signaling). Immunoreactive proteins were detected by enhanced chemiluminescence (Pierce), and bands were detected and quantitated on a Chemigenius (Syngene, Cambridge, UK) .
Results
Selection of an LC3 Antibody for IHC Development
To determine that the LC3 antibody selected would distinguish between LC3-I and LC3-II in the IHC method developed here, we first assessed this capability in vitro using immunofluorescence (IF) and immumoblotting (IB) techniques previously developed in our laboratory (Chresta et al. 2010). Control H838 cells treated with d.H2O showed that there was faint diffuse cytoplasmic staining with the LC3 antibody (Figure 1A ). In contrast, treatment of cells with CQ resulted in a distinct accumulation of LC3 puncta, suggesting an accumulation of LC3-II (Figure 1B). To confirm the accumulation of LC3-II, control and CQ samples were analyzed by IB and stained to detect LC3 (Figure 1C). Compared to control samples, CQ treatment induced an enriched distinct band of 16 kDa representing LC3-II. In the H838 control samples, a faint band of LC3-I was observed at 18 kDa, but this band was visible only if the IB was overexposed (data not shown). However, this finding was not readily observed in the CQ-treated samples, even when the IB was exposed for a longer period of time. Taken together, these data suggest that this LC3 antibody could distinguish between LC3-I and -II and thus would be of use in the development of an IHC method.
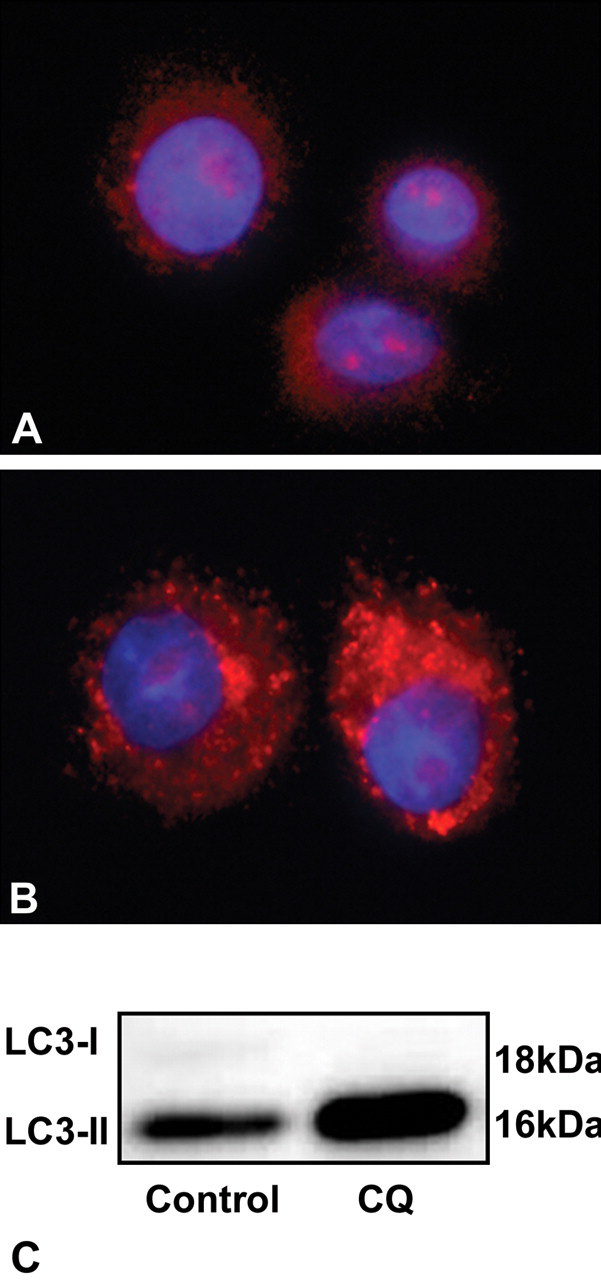
H838 cells treated in vitro with distilled water (A) or chloroquine (B) and stained to detect microtubule-associated protein 1 light chain 3 (LC3) by immunofluorescence. LC3 staining (red) and DNA (blue), images taken at 100× magnification and exported to Adobe Photoshop for processing. (C) Immunoblotting of H838 cells treated distilled water or chloroquine and blotted to detect LC3.
Detection of LC3 by Immunoblotting in Tumor Xenograft Models
Prior to the development of the IHC method, a panel of human tumor xenografts (breast, colorectal, glioma, and prostate) was screened by IB for expression of LC3. All models tested clearly expressed LC3, and a specific distinction could be made between the LC3-I and LC3-II bands (Figure 2 ). However, as with the H838 cells, in some of the xenograft models, LC3-I could be observed only when the blots were overexposed. We decided to select the U87MG human glioma xenograft model to use in our IHC method validation, as paraffin-embedded control tissue from this model was readily available to use for this purpose and strong LC3 staining was observed in these cells by IB.
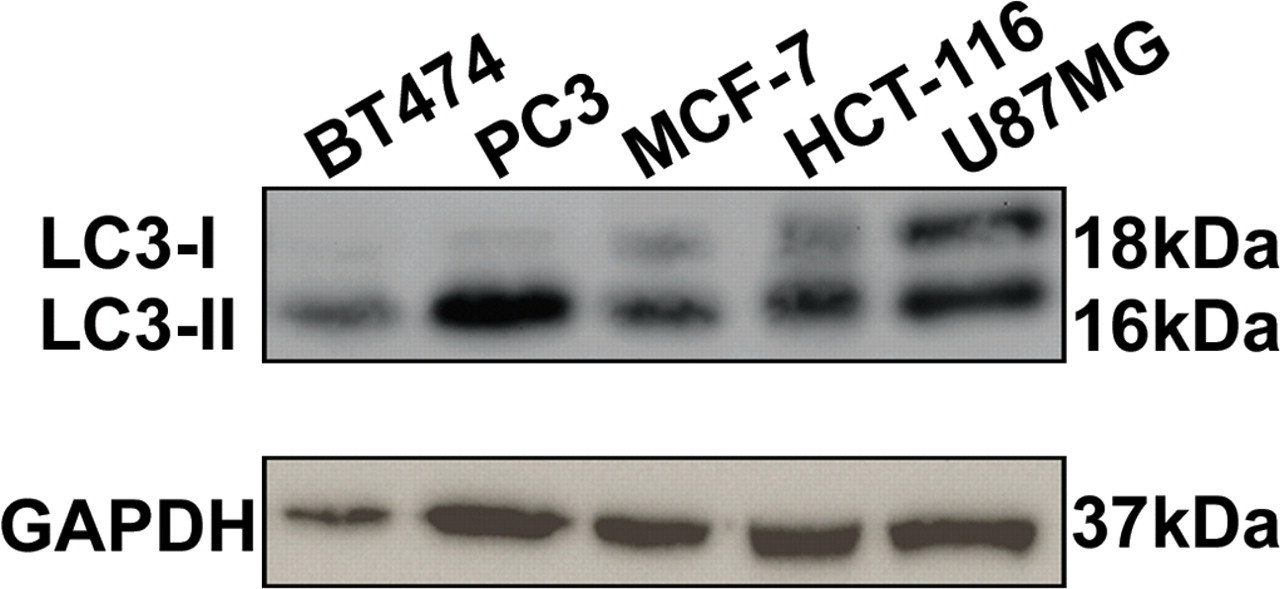
A panel of human tumor xenografts was assessed for expression of LC3 by immunoblotting, including models of breast (BT474 & MCF-7), prostate (PC3), colorectal (HCT116), and glioma (U87MG) cancer.
Development of an IHC Method to Detect LC3 in Tumor Xenograft Tissue
To detect LC3 and subsequently distinguish between the diffuse localization of LC3-I and the punctate appearance of LC3-II in U87MG human glioma tumor xenograft tissue, several methods were evaluated. First, the requirement for antigen retrieval was assessed in the presence of a high concentration of the LC3 antibody (1:25). Treatment with proteinase K did not reveal any antibody staining. However, the use of citrate or EDTA recovered the antigenic sites. Treatment with EDTA was selected as the method with which to proceed, as it appeared to recover a greater number of antigenic sites in human tumor xenograft tissue.
The use of either the ABC or an anti-mouse labeled polymer technique as suitable detection systems was investigated. The ABC technique appeared to have very little sensitivity, even at the highest antibody concentration tested (1:100). In comparison, the use of the labeled polymer system gave distinct punctate staining at all antibody concentrations tested (Table 1). Although there was high background staining with the labeled polymer, the punctate localization of LC3-II was clearly distinguishable (Figure 3 ).
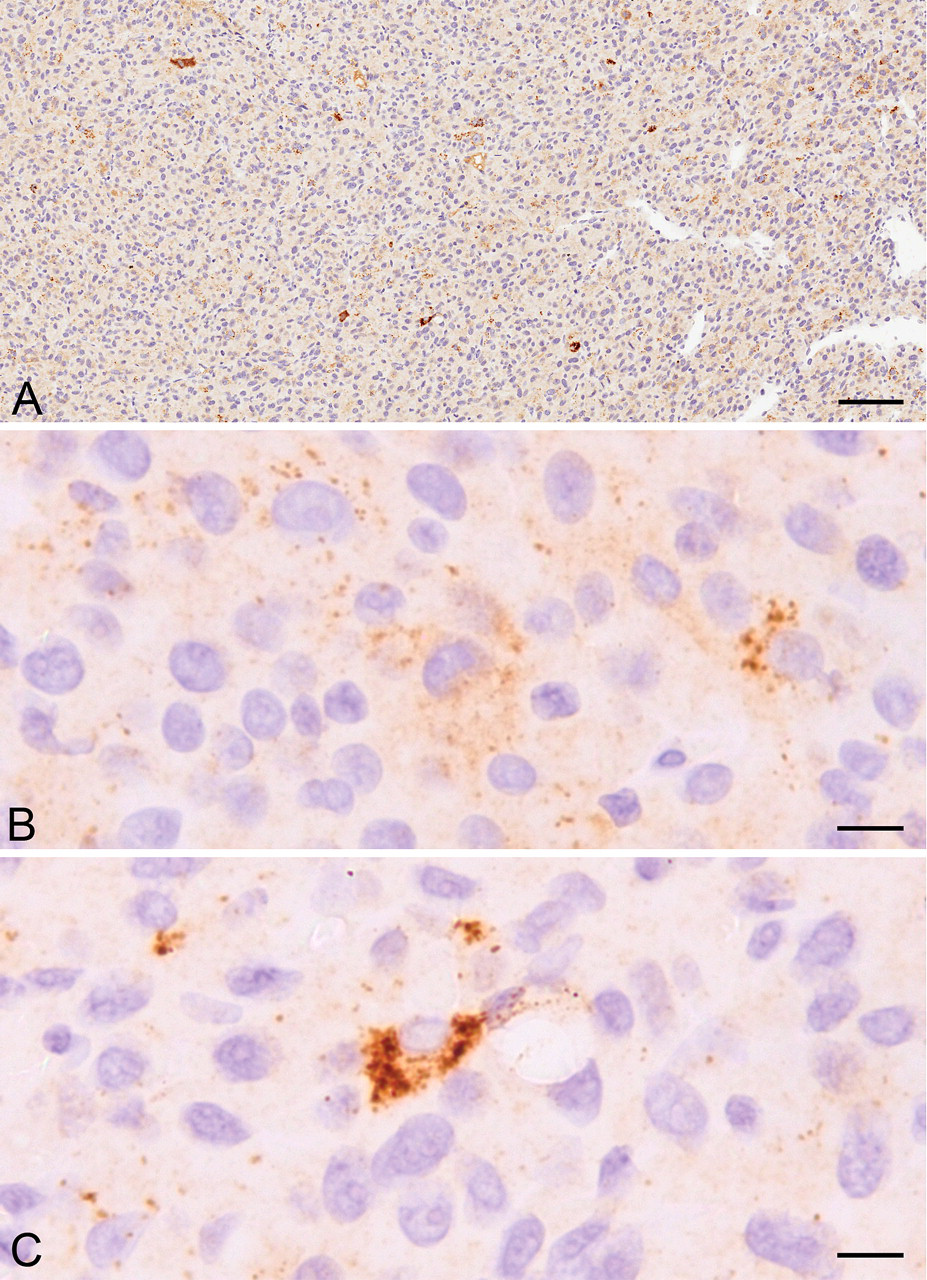
U87MG human glioma tumor xenograft tissue stained to detect LC3. (A) Cross-section view of tissue. (B) Enlarged image showing the diffuse staining pattern typical of LC3-I. (C) Localized distinct puncta around the nucleus suggestive of LC3-II. The scale bars represent 100 µm in A and 10 µm in B and C.
The antibody concentrations used in the selection of the antigen retrieval and detection method resulted in distinct staining but with substantial background staining. The dilution of the LC3 antibody was therefore assessed. Dilutions of 1:400 and 1:600 still showed a high level of background, yet evidence of the punctate LC3 foci could still be distinguished. Dilutions of 1:800 and 1:1,000 resulted in a decrease in background levels and demonstrated the punctate foci, thus enabling the observation of the more diffuse LC3-I, which was also present in these cells. The dilution of the antibody was therefore determined to be 1:1,000 from the stock antibody, and this dilution enabled the distinction of the LC3-II foci from the diffuse LC3-I in the xenograft tissue.
Despite the optimization of the antibody dilution, there was still some nonspecific staining observed in tissue sections. Therefore, it was decided to investigate the blocking agents used and to compare the standard NGS to RBM. The two blocking techniques were compared at the LC3 antibody dilutions of 1:800 and 1:1,000. Interestingly, RBM did improve the nonspecific background staining. However, the intensity of the punctate LC3-II staining was not as pronounced with RBM compared to sections treated with NGS.
It was therefore concluded that the optimal method to use to detect LC3 and the distinct LC3-II lipidated form was as follows: antigen retrieval with EDTA, samples blocked with NGS, dilution of the stock LC3 antibody to 1:1,000, and use of the anti-mouse labeled polymer. Figure 3 (A) highlights a section from a U87MG xenograft showing the diffuse localization associated with LC3-I (B) and the more distinct punctate foci associated with LC3-II (C).
Validation of the IHC Method to Detect LC3
To validate this observation, we used the method detailed above to stain paraffin-embedded H838 cells in vitro with and without CQ, as in Figure 1. In the CQ-treated samples, there was an increase in LC3 staining in the cells and in the number of cells that appeared to display distinct punctate staining typical of LC3-II, compared to the control treated group (Figure 4 ).
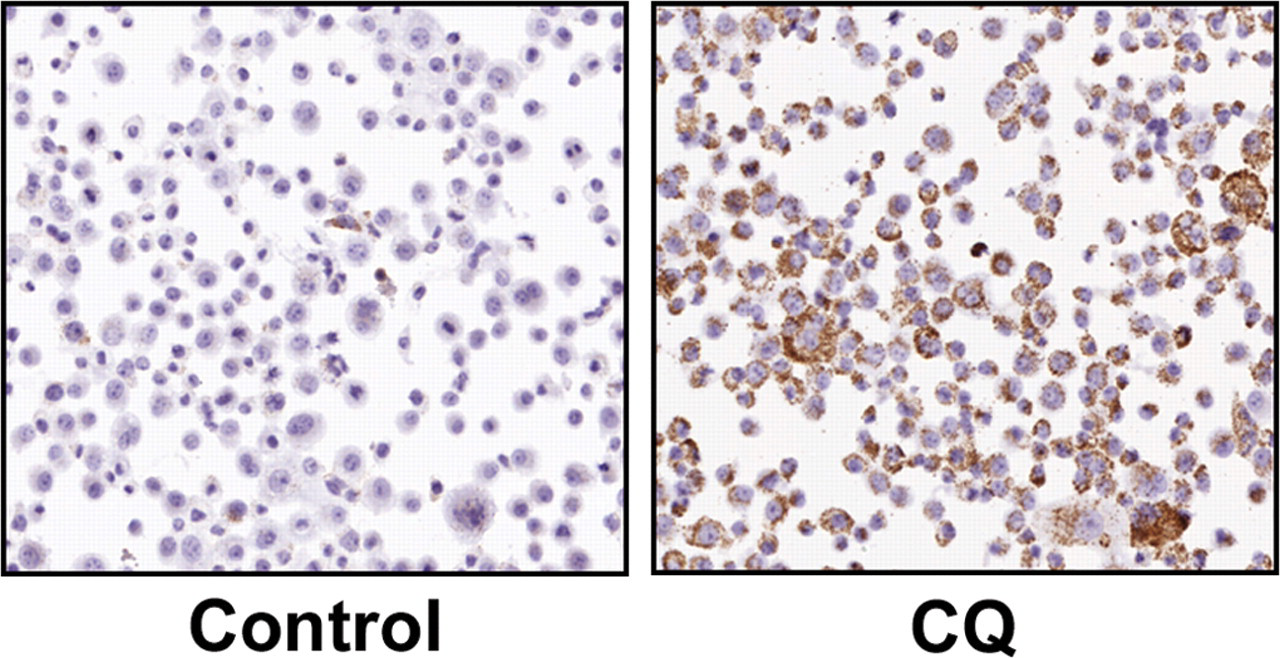
H838 cells treated in vitro with distilled water or chloroquine to detect LC3 by immunohistochemistry. Images taken at 20× magnification.
Discussion
The precise role of autophagy in a disease setting, and particularly in cancer, remains unclear. Research continues to try to establish whether induction of autophagy, following a variety of cellular stimuli, is a mechanism of cell survival or cell death with respect to cancer (Floto et al. 2007; Rubinsztein et al. 2007). However, given the complexities of this process, it is important that we have the relevant techniques and agents in place to assess autophagy in the drug discovery and development process.
Human tumor xenografts are a frequently used in vivo system in the development of candidate anticancer drugs (Peterson and Houghton 2004). In this report, we have described a method for the detection of the autophagy-associated protein LC3 in human tumor xenograft tissue. Specifically, in xenograft tissue sections we have detected LC3 staining, which we determine can be separated into cytosolic LC3-I and the distinct cytoplasmic punctate staining associated with the autophagy-specific autophagosome membrane–bound LC3-II. Very few studies have investigated IHC staining to detect LC3 in animal or human tissues. Those studies in which LC3 IHC has been reported appear to present contradictory views on the potential success of this approach. One such study has commented that the identification of autophagy-specific biomarkers for tissues is highly compromised because of a lack of differential gene expression (Martinet et al. 2006). This article does suggest that IHC analysis is possible for LC3, but only where the protein was overexpressed, for example in GFP-LC3 transgenic animals. In contrast, an investigation into the detection of LC3-II by IHC in primary human colon cancer specimens determined that the use of this technique and localization of LC3 was specifically in adenocarcinoma tissue and not the surrounding nontumorous mucosal epithelial cells (Sato et al. 2007). Results from that study did show the accumulation of LC3-II by immunoblotting and further demonstrated the increased expression of what could be described as autophagosomes by electron microscopy (EM), although these were difficult to identify in the image presented in this manuscript.
Prior to the present study, the standard method for monitoring autophagy in tissues, although not ideal, is repeatedly reported to be transmission electron microscopy (Mizushima 2004; Mizushima et al. 2010), which identifies the accumulation of cellular organelles with the morphology of autophagosomes. To validate our IHC methodology against the “gold standard,” we did undertake EM analysis as part of our in vitro studies in H838 cells. In these samples, we could readily detect, by EM, autophagosome structures in control cells and following CQ treatment. However, the images failed to highlight the increases in autophagosome number in response to CQ as expected compared to the IF and IB results. This observation clearly demonstrates one of the disadvantages of EM in that only small sample sections can be analyzed at any one time and focal increases in large cell-to-cell differences in the response to drug treatment may result in inconsistent observations compared to assays incorporating a whole tissue analysis. Given the high focal expression of LC3-II in the xenograft tumor tissue in the current experiment, we believe that performing a direct quantitative comparison between EM and the IHC method reported here requires a system in which diffuse increases in the number of autophagosomes and thus in LC3-II expressing structures occur. The aims of our ongoing studies are therefore to optimize this technique to generate quantitative EM for xenograft tissues that we can compare to tissue stained for LC3 using the IHC method developed here.
Measurements of autophagy are commonly broken down into two areas: monitoring the number of autophagosomes, and those measuring autophagic flux. The measurement of autophagosomes in cells does not necessarily translate to an increase in autophagic activity, but the measurement of the number of autophagosomes observed at any specific point is an indication of the balance between their generation and their conversion to autolysosomes. Therefore, the accumulation of autophagosomes may represent induction, or inhibition, of the autophagy process downstream of autophagosome production. To assess the dynamics of autophagic activity, a process called “autophagic flux” can be measured. This process aims to distinguish between basal autophagy levels, induction of autophagy, and the possible suppression of upstream and/or downstream steps in the autophagic pathway. In vivo, the measurement of autophagic flux is not a trivial pursuit, as it can be in vitro where methods are available to use inhibitors that block autophagy at key stages of the process (Mizushima et al. 2010). In addition, such techniques as the exogenous fluorescent tagging of key proteins such as LC3 are implemented to allow an analysis of the protein’s degradation, which has been reported to be a good indicator of autophagic flux (Mizushima et al. 2010). Currently, to assess autophagy from in vivo experiments, we must assess the accumulation of autophagosomes.
The development and validation of an IHC method to detect LC3, and to distinguish the autophagosome-associated LC3-II, will allow the assessment of autophagy in preclinical and potentially clinical tissues and the way in which drug intervention can interefere with the process. As our understanding and interpretation of the autophagic cascade in pathogenesis increases, the use of such IHC techniques will become mandatory for the high-throughput monitoring of autophagy in response to novel and existing pharmaceuticals.
Footnotes
Contributors were either employed by or receiving funding from AstraZeneca Pharmaceuticals to complete this work.