
Abstract
The field of high-content screening and analysis consists of a set of methodologies for automated discovery in cell biology and drug development using large amounts of image data. In most cases, imaging is carried out by automated microscopes, often assisted by automated liquid handling and cell culture. Image processing, computer vision, and machine learning are used to automatically process high-dimensional image data into meaningful cell biological results. The key is creating automated analysis pipelines typically consisting of 4 basic steps: (1) image processing (normalization, segmentation, tracing, tracking), (2) spatial transformation to bring images to a common reference frame (registration), (3) computation of image features, and (4) machine learning for modeling and interpretation of data. An overview of these image analysis tools is presented here, along with brief descriptions of a few applications.
Keywords
Introduction
T
For example, HCS has had a tremendous impact on neuroscience drug discovery, enabling researchers to examine large amounts of drug and neuronal cell interactions at different time intervals and at a spatial resolution. This permits levels of sensitivity and objectivity not previously possible with spectrophotometric experimentation. Automated image analysis methods such as tracing, which we discuss in this article, have proven to be advantageous over manual methods for studying phenotypic changes in neurite extensions in response to drugs. 6
Overview of the image analysis tools
This review focuses on the fundamental image analysis methods used in HCA. Figure 1 shows a general overview of the common steps in HCA pipelines. The reader is encouraged to frequently refer to this pipeline while reading this article. Images are typically first normalized by preprocessing and then processed by segmentation to identify single cell regions. Depending on the experiment, tracing or tracking may be required. Features are then extracted from each region of the segmented image and/or from the results of tracing or tracking. Each cell is thus represented by a multidimensional feature vector. In some cases, features may be calculated on the whole image field without segmentation. In either case, the features are then used for classification or clustering or both depending on the application.
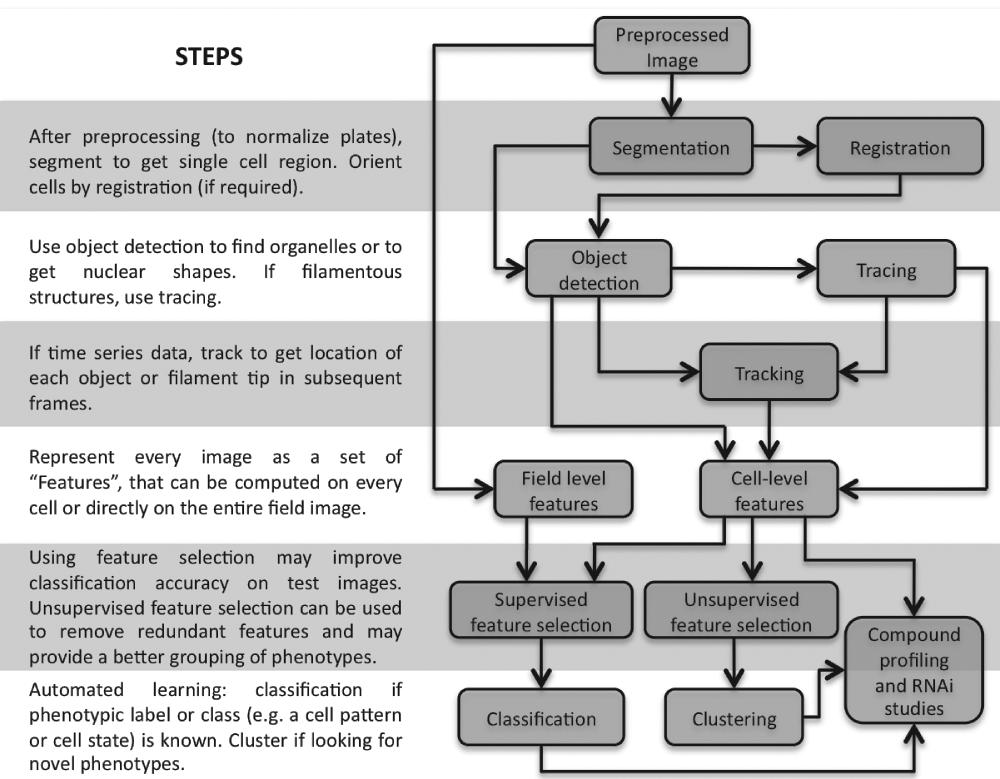
Steps in typical image analysis pipelines for high-content analysis (HCA).
Notes on Data Acquisition for HCA
When optimizing an HCA process, multiple options must be weighed for their costs and benefits. One must consider the type of microscopy (transmitted light, widefield fluorescence, or confocal fluorescence), the number of imaging channels, the objective magnification and camera pixel size, whether to acquire 2D or 3D images, whether to acquire a single time point or a time series, and so on. The answers to these options lie in the biology of the cell assay and the trade-offs between speed and quality of the image acquisition. The number of imaging channels can have an effect on the segmentation methods used (see segmentation section) and on the ability to use colocalization information. The objective magnification and camera pixel size should be determined based on whether the goal is to image small objects in cells or individual cells or populations of cells. The acquisition of 2D images can be more rapid than capturing 3D images while yielding less information.
One challenge of HCS is to determine how many images should be acquired. The amount of information required can vary greatly from task to task. In general, it is best to be able to accurately characterize the variability for a given cell type under a given condition. Hence the more data, the better. In a task where the desire is to assign a label to a protein location pattern (see supervised learning), images for 1 to 10 cells can be sufficient to place a protein into a known location class. However, it may require images for as many as 50 to 100 cells to adequately learn a new category. 7
Although current HCA applications typically involve acquiring images of a fixed size for a fixed number of fields at a fixed number of time points, it is also possible to vary these parameters during the acquisition process based on analysis of the images acquired previously. The interested reader is pointed to intelligent acquisition algorithms that vary when and where to acquire images. 8,9
Preprocessing
Images often exhibit variations due to uneven illumination across the image because of imperfections in the optical system or differences between different runs of the imaging pipeline. These effects are uninteresting but can lead to processing problems. For example, if the top of the image is more brightly lit, this could lead a naive algorithm to wrongly assign cells that happen to lie on that region of the image a higher marker expression value.
Pixel-level preprocessing can ameliorate some of these artifacts. For estimating the uneven illumination, one typically computes the mean (or median) pixel value at each location across a large number of fields followed by smoothing (either Gaussian smoothing or fitting a plane or a parabola to the data). Then each pixel is normalized by dividing it by the mean pixel value at that location.
Another typical preprocessing step is to perform contrast stretching so that every pixel value lies between a predetermined interval. This is especially important if different dyes are being compared against each other as their relative brightness might be irrelevant.
Cell Segmentation and Object Detection
Most HCA analyses use image segmentation to separate cells in a field. Some commonly used methods for segmentation are Voronoi segmentation, model-based methods, seeded watershed, active contour-based approaches, graphical model segmentation, and active masks. 10-15 If tissues with both normal and cancerous phenotypes need to be separated, then graph partitions, clustering, or histogram-based segmentation methods are useful.
Most segmentation approaches are 2-step methods. Voronoi segmentation and seeded watershed require seed regions. In some traditional settings, a human operator would define the seeds manually, but this is not a solution for the large numbers of images generated by a screening study. Thus, automated methods are used. Nuclear-level segmentation, on a separately acquired nuclear channel, is often used to provide seeds for cell-level segmentation. Figure 2 shows an example of a 2-step segmentation approach where nuclei are used as seeds for seeded watershed cell segmentation. Similarly, active contour methods require a window around the cell to be segmented, and again, a coarse boundary of the nuclei can be used. The coarse boundary is deformed iteratively to output the boundary of the cell. Graph-partitioning methods perform well when the regions to be segmented are coarsely labeled.
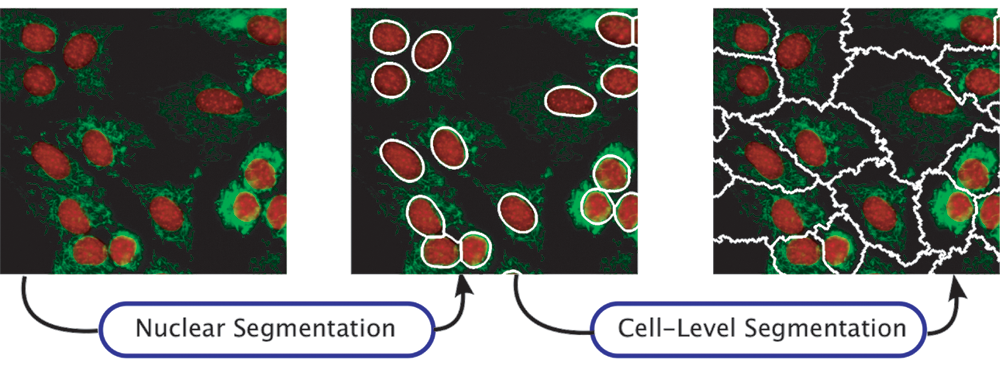
Two-step methods in cell segmentation. Nuclei boundaries are first detected using a model-based approach 15 and then smoothed to use as inputs to seeded watershed segmentation for separating cells.
The best segmentation results are obtained by complex methods that take multiple aspects into account (active contours and graphical models fall into this category). However, these methods are also often very expensive computationally (taking from seconds to hours per image). Therefore, the full algorithm is sometimes only approximated, or on other occasions, it is even preferable to use a faster method such Voronoi or watershed (which takes less than 1 s per image). Some judicious filtering, such as removing objects that are too small or too large to be a cell, can improve the quality of the results at the cost of losing some areas of the image. For many high-throughput screens, this might be the right trade-off.
Object detection can be used to get the shapes of objects such as cell, nucleus, vesicle, and other organelle boundaries. Segmentation approaches described here or Ridler-Calvard thresholding can be used to get the boundaries from their respective channels. For example, nuclear boundaries and nuclear spots can be acquired from the nucleus channel, coarse filamentous objects from the actin or microtubule channel, and small objects from vesicle channels such as lyososomes and endosomes.
Tracing
In some experiments, it may be useful to quantify the numbers, lengths, and relative sizes of branching structures in images at multiple scales. In
Three major methods are used for tracing. The first method is called skeletonization. 16,17 In this approach, an image is first segmented or coarsely thresholded. The remaining pixels (or voxels in 3 dimensions) are then removed systematically by considering the surrounding neighborhood. This process leaves a skeleton structure of the image. This skeletal structure can then be analyzed for the features of interest. The second method is often referred to as vectorizing. 18 This method is an exploratory method in that only a relatively small section of the image is analyzed in a step. A starting point is discovered in the image either manually or automatically. Once this starting point is identified, the algorithm recursively explores the region of interest. This method is significantly faster than the previous method because it considers only the regions of interest and not the entire image. The third method uses superellipsoids, 19 which are generally cylindroidal (cylinders with an elliptical cross section) as a model for the structures of interest. By modeling the structure in this manner, the structures can be represented compactly, and important features of the objects can be easily calculated. These methods have been shown to be effective with significant levels of noise in the images.
The general strategy for picking the method of choice is to compare the results from each of these methods with ground truth acquired by manual tracing of the filaments by an expert.
Tracking
To study the dynamics of movement inside cells, objects may be tracked from one image frame to the next. Even when intracellular movement itself is not the object of study, it may be necessary to track cells from one frame to the next to study their behavior. Sigal et al. 20 studied the cell cycle in an unsynchronized population by computationally aligning the trajectories. State-of-the-art methods for tracking in fluorescence imaging have been reviewed recently. 21
The traditional approach for tracking is to separate object detection and tracking steps. In the first step, a list of objects is generated. The simplest method is to threshold the image and then characterize all contiguous above-threshold regions as objects. The tracking (or linking) step consists of assigning objects in one frame to objects in the adjacent frame.
Objects are characterized by a set of measurements {
For harder problems, one needs to take into account multiple frames to model inertia in movement. State-of-the-art approaches are based on scoring a whole set of tracks at once 22 or particle filtering, a model-based probabilistic approach. 23
Registration
Image registration is the application of a geometric transformation to align an object in one image to a template object in another image. Registration methods include point-based, surface-based, or intensity-based methods. 24 Point-based methods align corresponding pairs of feature points that can be found a priori. Surface-based methods compute and align the 3D boundary surfaces of the 2 objects in the images. Intensity-based methods are increasingly becoming the most popular among the registration approaches. They transform the pixel or voxel values in an iterative fashion by optimizing a similarity score between the 2 images. There are many similarity scores published in the literature: some common examples are based on least squares, cross-correlation, and mutual information. 24 Intensity-based approaches are generally a good method to use as a starting point for many of the high-content applications.
This step in automated analysis is necessary if the features computed are not rotation invariant (see Image Features section). An important application of this tool is for alignment of successive slices in a 3D image. 25 This step is especially important if acquisition time of a single 3D image is long for live-cell imaging, where artifacts such as cell movement are possible. Another application would be in the alignment of immunohistochemistry tissue samples that have a high slice-to-slice variation because of tissue damage during slice preparation. 26
Image Features
Image features, numerical descriptors that can be computed directly from an image to represent its important aspects, form the heart of HCS and HCA systems. These features can be computed from 2D or 3D images or 2D or 3D time series. They can be derived from a single fluorescence channel or from 2 or more channels collected for the same field. Some features require presegmentation of the image into the single-cell region, whereas field-level features do not. Field-level features can be computed when the patterns in different cells within the field are fairly homogeneous. For analysis of cell patterns, features computed should preferably have properties such as invariance to image rotation or translation. If not, the images must be registered (see Registration section) before features can be computed. Example features include Haralick texture features, Zernike moment features, morphological features, object-based features, wavelet and frequency transform coefficients, threshold adjacency statistics, features from multiresolution subspaces, and others. 27-30 For any given HCA application, morphological and Haralick texture features generally serve as a good starting set of features because they often yield good classification accuracies. However, not all features are important for every application, and feature selection can be used to identify them (see below). Despite the vast set of features mentioned above, problem-specific features need to be designed for cell biology problems to improve classification accuracies (see Automated Learning Paradigms sections)—for example, the extent of overlap between a protein and a nuclear marker or edge features for microtubules. 31 Some features can also be parameters of a generative model that comprehensively describes the pattern in an image. For example, the parameters of object-based subcellular pattern models have been demonstrated to be capable of distinguishing major subcellular patterns nearly as well as descriptive features. 32
Feature subset selection and recombination
Not all features that can be computed may be useful for a desired task. For some machine learning algorithms, the presence of large numbers of uninformative or redundant features may inhibit performance. In such cases, feature selection methods can be used to select a subset of the features that are most informative in discriminating the various classes. Stepwise discriminant analysis (SDA) is one such method where the criteria for selection are based on statistical tests at every step as the number of features selected is increased. 33 A number of other methods have been described, and a comparison of their performance for subcellular pattern classification has been presented. 34 Since that study, additional methods such as minimum redundancy maximum relevance have been described. 35
An alternative to feature selection is to create new sets of features by recombining the original features. The basic idea is to project the feature data to a lower dimensional space whose bases are computed by solving an optimization problem. Linear supervised approaches are called linear discriminant analysis, and a popular method is Fisher linear discriminant, where the features are weighted to output a lower dimensional feature vector. If the manifold of feature space is nonlinear, higher order features can also be created by using kernel methods with the goal to improve accuracy of classification between the various classes of images. In addition to supervised approaches, unsupervised approaches such as principal components analysis (PCA) or independent components analysis (ICA) can be used when labeled data are not available. Depending on the data, many variations of feature recombination algorithms can be designed by modifying the objective function to be optimized. Examples include maximum variance unfolding, nonlinear PCA, and Isomap.
Automated Learning Paradigms
Over the past 30 years, there has been tremendous growth in the computational methods for automated learning and discovery. The discipline of machine learning emerged from the field of artificial intelligence that had previously been dominated by rule-based, knowledge capture approaches. The essential characteristic of machine learning systems is their ability to improve their performance with experience. There are 3 basic paradigms: supervised, unsupervised, and semi-supervised learning. Once features have been extracted and computed, supervised classification methods can be used to recognize different classes of samples, such as drugs that do and do not cause a desired change or normal and diseased phenotypes in pathology studies. Unsupervised clustering, on the other hand, can identify novel phenotypes. Semi-supervised learning employs both supervised and unsupervised methods.
Supervised
Supervised learning is a paradigm of machine learning concerned with performing classification and regression on labeled data to build a concise model of the distribution of class labels. 36 Example labels or classes for a cytotoxicity assay include (1) normal, (2) necrotic, and (3) apoptotic. Given a set of classes a priori and example members of such classes, supervised learning techniques can learn a classifier (a function) that can assign new data points to one of the classes.
This sort of approach is appropriate, for example, in classifying shape. The properties of shape, such as width, circumference, or convexity, can be quantified, and these morphological features can be used to create a classifier. For example, in nuclear shape analysis, intensity and nuclear spot features were computed and used to classify and profile nuclear phenotypes. 37 Another example involves determining protein subcellular location patterns: given a set of subcellular protein location patterns observed through microscopy, supervised classification algorithms such as neural networks or support vector machines can assign a location within the cell to the protein pattern. 7 Classification can also be used to reject out-of-focus images, by labeling such images as a separate class in a classifier.
Unsupervised
Whereas supervised learning deals only with labeled data and seeks to either classify or regress against the data, unsupervised learning makes no initial assumptions about how the data are related and instead seeks to discover and characterize the hidden distribution of data. In unsupervised learning, or clustering, the data are unlabeled, and algorithms such as self-organizing maps, k-means, or hierarchical clustering are used to observe how the data group together and measure the distances between data points in the feature space. While clustering, 2 important considerations must be taken into account: (1) the distance metric used in feature space and (2) the number of clusters, where the Akaike information criterion (AIC) is often used in combination with the model likelihood to estimate the optimal number of clusters. A helpful discussion of using AIC to pick the number of clusters has been presented recently. 38
These methods can be extremely useful to distinguish images in which the general phenotypes, or the effects of added drugs, are unknown. Early examples of the application of unsupervised methods in HCA include building subcellular location trees for large numbers of randomly tagged proteins 39 and learning how centrosome duplication is affected by a number of different drugs. 40 In these cases, the unsupervised approach is given a set of images and clusters them according to the fundamental patterns they contain. Figure 3 shows an example in which a tree of subcellular protein locations is created by hierarchical clustering of subcellular patterns, based on their z-scored Euclidean distance.
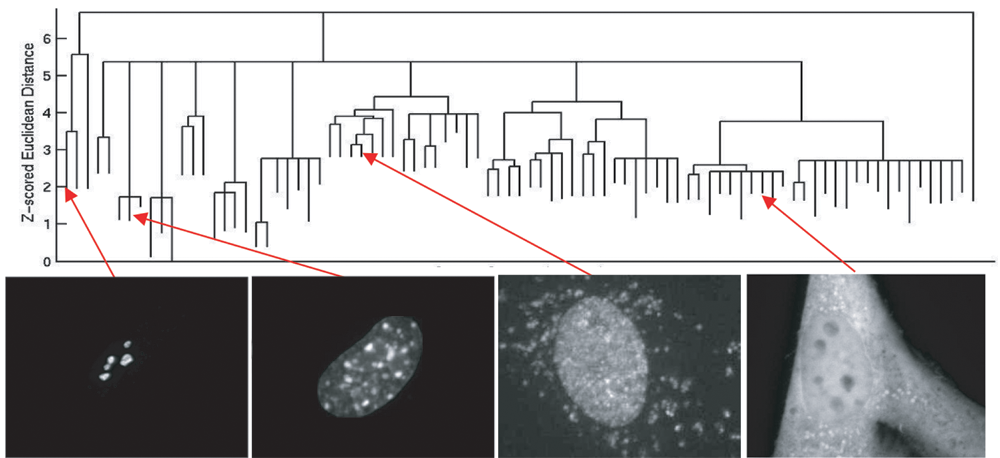
Hierarchical clustering of subcellular localization patterns in CD-tagged 3T3 cells. Four representative images from different clusters in the tree are shown. Adapted from Murphy. 56
Semi-Supervised
Unlike supervised learning methods, where all data are labeled, and unsupervised learning methods, where all data are unlabeled, the semi-supervised learning paradigm addresses the presence of both labeled and unlabeled data. In some cases, semi-supervised learning methods can be used to augment supervised learning algorithms where data are scarce and can also improve unsupervised learning by incorporating a small amount of known data. 41 Although there may be many known patterns in the data being analyzed, the possibility remains that some have yet to be observed. Using a small amount of labeled data, the large quantities of unlabeled images available in HCA can be used as training and testing instances along with the labeled data, identifying and classifying known patterns and possibly exposing previously unobserved and novel patterns.
Most current HCA applications use supervised methods, but semi-supervised methods are now being applied. For example, a method relying on semi-supervised learning but also on transductive learning, to distinguish subcellular organelle patterns, has been described. 42
Applications
Automated image analyses have been reported for many HCS applications that are based on gene expression, RNAi, and small-molecule screens, and many more unpublished studies have been carried out within the pharmaceutical and biotechnology industries.
In small-molecule screens, the goal is to identify a set of small molecules that cause a phenotypic change. 43 However, an additional challenge would be to identify the biochemical target of that small molecule. An example of a small-molecule screen using automated image analysis is done by Tanaka et al. 44 Furthermore, image analysis methods can also be used to profile the drug dosage phenotypic response of various drugs. 45
The goal of RNAi screens is identifying a set of genes that express mutant phenotypes when inhibited by siRNA interference. 5 Depending on the pathway that is of interest, cells with appropriate biomarkers are imaged under a fluorescence microscope (e.g., tagged tubulin would be an appropriate marker for studying cytoskeleton reorganization) after treatment with one of a library of siRNAs. The images are segmented, registered, and features extracted from every cell and summarized for every siRNA as well parameters. Example well parameters based on number of nuclear spots include fraction of cells with varying numbers of nuclear spots. Using these parameters, genes (or siRNA) are scored and statistical tests are performed to identify unique genes that could be involved in the pathway. 46 Researchers have reported using this technology for identifying genes involved in mitotic spindle assembly, 47,48 cell morphology, 49 viral infection, 50 and others. Recently, regression modeling was proposed for scoring images to predict the biological relevance of genes in RNAi screens. 51
Discussion
This review presents an overview of automated image analysis methods used in HCA. HCA is a relatively new approach to life sciences that adds a spatial dimension to vast amounts of cell biology data for drug discovery that have been made possible because of advancements in the throughput of transmitted light and fluorescence microscopy. Because of this explosion in the amounts of image data, image analysis has become the bottleneck in the HCA process. Recent advances in microscopy image analysis tools that are based on the framework of machine learning have provided approaches that yield high accuracy. 28
However, one important analysis step to be performed after every automated image analysis section is validation. Each of the sections discussed here can be analyzed using many approaches mentioned in this review, but the best one is picked on the basis of validation where most strategies are based on quantifying accuracy by comparing predictions with the ground truth.
As more high content data are available, online strategies for analysis must be made available as well as database methods to query new data or retrieve existing data. Operations that image database systems must provide include choosing a set of images based on image metadata, picking a representative image from a set of images, finding the most similar image to a given query image, comparing distributions of images under different conditions, and clustering images by their pattern. Many database systems for HCA have been described such as the Protein Subcellular Location Image Database, 52 Open Microscopy Environment, 53 or the Cell Centered Database. 54 In addition, the Human Protein Atlas provides a major source of cell and tissue images showing the patterns of thousands of proteins. 55
The image analysis tools briefly reviewed here can be expected to be used increasingly in new HCA applications to minimize human effort, improve accuracy, and, most important, provide the structured information necessary for the success of systems biology and personalized medicine.