
Abstract
The human estrogen receptors (hER) are members of the nuclear hormone receptor (NHR) superfamily and represent important drug targets for the pharmaceutical industry. Initially, ligand binding assays were used to identify novel ligands using receptors purified from native tissues. With the advent of molecular cloning techniques, cell-based transactivation assays have been the gold standard for many years of drug discovery. With the elucidation of the structural mechanisms underlying the activation of NHRs, cell-free assays with purified receptors have become important tools to directly assess different binding sites (e.g., the hormone binding site or the cofactor binding site). The available cell-free assays have so far facilitated the study of one binding site at a time. With the introduction of Terbium (Tb3+)–based time-resolved fluorescence energy transfer (TR-FRET), it has become possible to measure 2 different interactions within 1 test tube in parallel. The authors have applied this technology to develop a dual readout system for the simultaneous monitoring of steroid hormone site binding and cofactor peptide recruitment. They took advantage of a commercially available fluorescent tracer as an indicator for classical steroid site binding and designed a novel peptide derived from the peroxisome proliferator-activated receptor gamma coactivator-1a (PGC1a) as an indicator for functional agonistic behavior of a test compound. The established assay is able to differentiate between agonists, antagonists, partial agonists, and compounds binding to the cofactor recruitment site. The IC50 values obtained for a number of reference compounds in the multiplexed assay are in concordance with published data. The simple 1-step mix-and-measure protocol gives excellent quality and robustness and can be miniaturized to 5-µL volume.
Introduction
T
Activation of nuclear hER triggered by binding of the natural ligand estradiol (E2) induces homodimerization and binding of additional transcriptional cofactors that are subsequently recruited into a multiprotein complex to facilitate transcription. The assembly of the transcriptional complexes is mediated by 2 regions of the hER: activation function 1 and 2 (AF-1, AF-2). Together with the other steroid hormone receptors, the hER shares a common domain structure with domains A to F. The less conserved A/B region is termed activation function 1 (AF-1) and promotes ligand-independent functions. The conserved C domain is responsible for DNA binding and connected via a short-hinge region (D domain) to the AF-2, or ligand binding domain (LBD, E domain). The F domain is not conserved within the NHRs, and its function for the hER is less well characterized. On the molecular level, ligand binding induces reorientation of helix12 within the LBD, which opens a hydrophobic binding site for coactivator proteins. The classical steroid receptor coactivator proteins (SRCs) contain a conserved α-helical LXXLL sequence, also called NR box, that fits into the hydrophobic binding site of the NHRs. The LBD therefore acts like a molecular switch that allows effector binding by recruitment of LXXLL-containing proteins upon estradiol binding. 5,6
The essential molecular switch function makes the LBD the prime target for the identification and optimization of tailored ligands that modulate NHR function. Steroidal and nonsteroidal compounds have been developed that can function as pure agonists, partial agonists, or pure antagonists. In addition, selective estrogen receptor modulators (SERMs) have the property to act in a tissue-specific manner as either agonist or antagonist. These classical hER ligands bind to the steroid-binding site and have to compete with the endogenous estrogens in the therapeutic setting. Recently, several reports have shown nonclassical binding modes of antagonistic compounds, peptides, and peptidomimetics, acting through displacement of cofactors or inhibition of DNA binding. 7-9
There are numerous assays available to test hER activity. The classical functional assays monitor ligand-dependent reporter gene activity in cells expressing the hER and a reporter gene (e.g., luciferase) under the control of an estrogen response element (ERE). Cell-free assays have the advantage to directly address protein domains to be studied (e.g., the steroid binding site), 10 the LXXLL peptide recognition site, or the DNA-binding interaction of the C domain. 11,12 The use of homogeneous fluorescent methods has greatly improved the applicability for high-throughput screening (HTS). For example, time-resolved fluorescence resonance energy transfer (TR-FRET) and fluorescence polarization (FP) have been shown to give excellent assay quality and robustness for HTS in general and specifically for hER binding assays. 13-16 In addition, FP assays have been used for detailed analysis of cofactor recruitment of a purified full-length hER protein reconstituted at its ERE. 17,18
The increasing size of compound libraries requires novel strategies that reduce costs and duration of HTS campaigns. Reduction of assay volume, pooling of compounds, and assay automation are obvious solutions. Another approach is by multiplexing assays (i.e., implementing additional readouts in one well to obtain more information within one screening campaign). An example in the field of NHRs is the use of 2 labeled tracer molecules with different nonoverlapping absorption and emission properties for hER and progesterone receptor within one assay measuring competition binding to the steroid site via fluorescence polarization. 19 A different approach has been taken to study the differential recruitment of coactivator and corepressor peptides by TR-FRET for peroxisome proliferator receptors 20 and for the thyroid receptor. 21 In these reports, the unique fluorescence properties of the lanthanide Tb3+ were applied to transfer energy from a single fluorescence donor to 2 distinct FRET-acceptor molecules at different wavelengths. Of the 4 emission maxima of Tb3+, the first maximum at 490 nm could be used to generate FRET onto fluorescein and the fourth maximum at 620-nm transferred energy onto red-shifted dyes such as Cyanine 5. The emission of the 2 acceptor dyes at 520 nm and 665 nm was measured within a single well simultaneously.
In this report, we describe a novel application of Tb3+-based TR-FRET for the simultaneous measurement of events at the steroid site and at the cofactor site of the LBD of hERα. This multiplexed assay uses a fluorescein-labeled tracer that binds to the steroid site together with a coactivator peptide labeled with a red-shifted fluorescent dye. The assay can distinguish classical agonists from classical antagonists that bind to the steroid site and gives information on binding and functional activity (agonism or antagonism) within one measurement. In addition, compounds that bind to the LXXLL cofactor site can be characterized. We show that the readouts display minimal crosstalk and can be used to screen in an automated miniaturized 5-µL format. The dual readout helps to identify interfering compounds and thereby reduces false-positive rates. In a small-scale screen of 9000 randomly selected compounds, we identified several hits with unconventional agonistic activity.
Materials and Methods
Materials
All fluorescein-labeled tracers (Fluormone-ES2™ green, FL-PGC1a) and Estrogen Receptor Screening Buffer 2 (ES2SB) were purchased from Invitrogen (Karlsruhe, Germany). The Tb3+-anti-GST-antibody was purchased from Invitrogen (Karlsruhe, Germany) or from Cisbio international (Marcoule, France). Dy-labeled PGC1a-peptides (fluorescent groups: Dy647, Dy648, Dy649, Dy651, Dy652, Dy654, peptide: CEAEEPSLLKKLLLA PANTQ) were synthesized by Biosynthan (Berlin, Germany) by coupling the N-terminal cysteine to fluorescent maleimides from Dyomics (Jena, Germany). DMSO, dithiothreitol (DTT), and Pluronic F-127 were purchased from Sigma Aldrich (Steinheim, Germany).
Recombinant glutathione-S-transferase (GST)–tagged hERα-LBD (amino acids 302-595) was expressed and purified from Escherichia coli.
TR-FRET Assay in 384-well format
The assay components for all fluorescence-based assays were premixed in glassware and incubated on ice briefly. Typical concentrations for the monoplexed assays were 2 nM GST-hERα-LBD, 2 nM Tb-labeled anti-GST antibody, and either 2 nM Fluormone ES2 or 125 nM FL-PGC1a in ES2SB supplemented with 5 mM DTT and 0.001% Pluronic F-127.
Test compounds were dissolved and diluted in 100% DMSO, and 50 nL of each was transferred into black Greiner 384 small-volume plates using Cartesian HummingBird XL (Genomic Solutions, Huntington, UK). By addition of 5 µL of the premixed assay solution, compounds were diluted 100 times to their final concentrations. After centrifugation for 1 min at 900 rpm (Eppendorf Centrifuge 5810), plates were incubated for at least 1 h at room temperature under light exclusion.
Measurements were performed in BMG Pherastar Plus Spectrometers (BMG Labtech, Offenburg, Germany) using the LanthaScreen module (excitation 340 nm, emission A: 520 nm and emission B: 495 nm) with 20 flashes per well, 100-µs delay, and 1000-µs integration time (protocol MX520).
Multiplexed TR-FRET Assay in 384-well format
The general procedure was similar to the monoplexed assay. Typical concentrations used were as follows: 3 nM GST-hERα-LBD, 3 nM Tb-labeled anti-GST antibody, 3 nM Fluormone ES2, and 100 nM Dy-PGC1a peptide.
Fluormone displacement was measured using standard protocol MX520, and recruitment of the Dy-labeled peptide was monitored with the HTRF module (excitation 337 nm, emission A: 665 nm, emission B: 620 nm) with 20 flashes per well, 100-µs delay, and 1000-µs integration time (protocol MX665).
Library screening procedure
For screening of the compound library, compounds were provided as 1-mM solutions in 100% DMSO. In a fully automated SAGIAN™ Core System (Beckmann Coulter, Krefeld, Germany) with integrated Cartesian HummingBird XL, 50 nL of each compound was transferred into black 384-well small-volume plates (Greiner), sealed, and stored at −20°C until usage. 22 Immediately before the screening procedure, compounds were thawed and equilibrated to room temperature. Then, 5 µL of the preincubated, multiplex components containing mixture were added using Multidrop combi (Thermo Fisher Scientific, Waltham, MA) at medium speed (small-volume cassette). After centrifugation, the plates were incubated for 2 h, and TR-FRET was measured using protocols MX520 and MX665.
For data normalization, 1 column per plate (16 wells) contained 50 nL of a 100-µM E2 solution in 100% DMSO as “positive” control (cmax), giving a final E2 concentration of 1000 nM in the 5-µL assay. Another column was filled with 50 nL 100% DMSO to yield the “negative” control (c0).
Calculations and definitions
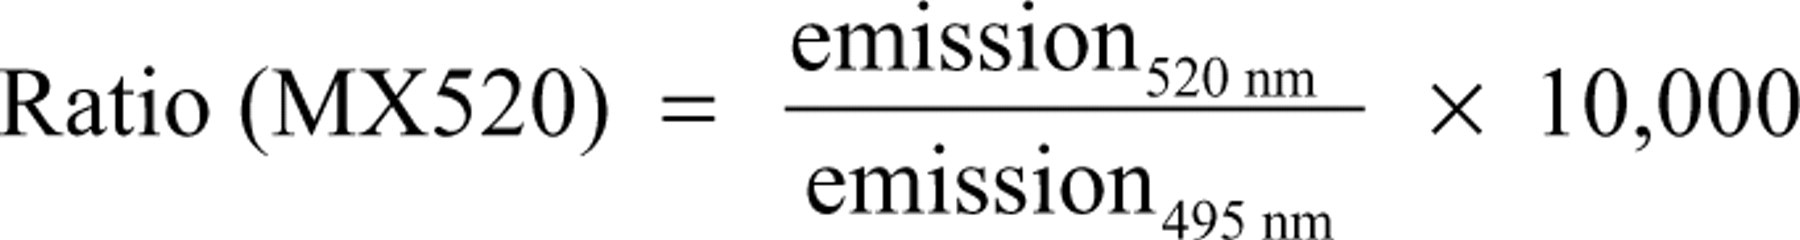
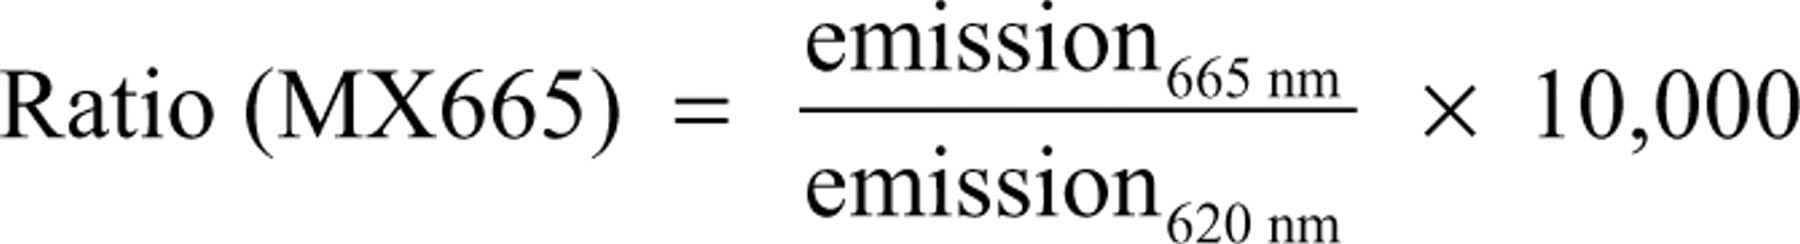
Data are depicted as ratiometric measurements of donor and acceptor fluorescence. The ratio is calculated by division of the emissions from fluorescence channels A (either fluorescein at 520 nm or Dy at 665 nm) and B (terbium at 495 nm or 620 nm). By the use of this simple internal correction, inaccuracies during measurement or liquid handling can be significantly compensated.
The relation of signal to background (S/B) is calculated as a quotient of the maximal divided by the minimal signal. For the binding assay (MX520), the maximal signal is represented by the unstimulated control, whereas full displacement at saturating concentrations of estradiol give the minimal signal (equals background).

Because the peptide is not recruited without estradiol, the relations are inverse for the recruitment assay (MX665).

The Z′ factor was calculated as published before. 23
Normalization method
Measurement data of the 2 different readouts, binding and recruitment, were normalized to the controls cmax and c0 to visualize results in a comparable fashion.


Using these equations for the analysis of a classical agonistic substance will result in a mirror-symmetrical curve chart starting with maximal response for binding and minimal response for recruitment.
Mathematical data analysis for the calculation of EC50 and IC50 values was performed with standard 4-parameter fit using GraFit 5.0 (Erithacus Software Ltd., Horley, UK).
Results and Discussion
Development of the dual TR-FRET assay for hERα
Multiplexing in TR-FRET has become possible with the introduction of Tb3+-based FRET technology. The emission energy spectrum of the Tb3+ is ideally suited to transfer energy to 2 distinct FRET acceptor molecules at different wavelengths. Our assay was based on a commercially available fluorescein-labeled TR-FRET acceptor molecule for hERα termed Fluormone-ES2™, which we have been using for TR-FRET binding assays. In this simple assay, GST-tagged hERα-LBD is bound to Tb3+-labeled anti-GST antibody. In the absence of test compounds, binding of the Fluormone-ES2™ to the steroid site of the hERα-LBD can be measured by TR-FRET from Tb3+ (excitation at 340 nm) to fluorescein (emission at 520 nm). Addition of competing test compounds displaces the Fluormone-ES2™, resulting in a decrease of TR-FRET signal. The assay is of very good quality but cannot distinguish between functional agonists and antagonists. A second assay implemented in our lab is a LXXLL cofactor recruitment assay. Here, we use a fluorescein-labeled peptide from the cofactor peroxisome proliferator-activated receptor gamma coactivator-1 (FL-PGC1a). In the absence of test compounds, there is no binding of FL-PGC1a to GST-tagged hERα-LBD and no TR-FRET signal. Addition of a functional agonist such as E2 induces a conformational change of the LBD, resulting in binding of FL-PGC1a to GST-hERα-LBD and TR-FRET signal increase. Functional antagonists (e.g., Faslodex™) do not result in FL-PGC1a recruitment. The assay can be run in an antagonistic mode by addition of E2 and thus prestimulation of peptide recruitment. Overall, the LXXLL cofactor recruitment assay very much resembles a functional cell-based reporter gene assay that can also be run in an agonistic or antagonistic fashion.
The concept of our novel multiplexed assay was to combine both assays into one. For this we kept the Fluormone-ES2™ tracer molecule and designed a PGC1a peptide carrying a red-shifted FRET acceptor dye ( Fig. 1 ). Binding of E2 simultaneously displaces the Fluormone-ES2™ and recruits the FL-PGC1a. This should result in a loss of the 520-nm signal representing competition at the steroid binding site and an increase of the 665-nm signal representing functional cofactor recruitment.
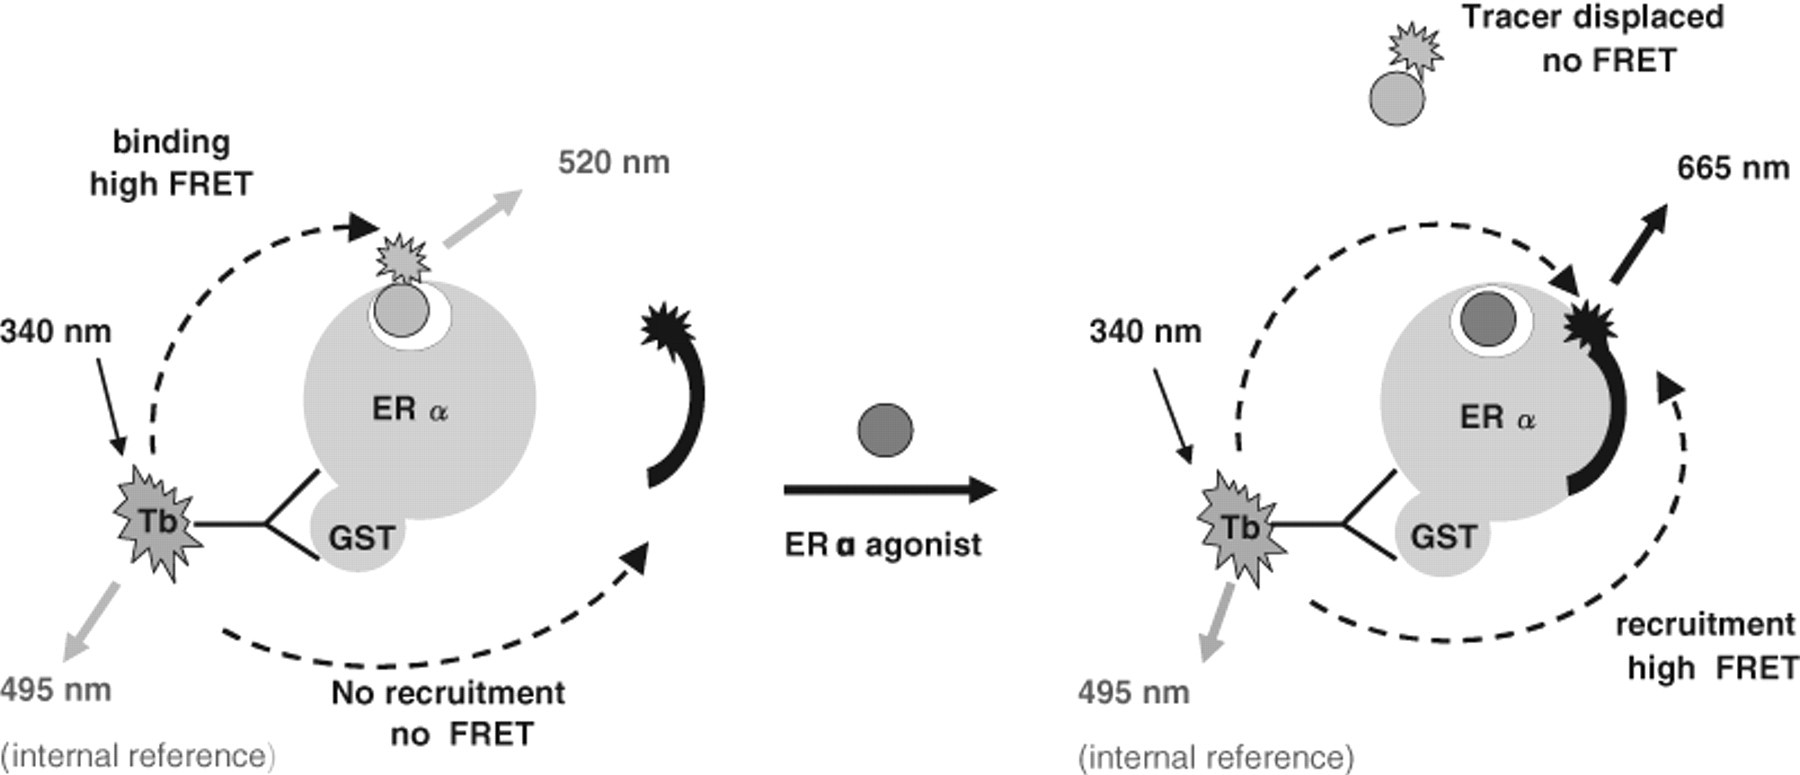
Schematic representation of the dual hERα time-resolved fluorescence energy transfer (TR-FRET) assay. Starting point for the multiplex assay is a trimeric complex of the hERα, the Tb3+-labeled anti-GST antibody (fluorescence donor), and the fluorescein-labeled ligand Fluormone ES2™ (fluorescence acceptor 1). Because binding of Fluormone does not promote peptide recruitment, the Dy-PGC1a peptide (fluorescence acceptor 2) is dissociated in solution. The initial TR-FRET-signal (measured at 520 nm) represents maximal binding of Fluormone ES2™. Addition of a classical agonistic compound displaces Fluormone ES2™, resulting in a signal decrease for TR-FRET at 520 nm. Simultaneously, the signal measured at 665 nm increases due to recruitment of the Dy-PGC1a peptide.
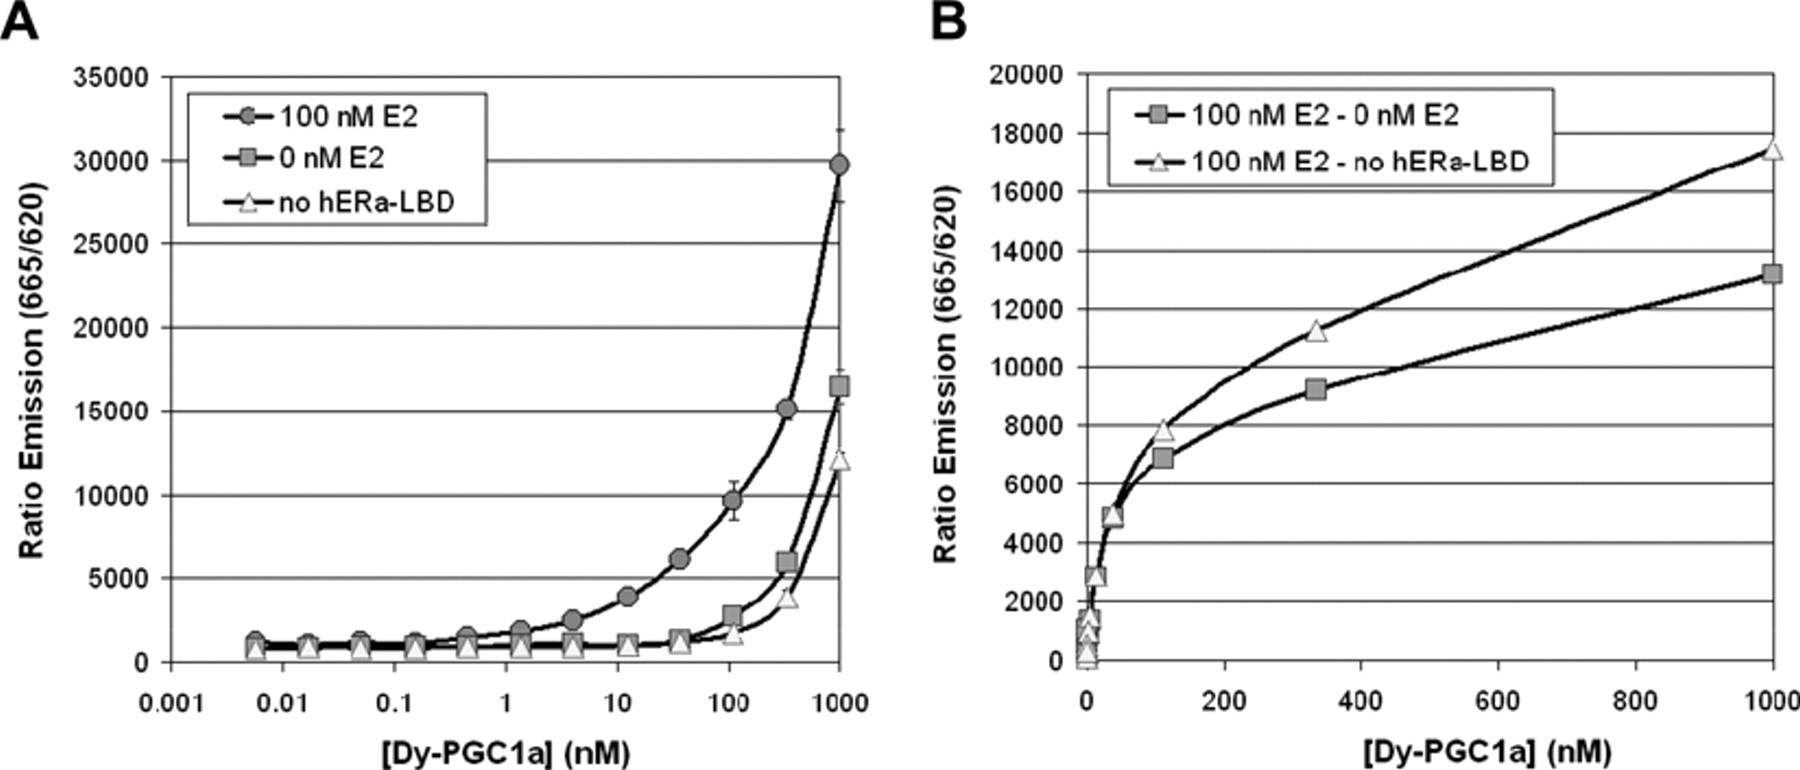
We first designed and synthesized 6 different PGC1a peptides carrying different acceptor dyes at the N-terminus with fluorescence excitation and emission properties suitable for Tb3+-based FRET detection at 665 nm. All peptides were successfully recruited in the singleplex cofactor recruitment assay. The different peptides showed very similar properties with respect to affinity and signal intensity, and we chose the peptide with the best signal over background for further assay development. Figure 2 shows concentration-dependent signal increase of the Dy647-PGC1a peptide used for further studies (for simplicity termed in the following as Dy-PGC1a peptide). Binding to GST-hERα-LBD occurred already below 100 nM and was dependent on the presence of E2 as an agonist. At peptide concentrations larger than 100 nM, we also observed an increase in TR-FRET in the absence of E2. Roughly 70% of this E2-independent signal was in fact independent of the presence of GST-hERα-LBD. This unspecific TR-FRET at such high fluorophore concentrations could be caused by proximity of the donor and the acceptor in solution without direct interaction. In the optimized assay (see below), we used 100 nM of the labeled peptide to keep this unspecific signal contribution at an acceptable low extent (<10% of total window). The remaining 30% of the E2-independent signal can be attributed to binding of the Dy-PGC1a peptide to E2-free GST-hERα-LBD. When we corrected the TR-FRET signal in the presence of 100 nM E2 for the unspecific TR-FRET signals, we could observe a saturable binding curve for the interaction of the peptides with the hERα in this system. The determination of the half-maximal TR-FRET signal was hampered by the limited maximal concentration of 1000 nM we could use in this assay. We estimated a value of 100 to 200 nM for the Dy-PGC1a peptide. This number can be regarded as an apparent affinity in the TR-FRET-system but not as a real affinity constant because the assay setup was limited by the concentrations of the other assay components (2 nM anti-GST-Tb3+ antibody, 2 nM GST-hERα-LBD). Another unknown factor is the FRET-efficiency of the Tb3+/Dy647 pair, which could be at its limit even at nonsaturating conditions of the peptide.
Specificity of Dy-PGC1a peptide recruitment. (
Subsequently, we analyzed a possible crosstalk between the 2 TR-FRET acceptor molecules in the multiplex assay. Two possible mechanisms could attribute to crosstalk: (1) biophysical interference by filter effects of the fluorescent groups or (2) direct influence of the binding of Fluormone-ES2™ tracer molecule on the recruitment of the Dy-PGC1a peptide or vice versa.
First, we tested the influence of the Fluormone-ES2™ on the recruitment of the Dy-PGC1a peptide. The concentrations of anti-GST-Tb3+ antibody (2 nM), GST-hERα-LBD (3 nM), and Dy-PGC1a (100 nM) were kept constant, and E2 dose-response curves were measured at different Fluormone-ES2™ concentrations of 0, 1, 3, 6, and 10 nM ( Fig. 3 ). As shown in Figure 3A , there is a Fluormone-ES2™-dependent increase of the maximal TR-FRET signal in the binding channel. Fluormone-ES2™ has no influence on the signal measured simultaneously in the recruitment channel up to 10 nM ( Fig. 3B ). We even increased the Fluormone-ES2™ concentrations to 100 nM and did not observe any change in the recruitment signal (data not shown). Thus, we conclude that (1) there is no biophysical interference of Fluormone-ES2™ with the TR-FRET measured at 665 nm for the Dy-PGC1a peptide recruitment up to the maximal concentration of 100 nM used in this assay, and (2) the Fluormone-ES2™ does not act as an agonist per se, meaning it does not induce an agonistic conformation of the hERα-LBD. This result was not obvious from the beginning because the chemical structure of the Fluormone-ES2™ is not disclosed by the provider.
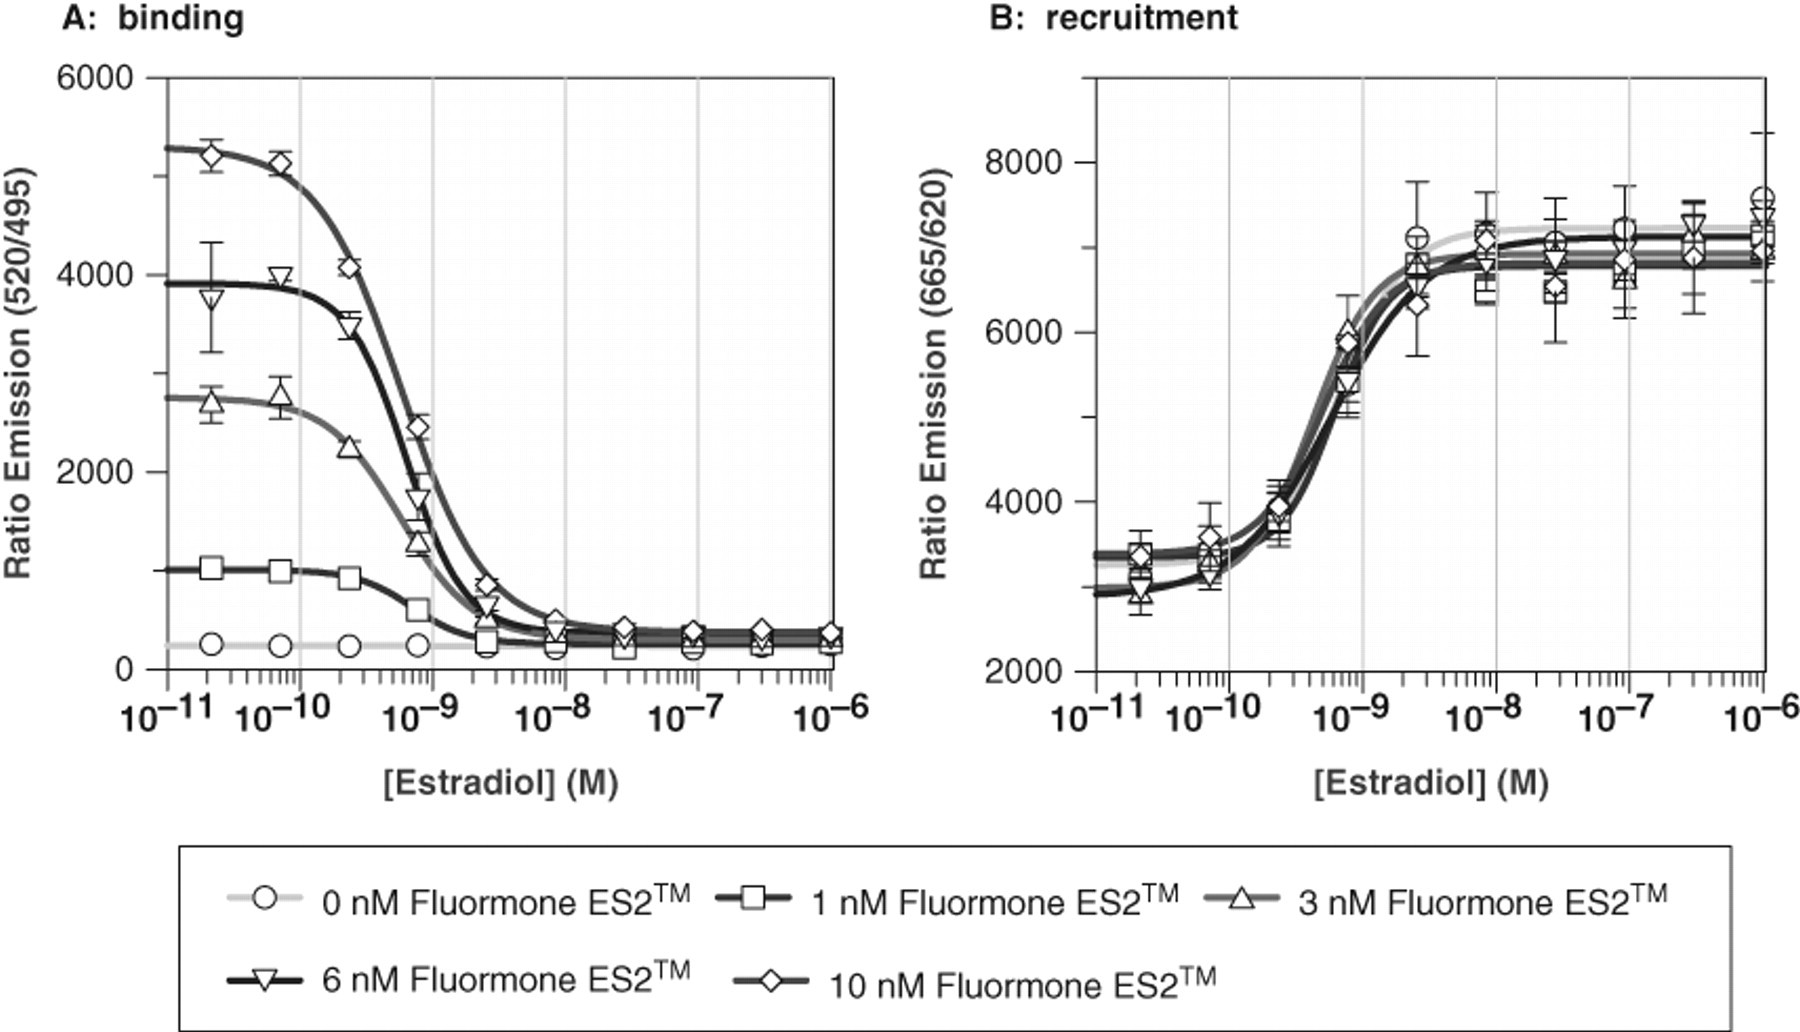
Influence of Fluormone-ES2™ on the dual hERα time-resolved fluorescence energy transfer (TR-FRET) assay. The concentrations of anti-GST-Tb3+ antibody (2 nM), GST-hERα-LBD (3 nM), and Dy-PGC1a (100 nM) were kept constant. Dose-response curves of E2 were measured at different Fluormone-ES2™ concentrations of 0, 1, 3, 6, and 10 nM. Data represent mean ± SD of quadruplicate data points. (
Next, we performed dose-response experiments with E2 in the presence of varying concentrations of Dy-PGC1a (0, 25, 50, 100, 200 nM). The concentration of anti-GST-Tb3+ antibody (2 nM), GST-hERα-LBD (3 nM), and Fluormone-ES2™ (3 nM) was kept constant. The results shown in Figure 4 indicate that the signal window for the recruitment channel (ex 337, em 665/620) increases with increasing concentrations of Dy-PGC1a. Again, the contribution of the unspecific TR-FRET signal at higher peptide concentrations results in higher overall FRET signals. In the binding channel (ex 337, em 520/490), the maximum TR-FRET signal measured at low E2 concentrations decreases with increasing Dy-PGC1a peptide concentrations (70% remaining max. signal at 200 nM peptide). This can be explained by unspecific binding of Dy-PGC1a peptide to unliganded GST-hERα-LBD (see Fig. 2 ). The binding of the Dy-PGC1a peptide at high concentrations might force the hERα into an agonistic conformation that is incompatible with binding of the Fluormone-ES2™, indicating exclusive binding of 1 of the 2 molecules to the receptor. When we calculated the IC50/EC50 values for E2 for the binding/recruitment readouts under the different conditions, we could not detect a significant difference. A peptide concentration of 100 nM was chosen as a standard concentration for further experiments, which is equivalent to or below the estimated affinity in the TR-FRET system (100-200 nM). At 100 nM Dy-PGC1a, the unspecific effects in the binding readout were below 10%, and together with the excellent EC50/IC50 data, we proceeded to further establish the multiplex assay.
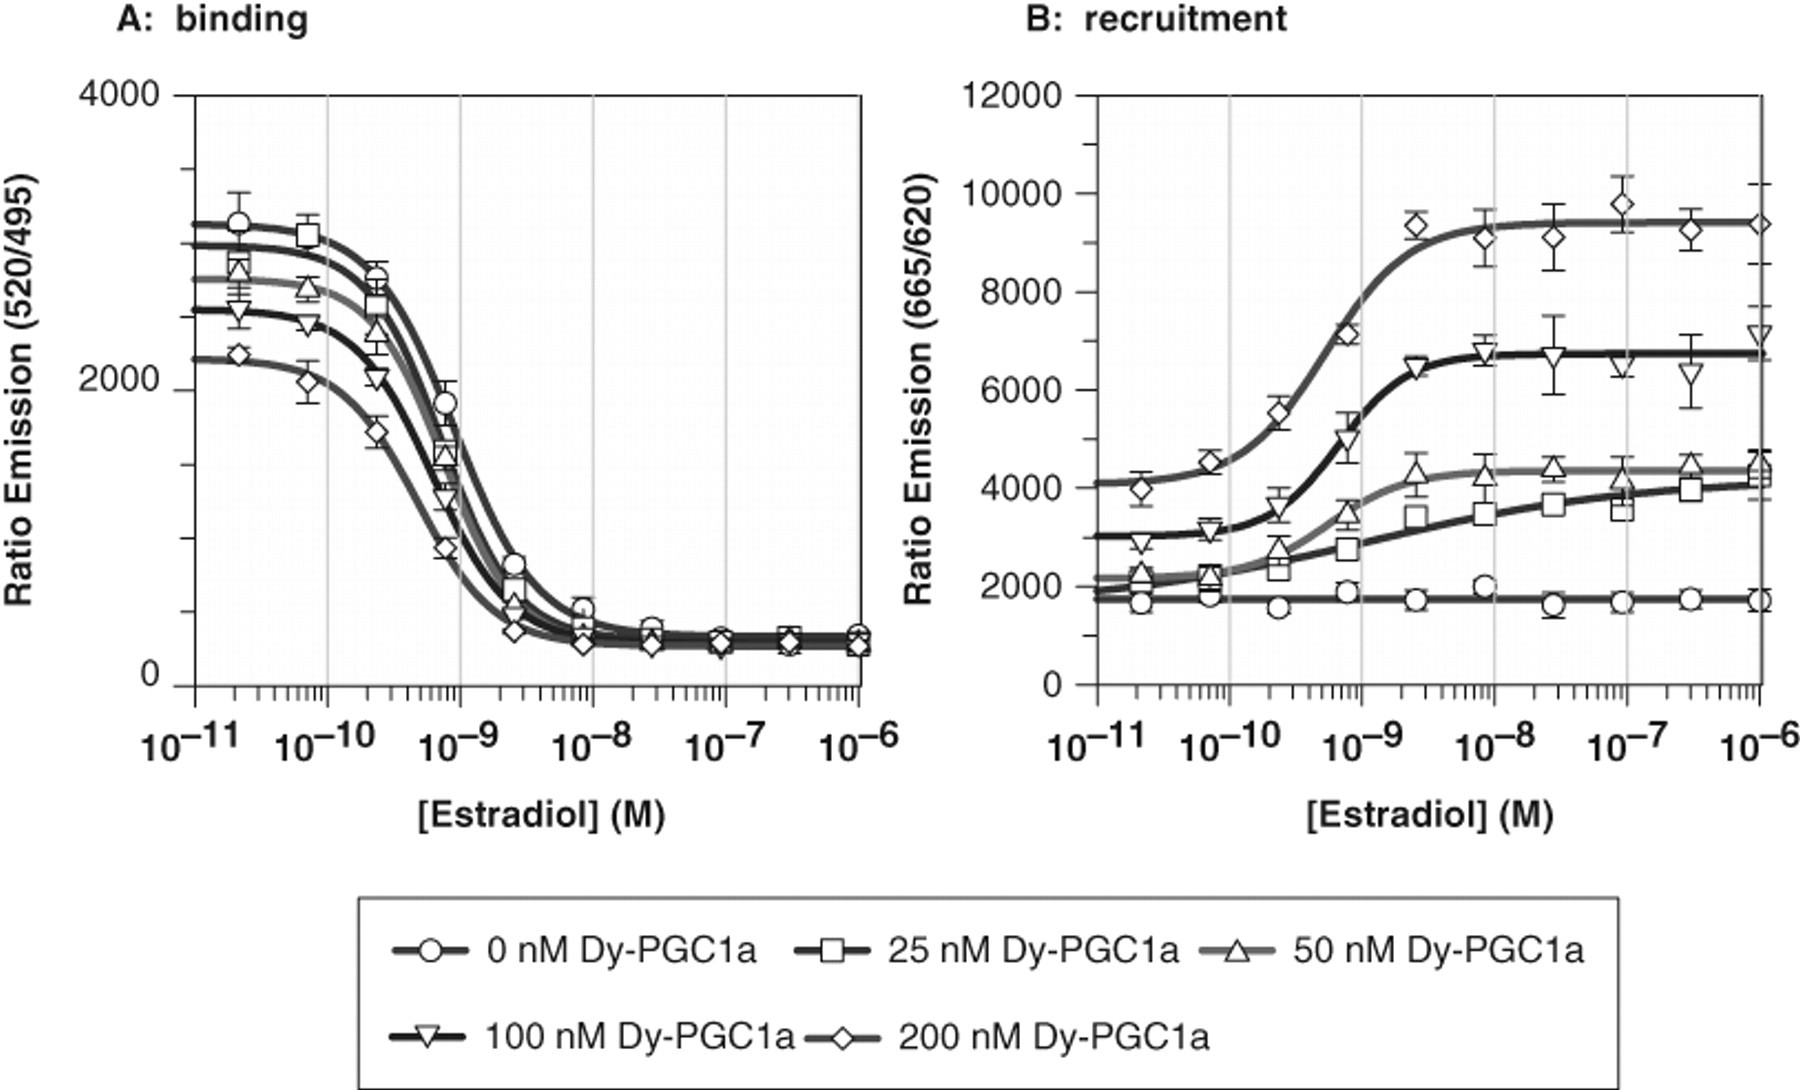
Influence of Dy-PGC1a on the dual hERα time-resolved fluorescence energy transfer (TR-FRET) assay. The concentration of anti-GST-Tb3+ antibody (2 nM), GST-hERα-LBD (3 nM), and Fluormone-ES2™ (3 nM) was kept constant. Data represent mean ± SD of quadruplicate data points. (
The above described experiments were performed in an HTS-compatible format of 5 µL in low-volume 384-well plates. Because of the reversibility of the interactions, all assay components can be premixed and dispensed in a single step. In our HTS campaigns, a final DMSO concentration of 1% (v/v) was present. 22 The dual TR-FRET assay proved to be very robust and showed no significant difference when measured with up to 5% DMSO. To assess the stability of the assay, we premixed all assay components in optimized concentrations (anti-GST-Tb3+ antibody [2 nM], GST-hERα-LBD [3 nM], Dy-PGC1a [100 nM], and Fluormone-ES2™ [3 nM]), dispensed 5 µL into each well of a 384-well plate containing 50 nL of E2 in 100% DMSO at different concentrations, and measured both channels after 1, 2, 3, and 4 h. The dose-response curves of E2 are virtually identical within this timeframe (data not shown). Complex formation is completed within 1 h, and signal stability is given for at least 4 h. Longer incubation times (8 h) are possible, but evaporation has to be monitored.
Assay validation using reference inhibitors
To validate the multiplexed hER TR-FRET assay, we tested 3 reference compounds: the agonist E2, the antagonist 4-Hydroxytamoxifen, and the unlabelled PGC1a-peptide ( Fig. 5 ). The data shown in Figure 5 are normalized to the maximum TR-FRET signal (= 1) and the minimum TR-FRET signal (= 0) for each of the 2 readouts (see equations 5 and 6). A value of 1 in the binding readout is obtained in the absence of a competing compound (no displacement of Fluormone-ES2™), and a value of 0 indicates full displacement. In the recruitment readout, the value 0 indicates no recruitment, and the value 1 indicates full recruitment. The means of 16 wells containing E2 (1000 nM) or 1% DMSO were used as references for normalization. As shown in Figure 5A , the dose-response curve for the agonist E2 in the binding mode is nicely mirrored by the recruitment of the Dy-PGC1a-peptide. Both curves span the full range of the assay window from 0 to 1 and meet at their respective IC50/EC50 of 1 to 2 nM. In contrast, the antagonist 4-Hydroxytamoxifen ( Fig. 5B ) is able to fully displace the Fluormone-ES2™ in the binding assay but does not induce recruitment of the Dy-PGC1a-peptide. The unlabeled PGC1a-peptide does not induce peptide recruitment and is unable to efficiently displace Fluormone-ES2™ in the binding readout ( Fig. 5C ). The slight reduction in binding signal by high concentrations of the unlabeled peptide fits the observed unspecific binding of the Dy-PGC1a-peptide to unliganded hERα-LBD (see above). The fact that both the unlabeled and the labeled peptides induce a similar and small reduction of Fluormone-ES2™ binding shows that the interactions of the PGC1a peptides with unliganded hERα are mediated by the amino acid sequence. The fluorescence label does not seem to play a role in this interaction.
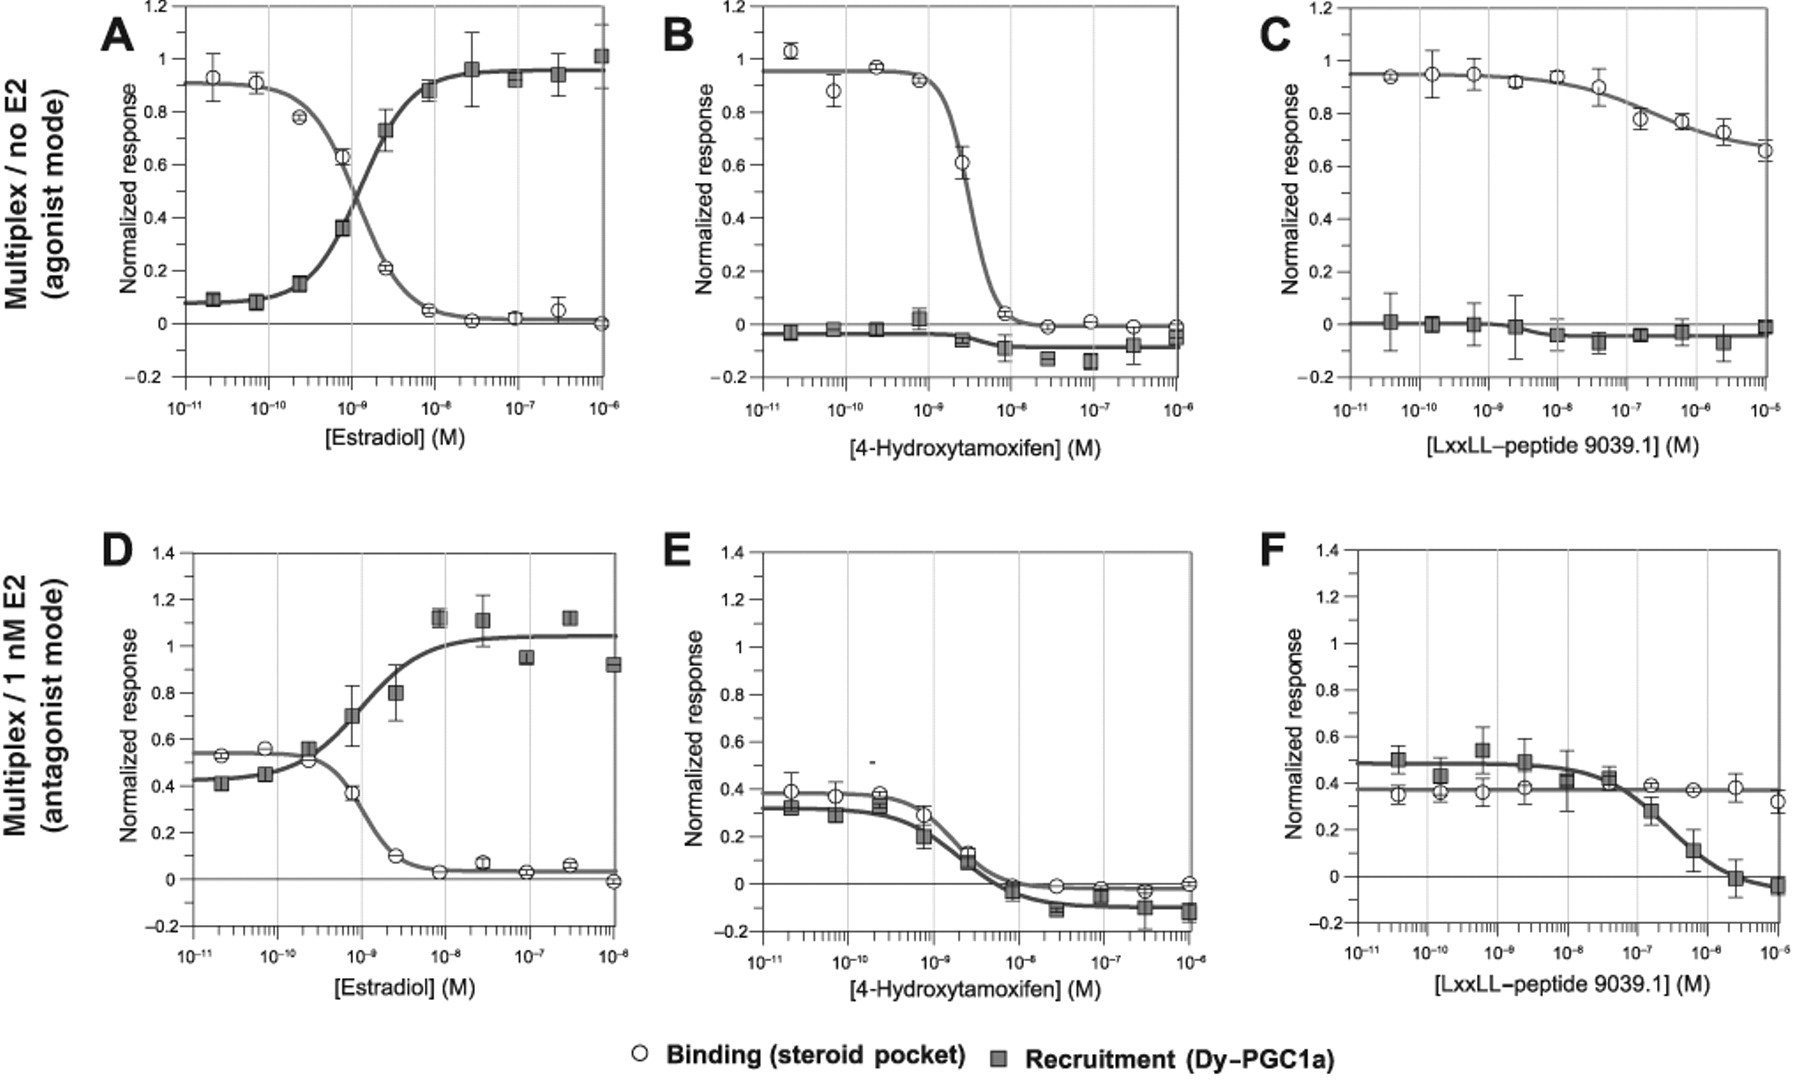
Validation of the dual hERα time-resolved fluorescence energy transfer (TR-FRET) assay with reference compounds. Dose-response analysis of 3 reference compounds in the dual hERα TR-FRET assay was performed (
The multiplex assay shown in Figure 5A - C was performed in the absence of E2 and proved to be well suited to characterize competitive agonists and competitive antagonists. But it is not suitable for the characterization of compounds that inhibit the peptide recruitment by direct interaction with the LXXLL binding groove. To overcome this limitation, we performed the same assay in the presence of a half-maximal concentration of E2 to prestimulate the peptide recruitment. As shown in Figure 5D , the dose-response curves for E2 start around 0.5 relative units, indicating the half-maximal effect in both readouts. At higher E2 concentrations, the binding curve approaches 0, and the recruitment curve approaches 1. This fork-shaped picture is typical for agonist action. 4-Hydroxytamoxifen reduces both readouts from the prestimulated value to 0, a typical picture for antagonists competing with the steroid binding site ( Fig. 5E ). The unlabeled peptide does not inhibit the binding readout but does clearly inhibit the cofactor recruitment to baseline levels ( Fig. 5F ). Thus, the prestimulated multiplex assay is a powerful tool to characterize compounds with different modes of action.
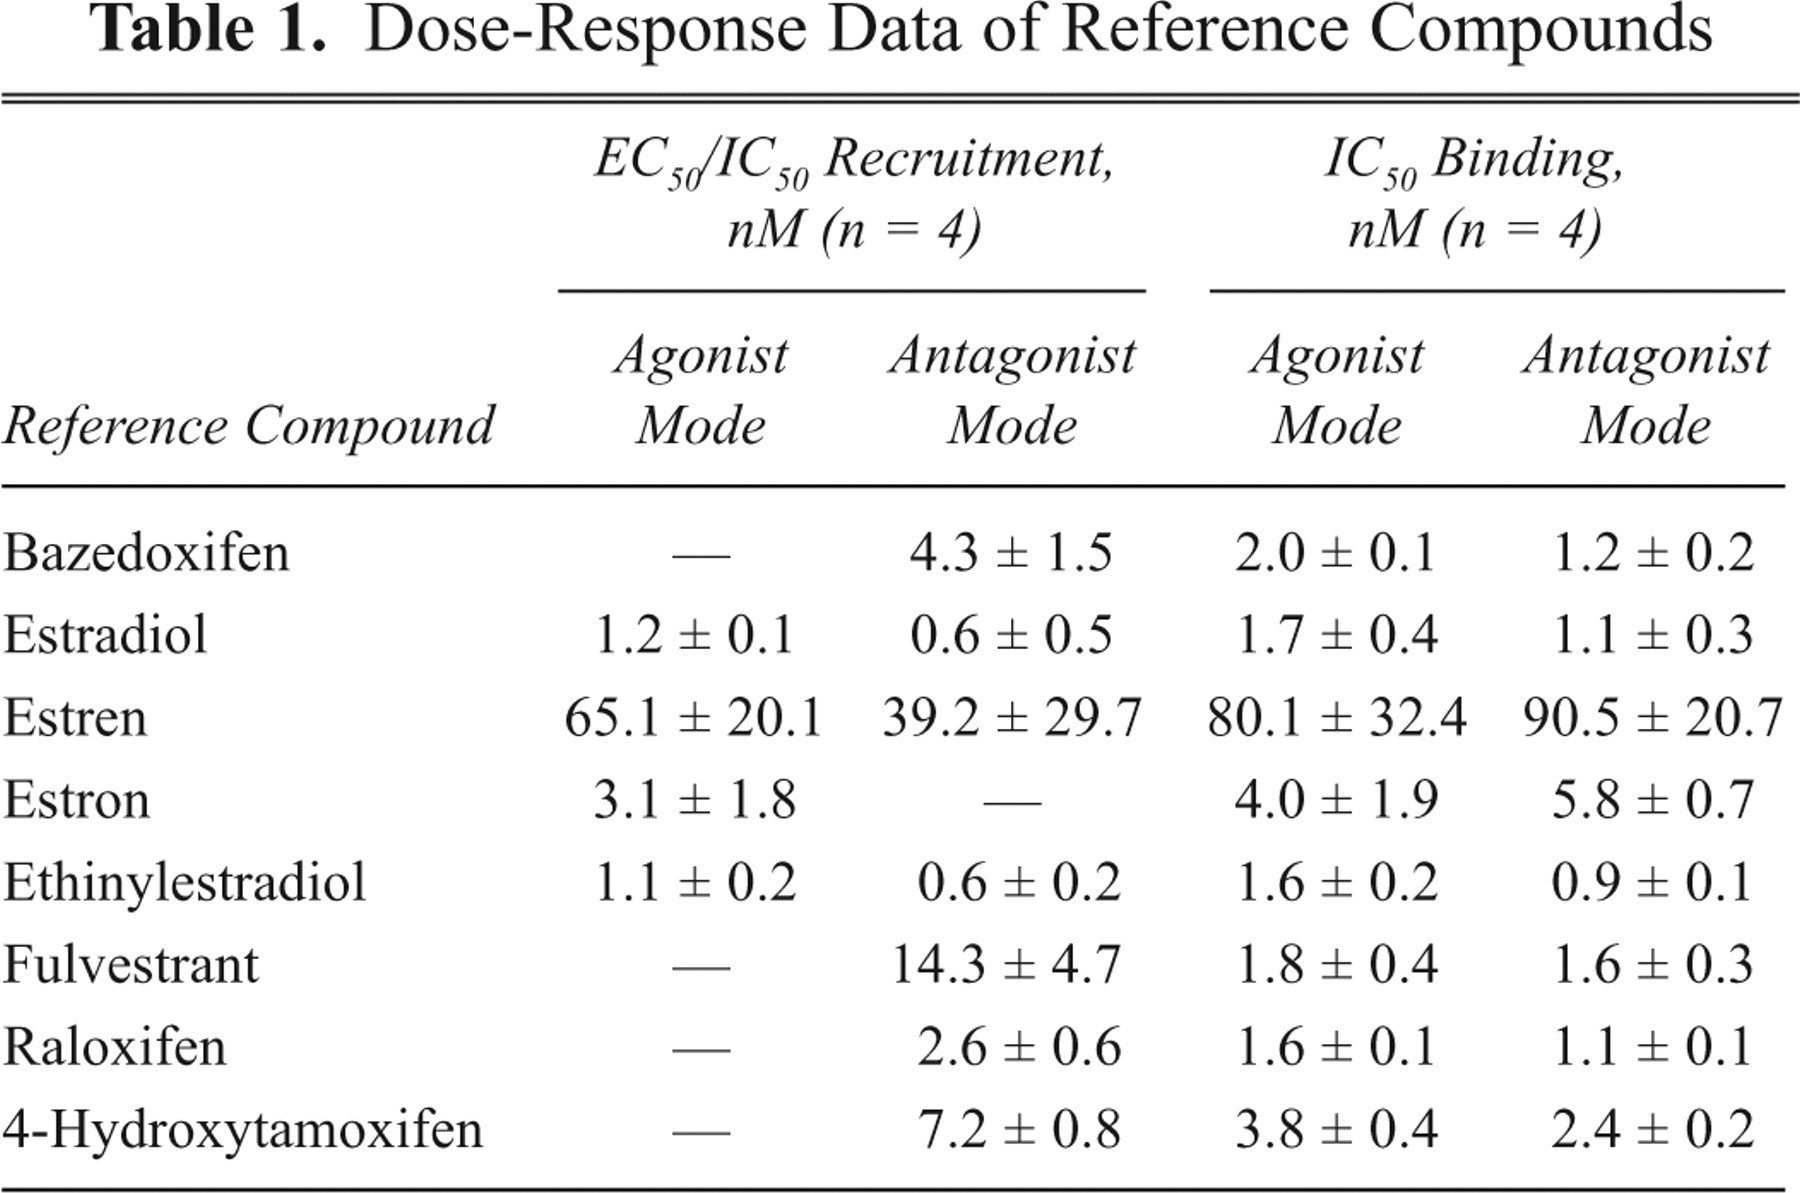
We tested a set of 8 different known hERα reference compounds, 3 agonists, 1 partial agonist, and 4 antagonists in the established multiplex assay. To assess the reproducibility, we performed the assay 4 times, and the mean and standard deviation of the IC50 and EC50 values for binding and recruitment are shown in Table 1 . Both readouts resulted in very similar and reproducible values, which are in good concordance with published binding data. 10,14,19,24 In the recruitment readout, all known agonists gave the correct response, and all antagonists were inactive.
Dose-Response Data of Reference Compounds
Application of the dual TR-FRET assay in validation HTS campaign
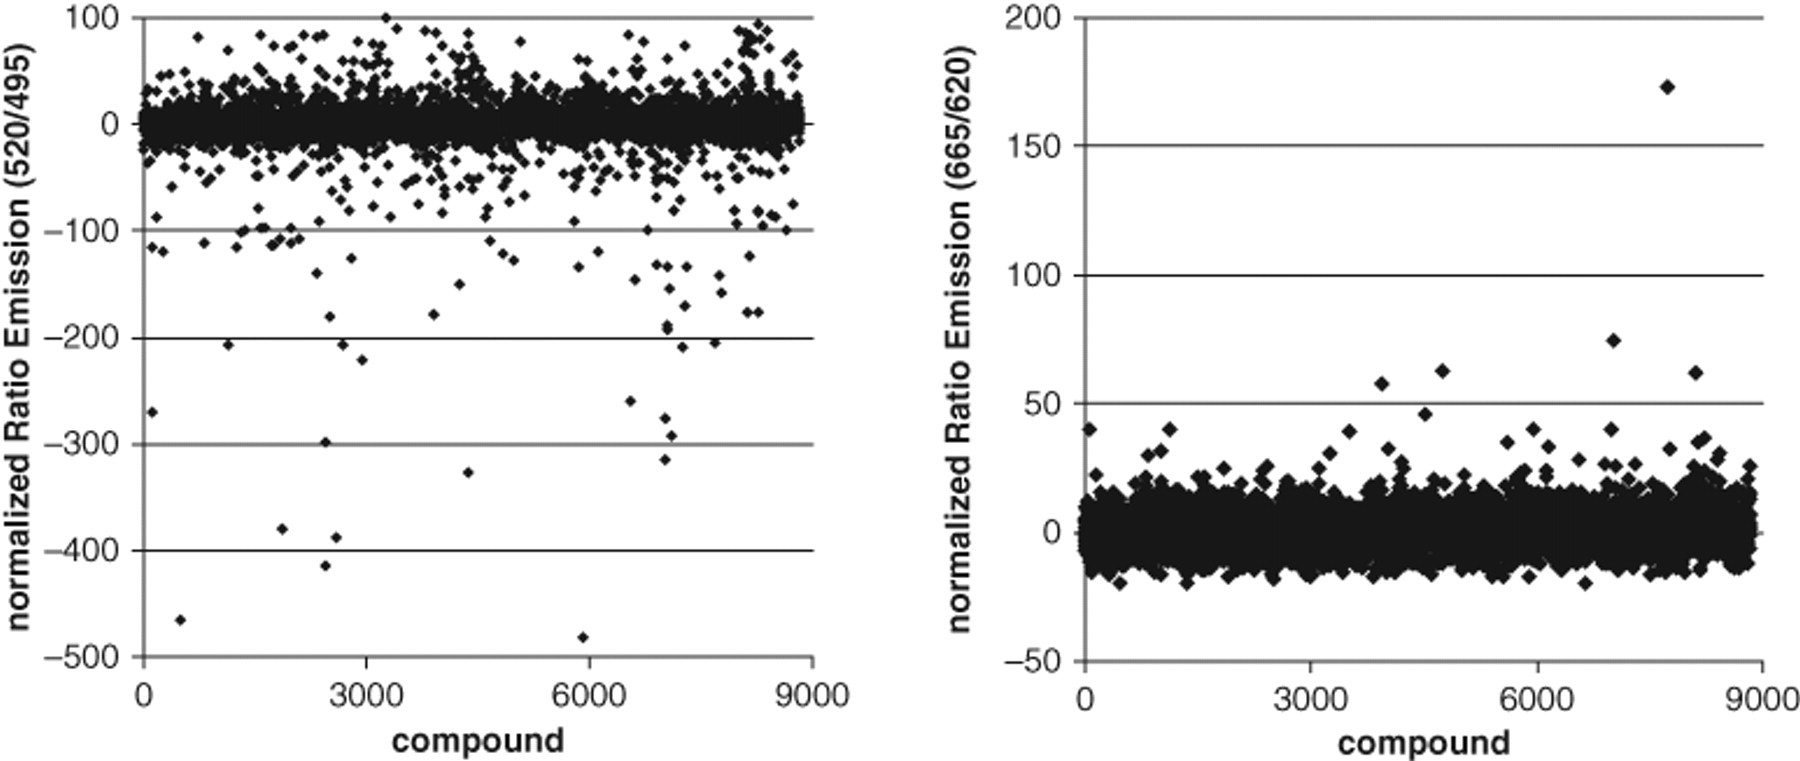
To apply the established multiplex assay to an HTS setting, we tested a set of 23 plates containing 9000 compounds in 384-well small-volume plates. The plates were prefilled with 50 nL test compound in 100% DMSO, and the assay mixture containing all components as described in Materials and Methods was dispensed in a single step into the plates using a Multidrop dispensing instrument. The quality control parameters for both readouts are shown in Figure 6 . The binding readout delivered excellent S/B ratios of 7 and Z′ factors between 0.6 and 0.9, whereas the recruitment readout showing low S/B ratios of 2.3 and Z′ factors of 0.5 was of less but acceptable quality. Despite this low S/B ratio and Z′ factors, the signal distribution of the compounds in the recruitment assay was very narrow and allowed a low hit selection threshold. The distribution of the normalized signals shown in Figure 7 indicates low data scatter in both assays. Most data points were centered around 0, indicating no effect. Interestingly, there were differences between the 2 readouts with respect to compound interference. In the binding readout, there were many compounds with strong negative normalized values (high TR-FRET signals). These values are typically a result of autofluorescence of the test compounds. In contrast, for the same test compounds, there was no interference detectable in the recruitment channel. When we analyzed the signals in the raw channels (495, 520, 620, 665 nm), it became clear that in this test set, most interfering compounds were increasing the 520-nm signal of the binding channel, without any effect in the longer wavelength channels above 600 nm. In an HTS campaign that relies on the 520-nm TR-FRET signal as the only readout, many interfering hits would have been removed from the first hit list even with ratiometric data evaluation. Still, real hits within this set might have been missed. Thus, another advantage of the multiplex assay is that in addition to enhanced information content, the selection of hits is facilitated by the multiple wavelength measurements.
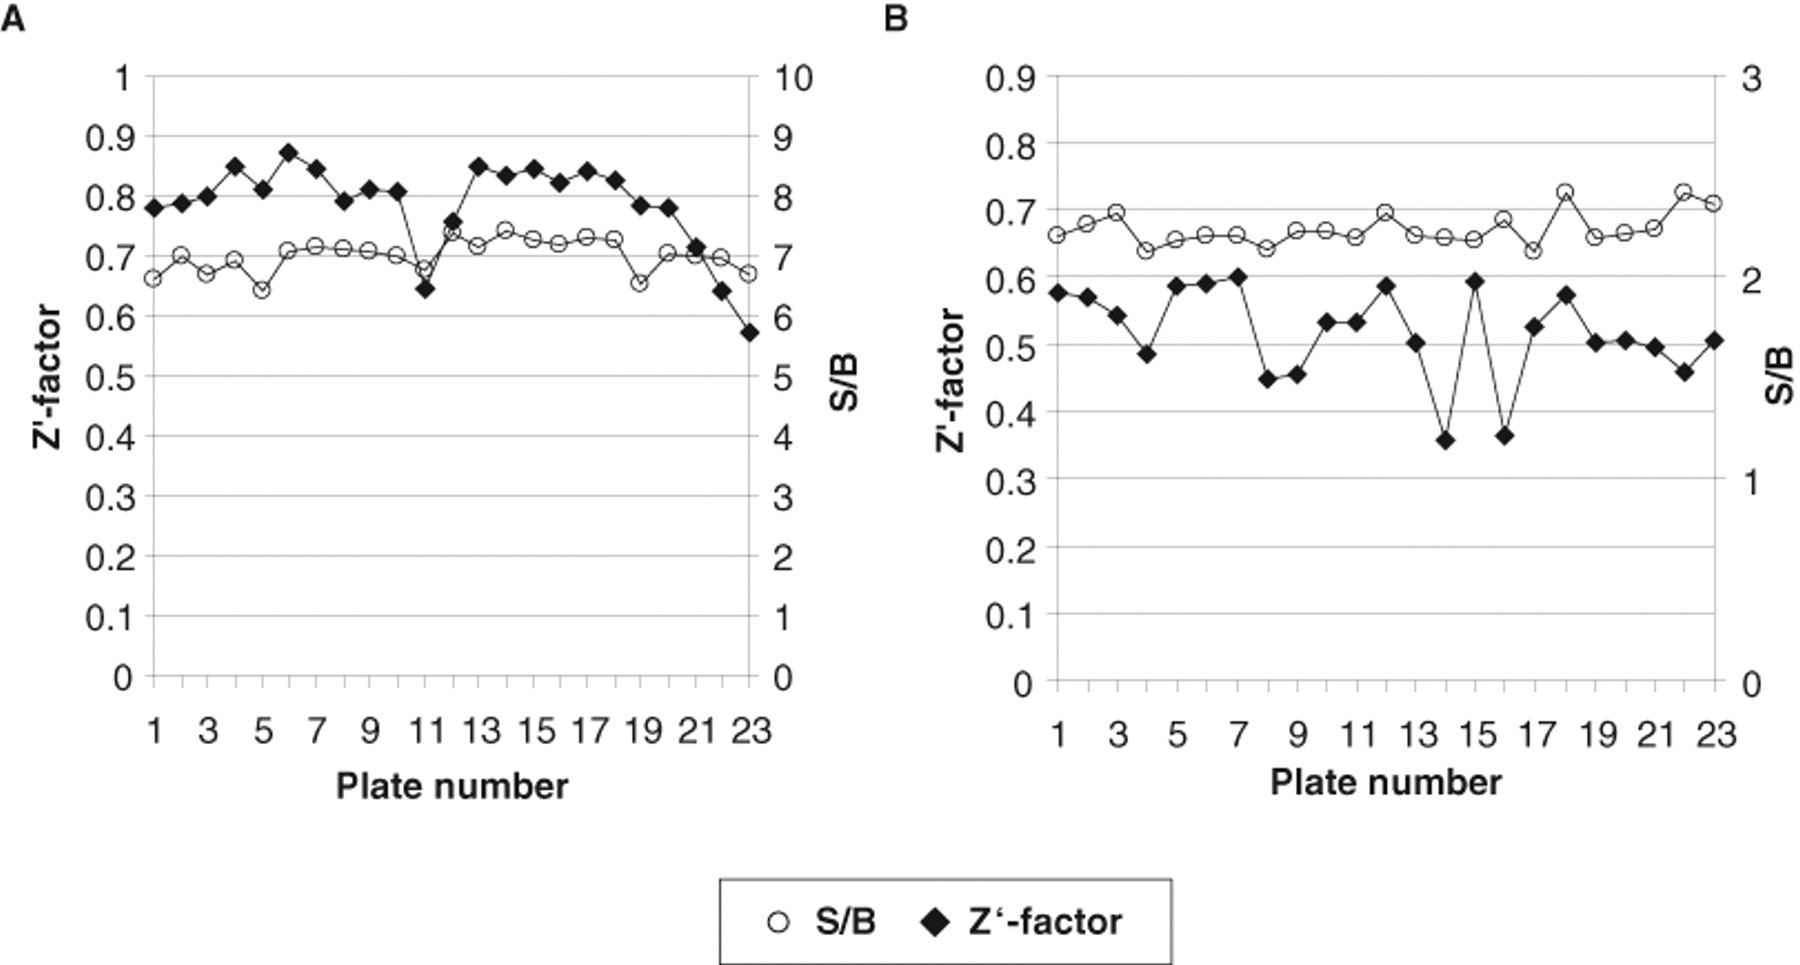
Assay quality parameters of the dual hERα time-resolved fluorescence energy transfer (TR-FRET) assay in small-scale high-throughput screening (HTS). A test set of 23 randomly picked compound plates in 384-well format was tested as described in Materials and Methods. Signal to background (S/B) and Z′ factor of the 23 plates are shown for (
Signal distribution of high-throughput screening (HTS) compounds. Normalized data for all compounds in the random HTS test set are shown for the (
Figure 8 shows a correlation of the 2 readouts for all compounds. We selected in total 133 hits for retests, which we performed directly in dose-response. Hit selection criteria were >40% effect in the binding readout or >20% effect in the recruitment readout. There were 14 hits identified in both readouts (agonists); 87 hits were found only in the binding readout (antagonists), and 32 hits were only active with regard to peptide recruitment. Of these hits, 94 (71%) were reconfirmed at 20-µM concentration with >40% effect in the binding readout or with >20% effect in the recruitment readout. Another 13 hits inhibited binding between 20% and 40% at 20 µM. Thirteen of the 14 compounds that were identified as hits in both the binding and peptide recruitment mode were reconfirmed. We obtained excellent confirmation rates of 75% (76 of 101) for binding mode and 46% (21 of 46) for the recruitment assay. The lower hit criterion of 20% in the recruitment assay might have directly caused the lower confirmation rate because of statistical false positives.
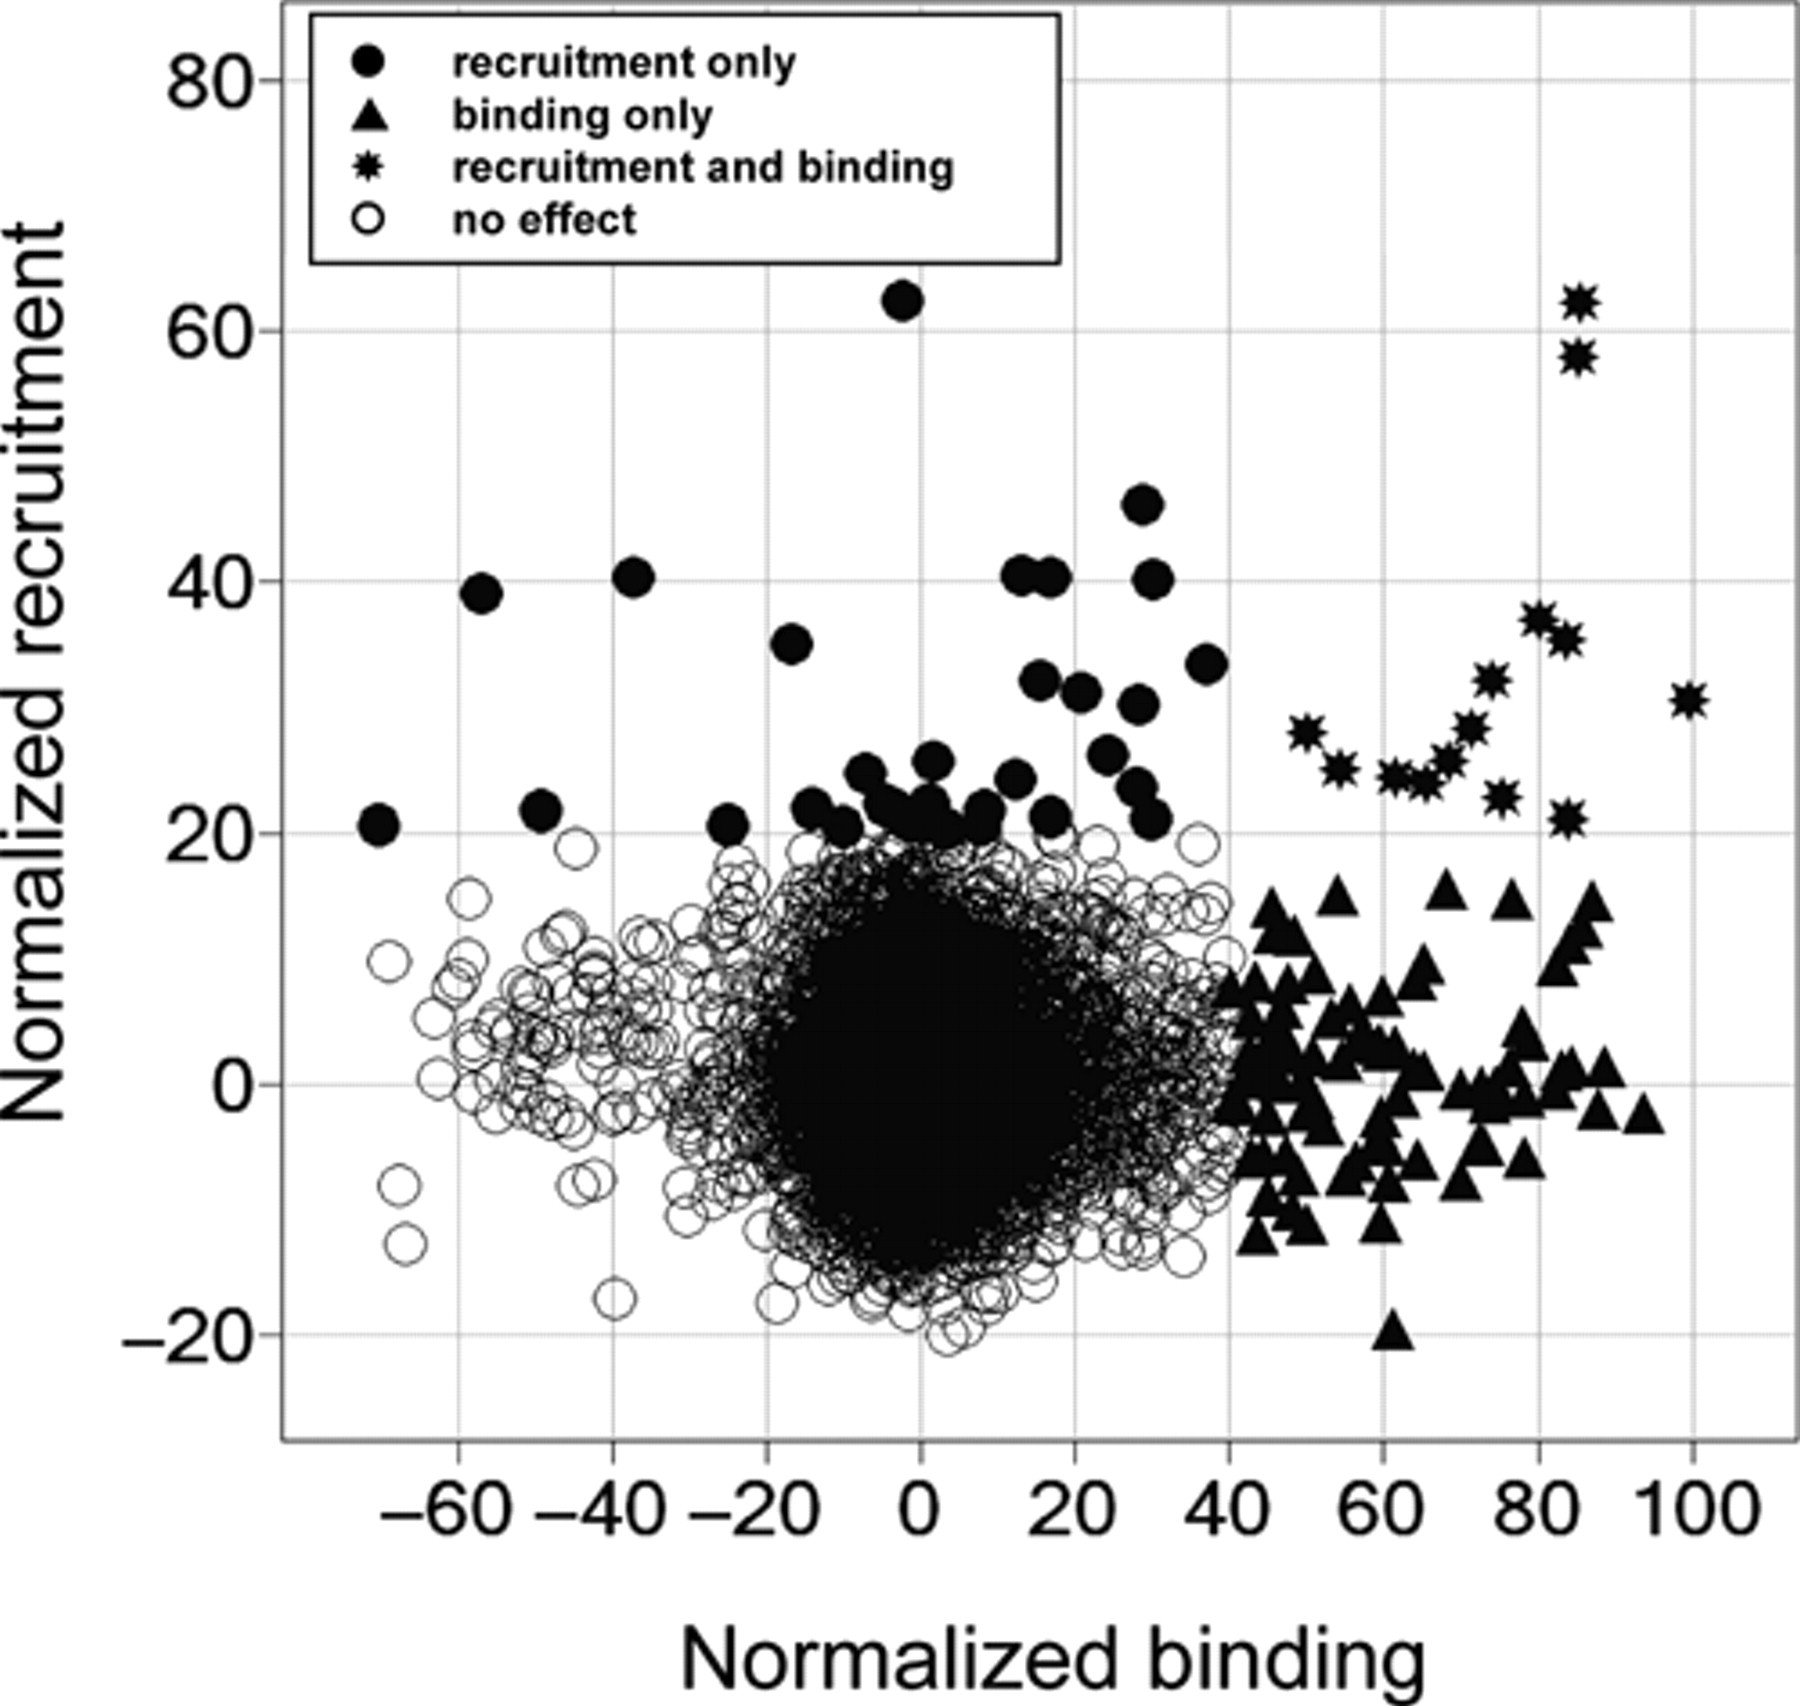
Comparison of high-throughput screening (HTS) data for binding and recruitment. The normalized data are shown in an XY-plot. Compounds with a binding efficacy greater than 40% or with recruitment signals greater 20% were chosen for dose-response analysis.
Interestingly, a subset of hits was active in the recruitment assay but showed no activity in the binding readout. These hits did not show any interference based on autofluorescence. As demonstrated in Figure 9 , compound 1 was fully active with respect to peptide recruitment but inhibited Fluormone-ES2™ binding only to 50%. Compounds 2 and 3 induced partial recruitment of 40% to 60%, but there was almost no inhibition of the Fluormone-ES2™ binding. The compounds were structurally related, indicating that this unexpected recruitment mode was a real effect.
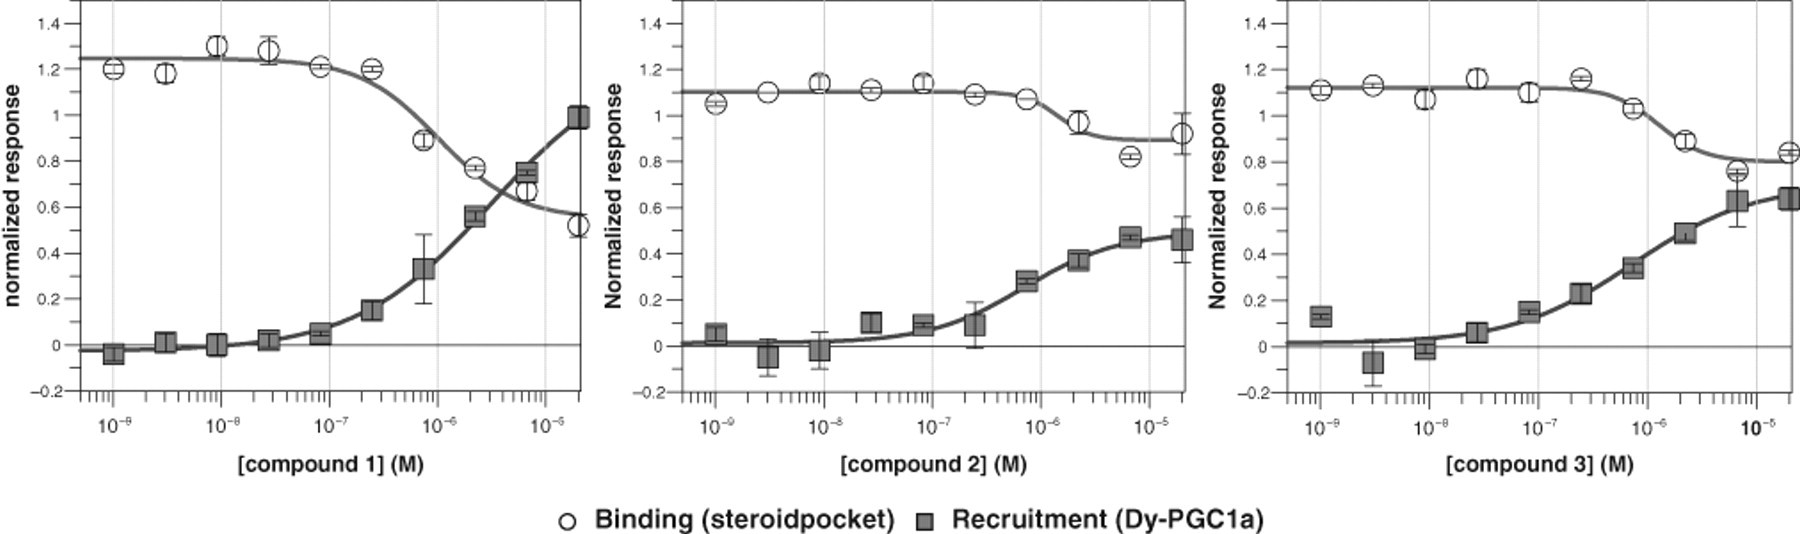
Dose-response analysis of 3 hits from the validation high-throughput screening (HTS) in the dual hERα time-resolved fluorescence energy transfer (TR-FRET) assay with unusual recruitment pattern. The assay and the data normalization were performed as described in Materials and Methods. Data represent mean ± SD of quadruplicate data points.
Conclusions
The multiplex assay developed for hERα is a powerful method to characterize compounds for their functionality in a cell-free system. Multiplex assays for NHRs so far have been described only for the simultaneous measurement of 2 different receptors 19 and for the differential recruitment of 2 different cofactor peptides. 20,21 Our assay addresses 2 different binding sites on one receptor: the steroid binding site and the cofactor recruitment site. The 2 fluorescent FRET acceptors, Fluormone-ES2™ and the Dy-PGC1a, exclusively bind to the hormone-free and the hormone-bound state of hERα, respectively. Addition of the agonist E2 results in displacement of the Fluormone-ES2™ and simultaneously in the recruitment of the Dy-PGC1a-peptide. Therefore, we can measure the binding to the steroid site by a signal decrease in the first channel and the recruitment of the peptide by a signal increase in the second channel.
Although we observed a certain crosstalk at high concentrations of the peptide influencing the Fluormone-ES2™ binding, the concentrations of the assay components in the optimized assay could be reduced, resulting in a level with less than 10% crosstalk. We also showed that the observed crosstalk is due to the binding of the peptide itself and not the fluorescence label, which is important for compound screening. The simultaneous measurement of binding to the steroid site and recruitment of a cofactor-peptide enables classification of agonists, partial agonists, antagonists, and compounds addressing the LXXLL peptide recruitment site. The assay proved to be highly sensitive, robust, and easy to perform in a miniaturized “mix-and-measure” HTS format. We have validated the assay with several known agonists and antagonists for hERα. Further miniaturization to the 1536-well format is most likely because there is only one dispensing step, and we routinely performed the assay in a miniaturized 5-µL format in 384-well small-volume plates. In our small-scale validation screen using randomly chosen compound plates from our collection, we even identified structurally related compounds with an unexpected recruitment mode. These hits induced a robust peptide recruitment without binding to the steroid site. To our knowledge, this has not been described in the literature before. The principle of our dual hERα assay could be easily applied to other NHRs, given the similarity of the 3-dimensional structures of the ligand binding domains within the NHR family and the availability of purified protein and fluorescent tracer molecules for the steroid binding sites.
Footnotes
Acknowledgements
The authors thank Dan Tran and Carola Tenner for compound logistics and providing the screening library as well as Dagmar Zeggert-Springer and Carmen Kropp-Goerkis for technical assistance. Furthermore, they thank Dr. Horst Irlbacher and Dr. Gernot Langer for helpful discussions and critical reflection of experimental data. A special thanks to Prof. Dr. Volker A. Erdmann (Institute of Biochemistry, Freie Universität Berlin) for kind support.