
Abstract
A multiplexed cell assay has been optimized to measure the activities of fatty acyl-CoA elongase, delta-5 desaturase (Δ5D), delta-6 desaturase (Δ6D), and delta-9 desaturase (Δ9D) together using 14C-labeled tracers in HepG2 cells, which express the human stearoyl-CoA desaturase-1 isoform (SCD1) exclusively. The Δ5 and Δ9 desaturase activities are indexed by the efficient conversion of [1-14C]-eicosatrienoic acid (C20:3, cis-8,11,14) to 14C-arachidonic acid (C20:4, cis-5,8,11,14) and the conversion of [1-14C]-stearic acid to 14C-oleic acid (C18:1, cis-9), respectively. CP-74006 potently blocks the Δ5D activity with an IC50 value of 20 nM and simplifies the metabolism of [1-14C]-α-linolenate (C18:3, cis-9,12,15) by accumulating 14C-eicosatetraenoic acid (C20:4, cis-8,11,14,17) as the major 14C-eicosatrienoic acid (C20:3, cis-11,14,17) and 14C-docosatetraenoic acid (C22:4, cis-10,13,16,19) as the minor metabolites through Δ6 desaturation and elongation. This simplified metabolite spectrum enables the delineation of the Δ6D activity by comparing the combined Δ6D/elongase activity index of the 14C-(C20:4/C18:3) ratio with the corresponding elongation index of the 14C-(C20:3/C18:3) ratio following compound treatment. SC-26196 and sterculic acid specifically inhibit the Δ6D and Δ9D activities with an IC50 value of 0.1 µM and 0.9 µM, respectively. This medium-throughput cell assay provides an efficient tool in the identification of specific desaturase and elongase inhibitors.
Keywords
Introduction
T
Deregulation of LCFA-CoA metabolism has been implicated in a number of chronic disorders, including obesity, cardiovascular diseases, type 2 diabetes, and several forms of cancer. Correcting the LCFA-CoA composition imbalance via pharmacological modulation of Δ5D, Δ6D, Δ9D, or elongase activities may have diverse therapeutic potentials. For example, overproduction of arachidonic acid–derived eicosanoids from Δ5D- and Δ6D-mediated desaturation and elongation of linoleic acid appears to play a detrimental role in the development of inflammatory and autoimmune disorders. Polymorphisms of Δ5D and Δ6D are associated with an altered arachidonic acid–mediated signaling, with some single-nucleotide polymorphism (SNP) carriers having a lower prevalence of allergic rhinitis and atopic eczema. 6,7 Some diabetic patients have a reduced Δ5 desaturase activity, and this is normally corrected by insulin treatment. 8 Elevated SCD activity is associated with insulin resistance, hypertriglyceridemia, liver steatosis, atherosclerosis from hypoxia in sleep apnea, and increased cancer risk in obese subjects. 9-11 Model studies have revealed that reducing the arachidonic acid oversupply via Δ5D or Δ6D inhibition mitigates the excessive airway inflammation and impedes intestinal tumor genesis. 12,13 It has been shown that SCD1 deficiency from treatment with antisense oligonucleotide, sterculic acid, or other SCD1 inhibitors attenuates hypoxia-induced dyslipidemia and atherosclerosis, decreases carcinoma development, 14 reduces diet-induced obesity and steatosis, and improves insulin sensitivity. 11,15-17 Furthermore, elongase deficiency from Elov16 deletion protects mice from fatty liver–induced insulin resistance. 18
To facilitate the identification of desaturase and elongase inhibitors for therapeutic evaluation, we have optimized a multiplexed cellular assay using 14C-tracers to measure the desaturase and elongase activity simultaneously. The human hepatoma HepG2 cell line was chosen because of its known high desaturase and elongase activities, as well as resemblance to many features of primary hepatocytes, including lipid synthesis, lipoprotein synthesis, assembly, and secretion. 19 This multiplexed cellular assay provides a convenient platform for the study of lipid metabolism.
Materials and Methods
HepG2 cells were obtained from American Type Culture Collection (ATCC, Rockville, MD). [1-14C] stearic acid (56 mCi/mmole, C18:0), [1-14C]-eicosatrienoic acid (56 mCi/mmole, C20:3, cis-8,11,14), and [1-14C] α-linolenic acid (56 mCi/mmole, C18:3, cis-9,12,15) were from American Radiolabeled Chemicals, Inc. (St. Louis, MO). The Δ5D inhibitor CP-74006 and Δ6D inhibitor SC-26196 were prepared according to published procedures. 12 Sterculic acid (8-(2-octyl-1-cyclopropenyl) octanoic acid) was purchased from QSchem (www.qschem.com). Compound A is an orally active SCD inhibitor with potent antiobesity efficacy in the high-fat diet-induced obese mouse model. 20 Other chemicals were of analytical grade from Sigma/Aldrich.
Cell culture, lipid extraction, and analysis
HepG2 cells were maintained as monolayer culture in minimum essential medium (MEM) supplemented with 10% fetal bovine serum, 1% sodium pyruvate, 1% nonessential amino acids, penicillin (10,000 units/mL), and streptomycin (10,000 µg/mL) under a humidified atmosphere of 95% O2/5% CO2 at 37 °C. The medium was replaced every third day. Fresh cultures were initiated twice per week by trypsinization after the cells reached ~80% confluency with a 3 to 1 dilution ratio.
The assay was initially developed in the 48-well plate for increased sensitivity at characterizing minor metabolites and further adapted to the 96-well plate format for higher capacity. In the 96-well plate-based screening mode, HepG2 cells at 0.3 million/mL were plated at 0.2 mL per well. After 2 days, the near-confluent cells were incubated with compounds (via 1 µL DMSO as vehicle) and 90 µL of fresh medium for 15 min. [1-14C]-stearic acid, [1-14C]-eicosatrienoic acid, or [1-14C]-α-linolenic acid was added via 10 µL of medium to a final concentration of 0.1 µCi/mL either separately or in combination. After 4 h, the radioactive medium was removed by placing the well plate upside down on a paper towel. Cells were washed 3 times with 0.2 mL phosphate-buffered saline (PBS) following the same procedure to remove residual medium and saponified with 0.1 mL of sodium hydroxide (2 N) at 65 °C for 1 h. To ensure the recovery of minor metabolites from [1-14C]-α-linolenic acid, we added 10 µg of L-α-phosphatidylcholine as the cold carrier. After acidification with phosphoric acid (20 µL), the suspension was solubilized with 130 µL acetonitrile and centrifuged at 4000 g for 15 min at 4 °C. The resulting supernatant was analyzed on a high-performance liquid chromatography (HPLC) system equipped with a radioactivity detector (Packard, Pangbourne, UK) and a reverse-phase column (Zobax Extend-C18, Agilent, Santa Clara, CA) using a 10% water (0.1% formic acid)/90% acetonitrile (0.1% formic acid) to 100% acetonitrile (0.1% formic acid) gradient. To detect the minor metabolites from [1-14C]-α-linolenic acid, we carried out the assay in the 48-well plate by plating 0.8 mL of HepG2 cells at 0.3 million/mL into each well. The incubation medium was increased to 500 µL/well. The labeled cells were washed 3 times with 1 mL of PBS and hydrolyzed using 200 µL of NaOH (2N). The resulting sample after transferring into a 96-well plate was processed accordingly as in the 96-well plate condition.
RNA extraction and quantitative real-time PCR analysis
RNA was extracted from HepG2 cells using Trizol reagent from Invitrogen (Carlsbad, CA). Human SCD1 and SCD5 transcript levels were measured via quantitative PCR analysis and normalized against human SCD1 and SCD5 plasmid DNA standards. The forward and reverse primers were 5′-GTCCTGCAGAATGGAGGAGATAAG-3′ and 5′-CGAATGTCGTCTTCCAAGTAGA-3′ for SCD1 and 5′- CGCTATACCATCTCACTCAACATCA-3′ and 5′-GGCCGGTTTCCATACATGTG-3′ for SCD5. The probes were 5′-FAM-TGGAGACGATGCCC-BHQ1-3′ for SCD1 and 5′-FAM-CTGGTCAACAGCGCC-BHQ1-3′ for SCD5. The transcript levels in HepG2 cells were at 0.65 ± 0.15 (n = 4) ng/µg of total RNA for SCD1 and below detection for SCD5 (<0.0003 ng/µg total RNA).
Mass spectrometry analysis
The metabolites after incubating [U-13C]-α-linolenate with HepG2 cells for 4 h in a 48-well plate were analyzed by liquid chromatography/mass spectrometry (LC/MS). The HPLC–ESI (electrospray ionization)–MS/MS system consisted of a Waters-2790 Alliance HT coupled with a Quattro Ultima triple quadrupole mass spectrometer (Manchester, England) equipped with an electrospray source. The column was an X-Terra® MS C8 (2.5 µm, 4.6 × 50 mm) from Waters (Watford, UK). The mobile phase at a flow rate of 0.1 mL/min was composed of acetonitrile in 0.1% formic acid (eluant A) and water in 0.1% formic acid (eluant B) with a gradient from 50% to 95% eluant A in 25 min, followed by a 3-min equilibration period at 95% eluant A. The injection volume was 10 µL. The Quattro was operated in ESI negative mode with the capillary voltage at −3.35 kV, the cone at −50 V, the extractor at −1 V, the source temperature at 120 °C, the desolvatation temperature at 350 °C, the desolvatation flow at 458 L/h, and the nebulizer at 21 L/h, and data were acquired in SIM mode.
Data analysis
The 14C-labeled product/substrate-precursor tracer ratio from each sample was used as the respective desaturase or elongase activity indice to minimize the impact of cell number variation among wells. Data are reported as the mean ± standard error from 3 to 5 independent measurements. IC50 values were estimated by fitting the dose-response curve with a 4-parameter nonlinear regression analysis routine.
Results
To establish a robust whole-cell assay capable of monitoring multiple desaturase and elongase activities simultaneously for compound screening, we took advantage of the known high desaturase expression in HepG2 cells, the noninvasive method, and the high sensitivity of radioactive tracer–based methodology for metabolite mapping. To simplify the metabolite spectrum, the 14C-isotope tag was positioned at carbon 1 for all tracers that silence chain-shortened metabolites generated from the loss of this carbon. Prior studies have identified the presence of abundant Δ5, Δ6, and Δ9 desaturase and elongase activities in HepG2 cells. 1,21,22 Of the two Δ9-specific desaturase isoforms in humans, 23 our quantitative PCR analysis uncovered that only hSCD1 was expressed at ~0.6 ng/µg of the total RNA. The other isoform, hSCD5, was below the detection limit of <0.0003 ng/µg total RNA, demonstrating hSCD1 is the sole contributor to the Δ9 desaturase activity in HepG2 cells.
To monitor the SCD1 activity, we followed the desaturation of [1-14C]-stearic acid (C18:0) to 14C-oleic acid (C18:1, cis-9). 1,24 14C-stearoyl-CoA, formed via activation and thio-acylation of the tracer, is the preferred substrate of SCD1 in oleoyl-CoA formation and its subsequent esterification into lipids, as outlined in Figure 1 . 22,25 Briefly, cells after feeding with 14C-stearic acid up to 24 h were saponified with a sodium hydroxide solution, and the resulting 14C-metabolites from the cellular lipid pool were quantified by HPLC. Time course analysis revealed that 14C-stearic acid uptake into cells is nearly linear up to 6 h and dose proportional from 0.05 to 0.2 µCi/mL (0.9-3.6 µM) tested, judging from the radioactivity remained in culture medium ( Fig. 2A ). More than 85% of the 14C-radioactivity in cells was distributed between the Δ9D-derived oleic acid and stearic acid. The 14C-oleic acid/(14C-stearic acid + 14C-oleic acid) ratio, a Δ9D activity index, reached the plateau value of ~45% by 30 min independent of the tracer concentration ( Fig. 2B ). This kinetic feature implies that the desaturation of 14C-stearoly-CoA to oleoyl-CoA by SCD1 is not the rate-limiting step in route of the 14C-oleoyl-containing lipid formation from 14C-stearic acid. Within 6 h, less than 5% of the 14C-metabolites in culture medium or in cells comigrated with acetate-, palmitate-, or palmitoleate-like species, suggesting a minimal occurrence of β-oxidation or 14C-carbon-1 recycling events from tracer breakdown. The cellular radioactivity starts to decline post 8 h, yielding a complex metabolite profile by 24 h. HPLC analysis suggested that they were from further metabolism of 14C-stearate and 14C-oleate. Therefore, for compound testing, the 14C-stearic acid tracing time was limited to 4 h at the concentration of 0.1 µCi/mL. To increase the robustness of data analysis, we used the internal 14C-oleate/(stearate + oleic acid) ratio of each sample as the Δ9D activity index to minimize the impact of cell number variations amongst wells. Figure 3A shows the dose titration of the SCD activity index by compound A, a novel SCD inhibitor with an intrinsic potency of 0.1 µM at inhibiting the SCD activity of rat liver microsome ( Table 1 ). Compound A potently inhibited the cellular SCD activity of HepG2 cells with an IC50 value of 0.3 µM. Figure 3B compares the SCD activity indices of DMSO-treated 8 samples on the same 96-well plate with compound A–treated 8 samples located on 4 separate plates (at the dose of 20 µM with duplicate on each plate). The illustrated reproducibility within and across plates leads to a high Z′ factor of 0.8. A similar Z′ factor of 0.7 was obtained among samples located on the same 96-well plate. This assay is highly reproducible, and the IC50 values of compounds typically varied within 25% when they were retested on different days. Sterculic acid, a cyclopropenoid-based Δ9D inhibitor from the cotton seed, 26,27 dose-dependently inhibited the cellular Δ9D activity with an IC50 value of 0.9 µM, which is comparable to its EC50 of 0.25 µM by following D3-stearic acid metabolism via LC/MS detection in HepG2 cells. 28
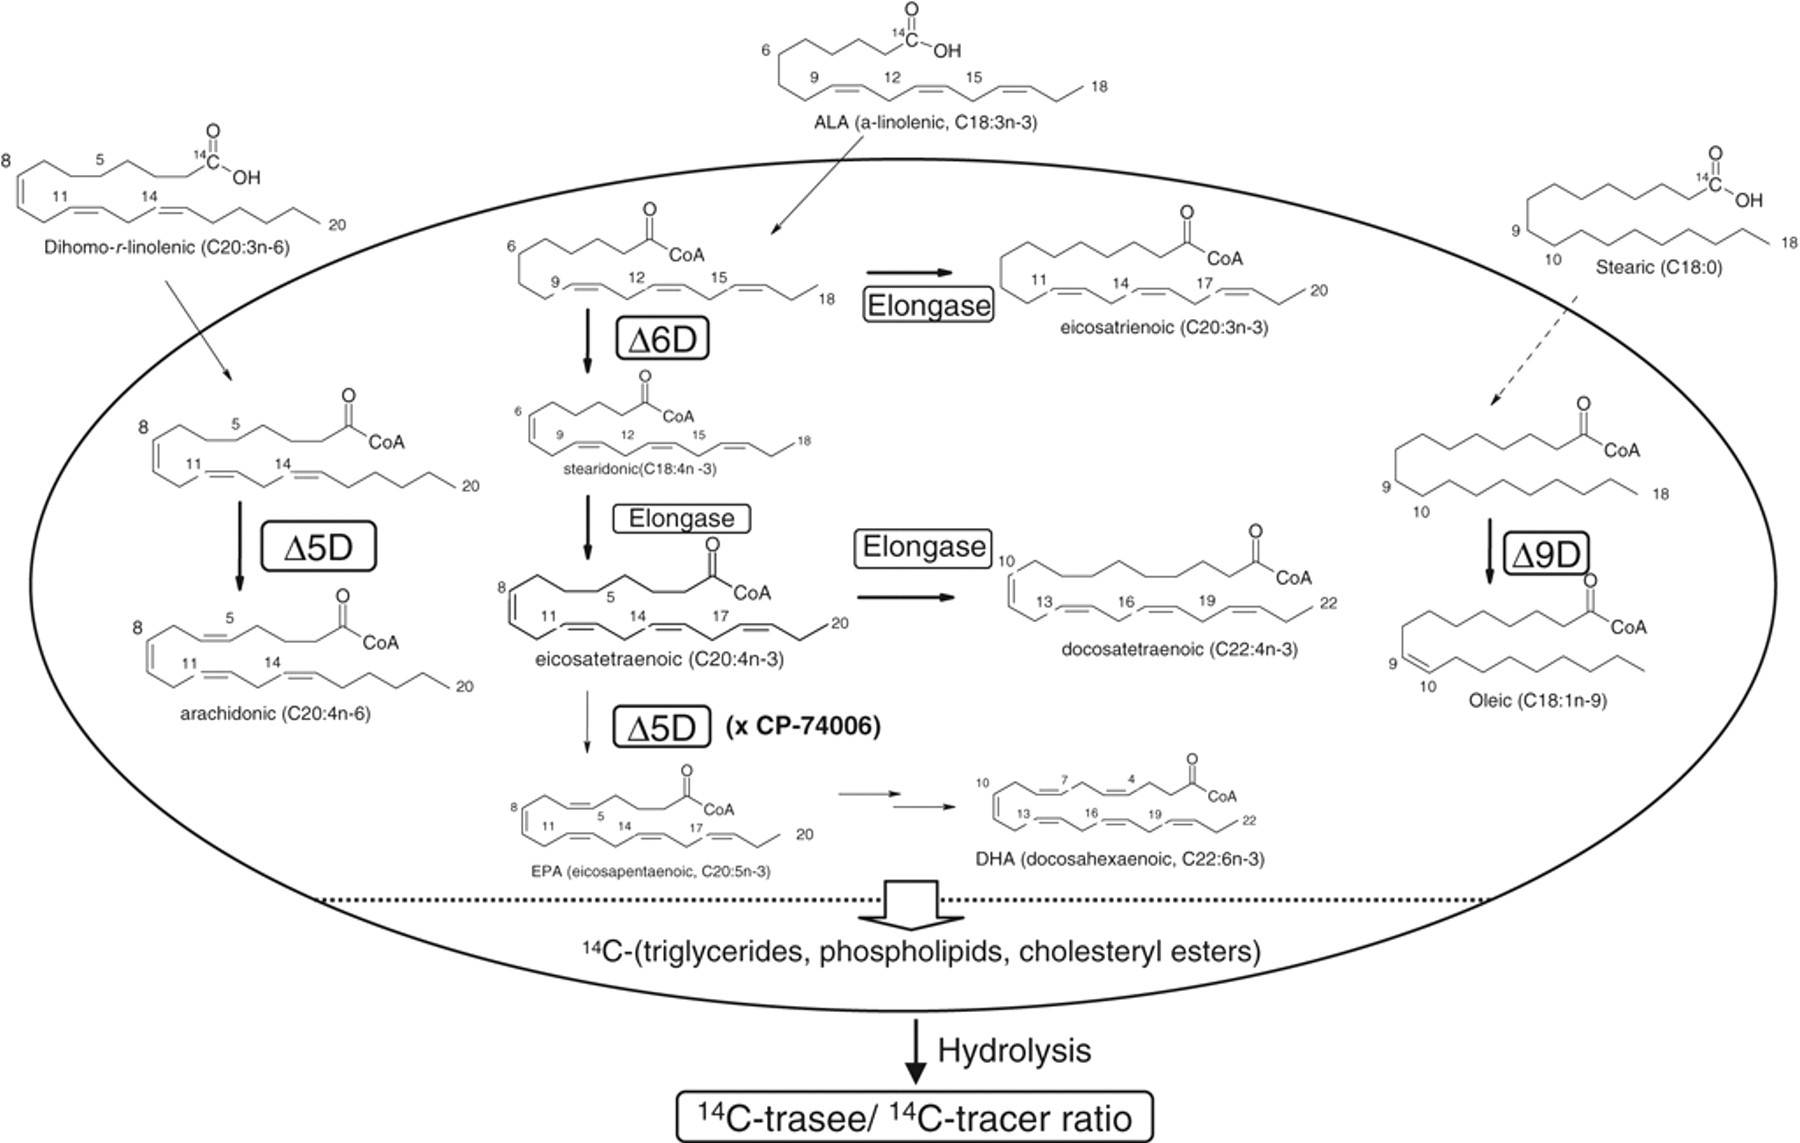
Tracer-based Δ5D, Δ6D, Δ9D (SCD), and elongase activity detection in HepG2 cells. The major 14C-metabolites from [1-14C]-substrate precursor tracers in HepG2 cells under the optimized conditions are shown here. Arachidonic acid (C20:4, cis-5,8,11,14) is the main metabolite of 14C-eicosatrienoic acid (C20:3, cis-8,11,14, dihomo-γ-linolenic acid) via Δ5D-catalyzed desaturation. Oleic acid (C18:1, cis-9) is the main metabolite of 14C-stearic acid (C18:0) via Δ9D-catalyzed desaturation. Depleting the Δ5D activity by CP-74006 simplifies the metabolism of 14C-α-linolenic acid (ALA, C18:3, cis-9,12,15), leading to the accumulation of eicosatrienoic acid (C20:3n-3, minor), eicosatetraenoic acid (C20:4n-3, major), and docosatetraenoic acid (C22:4n-3, minor), with the Δ6D-derived metabolite stearidonic acid (C18:4n-3) being a negligible component (<5%). The assay robustness is increased by the ratiometric analysis of the metabolites/tracer ratio within each sample.
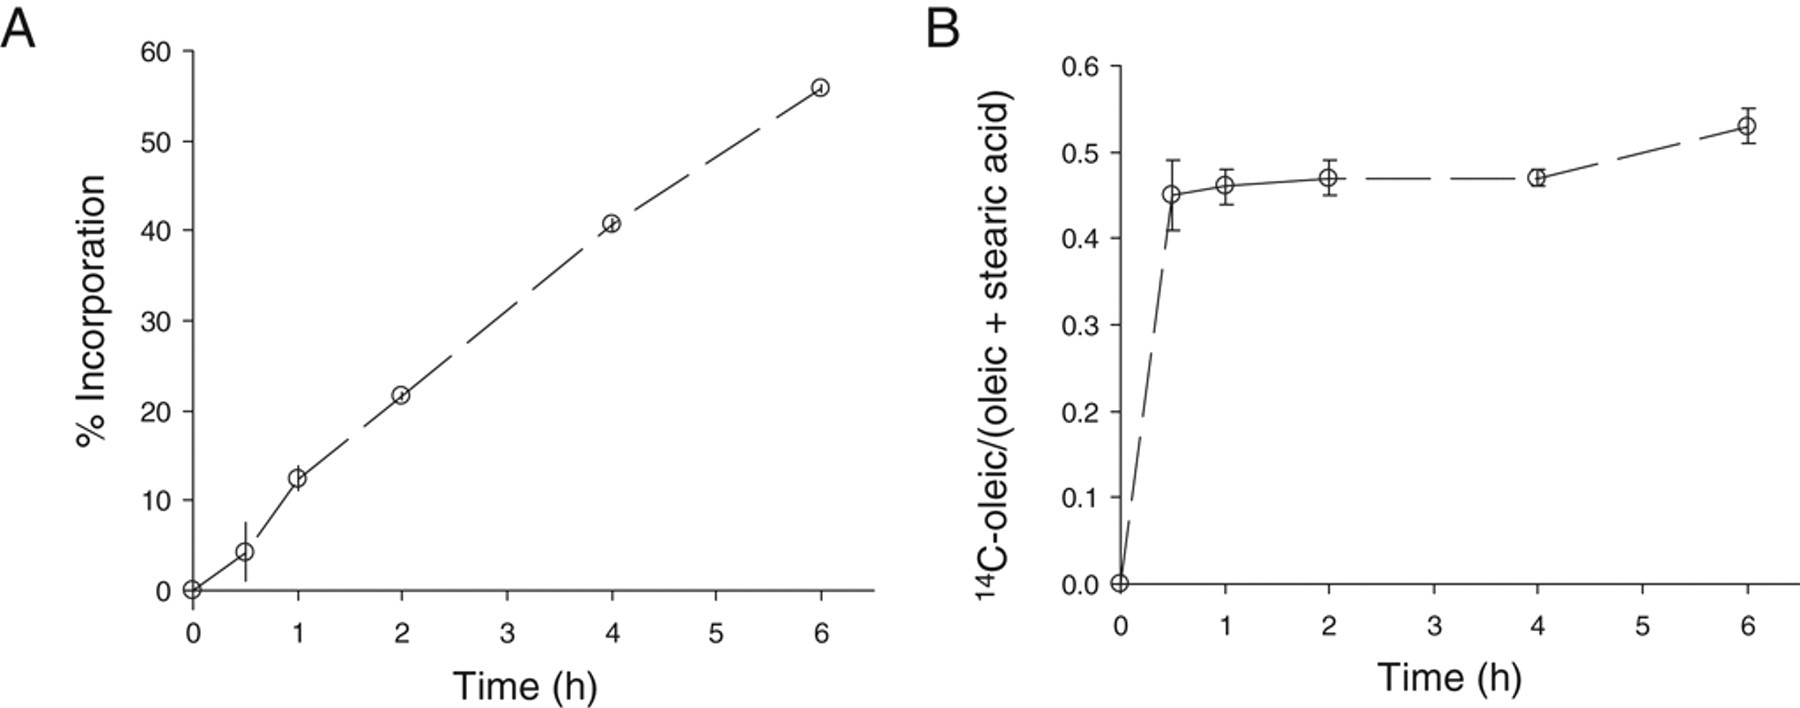
Time course of 14C-stearic acid uptake and metabolism in HepG2 cells. [1-14C]-stearic acid (0.1 µCi/mL, 0.9 µM) was incubated with HepG2 cells at 37 °C in a 48-well plate. (
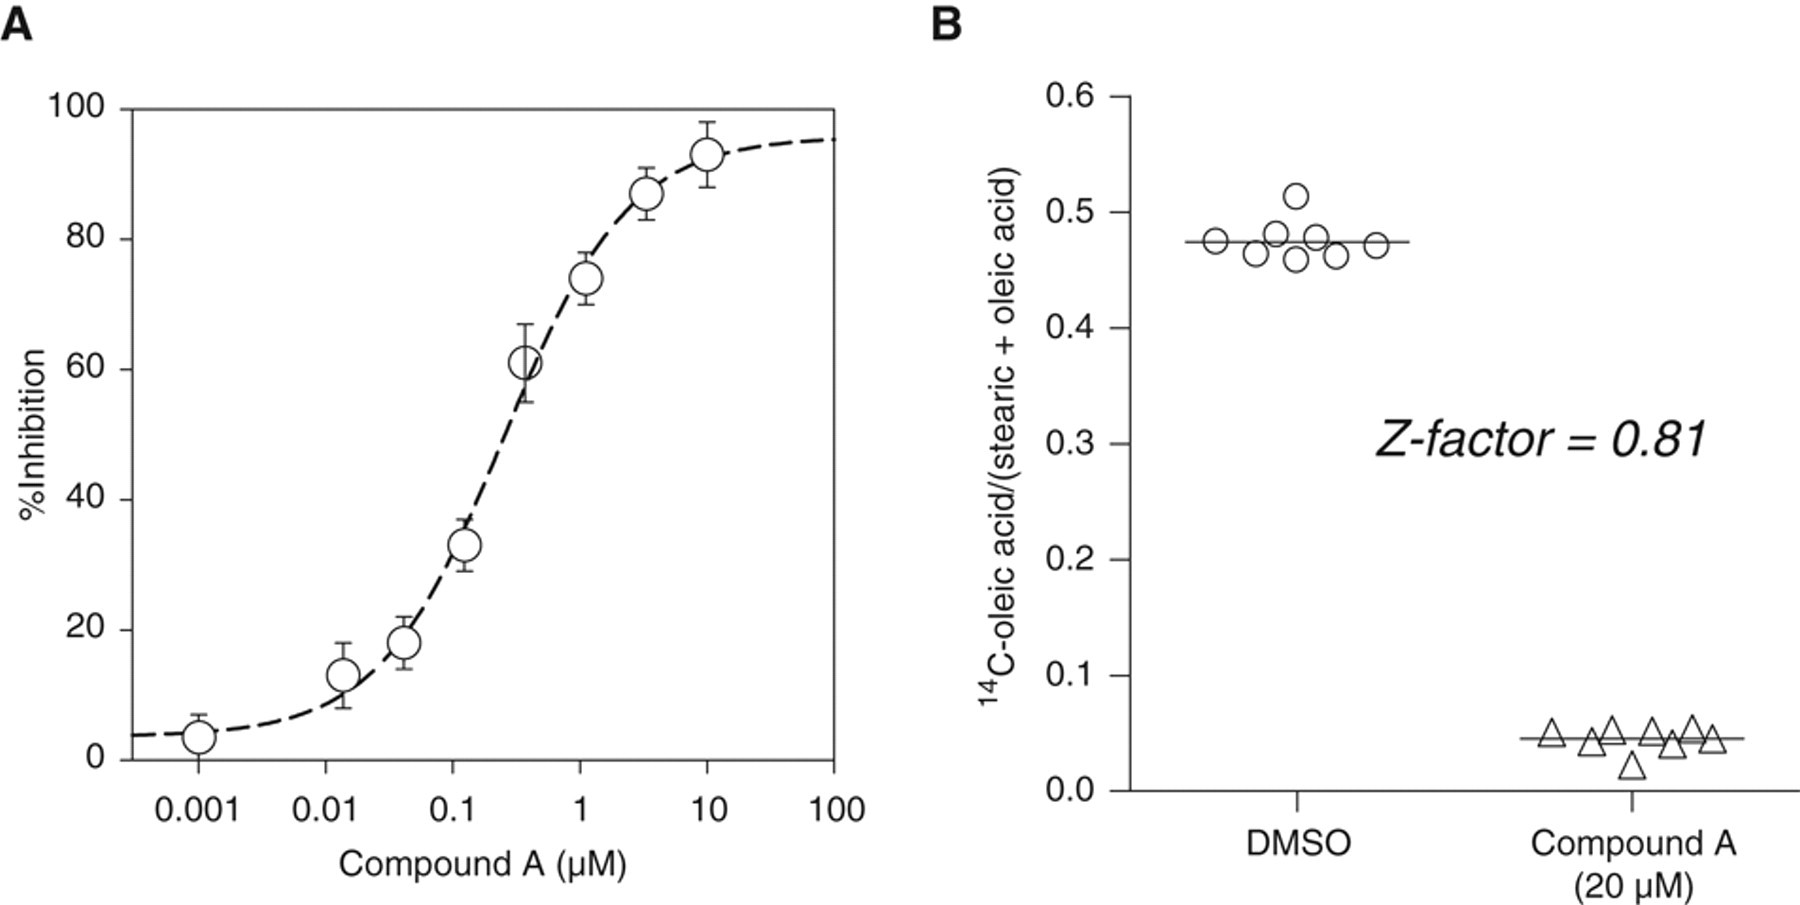
Titration of a specific stearoyl-CoA desaturase (SCD) inhibitor (compound A) in the SCD cell assay. (
Comparison of Cell Potencies with Enzyme Potencies of Desaturase Inhibitors
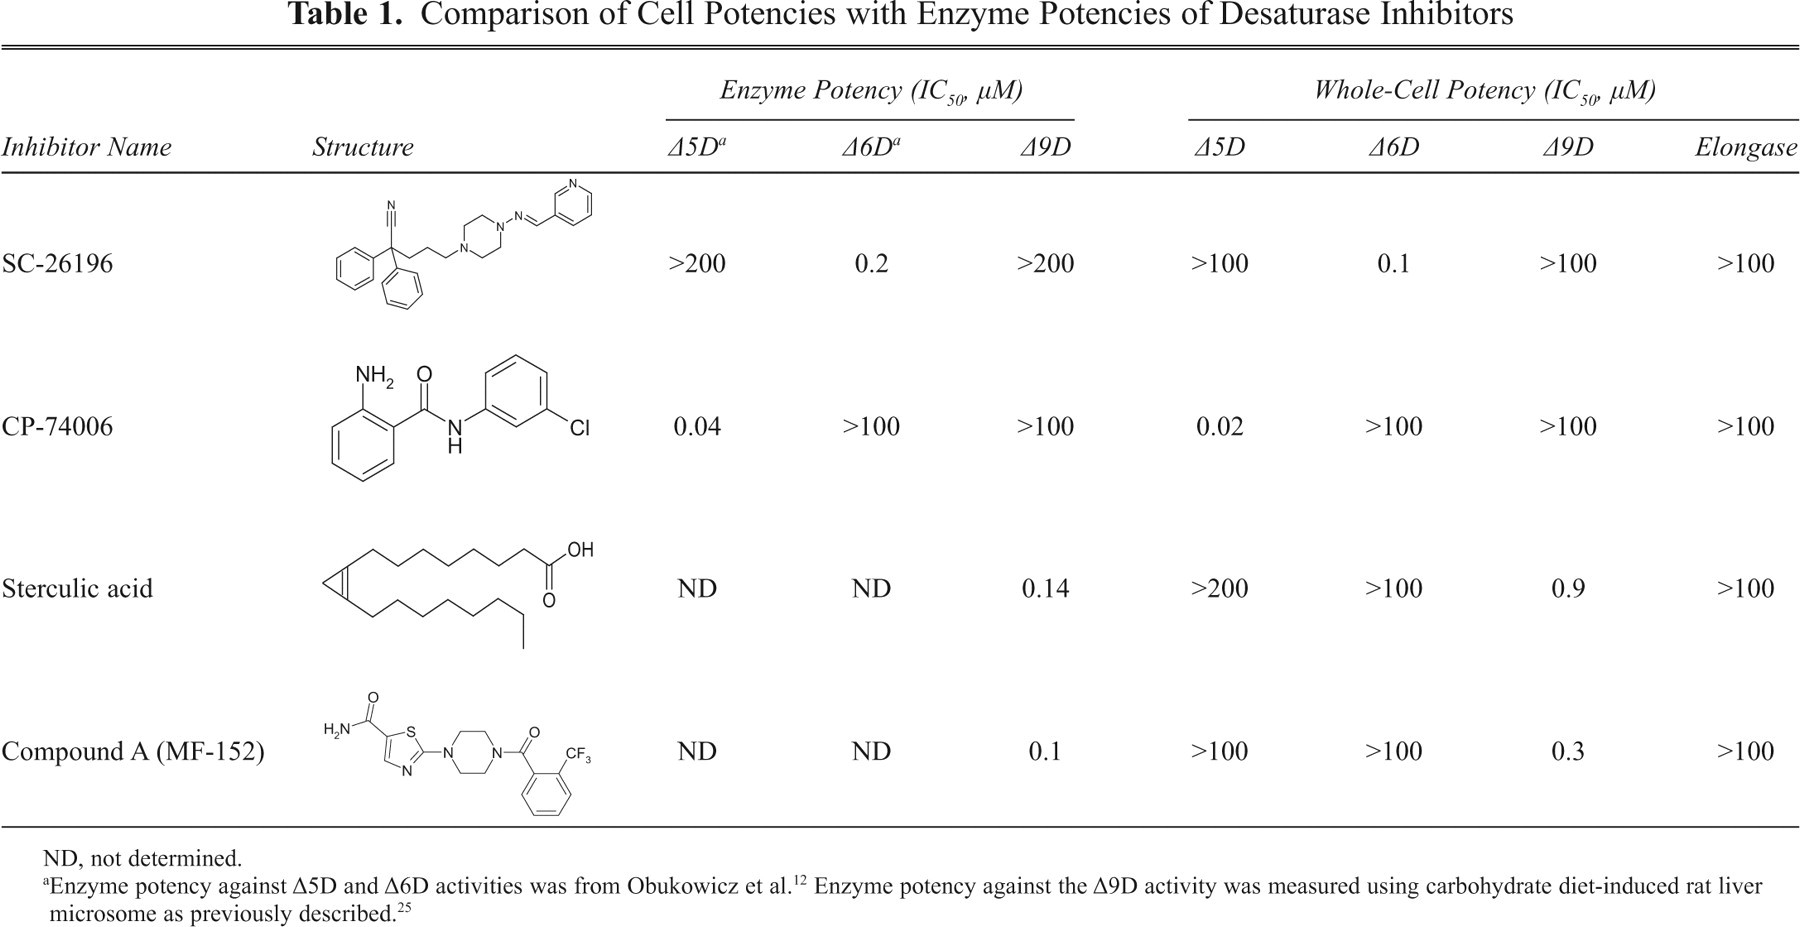
ND, not determined.
To monitor the Δ5D activity in HepG2 cells, we traced the metabolism of [1-14C]-eicosatrienoic acid (C20:3, cis-8,11,14) as in ABMC-7 cells. 29 Comparable to that traced from 14C-stearic acid, the cellular uptake of 14C-eicosatrienoic acid was linear up to 6 h within 0.05 to 0.2 µCi/mL (0.9-3.6 µM) tested, with the Δ5D-derived 14C-arachidonic acid (C20:4, cis-5,8,11,14) being the dominant metabolite (>80%) in cell lipids within this duration. The resulting 14C-arachidonic acid/(14C-eicosatrienoic acid + 14C-arachidonic acid) ratio, a Δ5D-activity index, rapidly reached a plateau value of 20% to 25% within 30 min, consistent with the observation that Δ5D-catalyzed desaturation is not the rate-limiting step in the formation of arachidonyl-lipid from the tracer. A complex 14C-metabolites spectrum emerged post 8 h, with their elution patterns on HPLC resembling those known metabolites from further elongation and desaturation in HepG2 cells. 1 Thus, the tracing time for monitoring Δ5D activity was also limited to 4 h for compound testing. Because 14C-stearic acid, eicosatrienoic acid, oleic acid, and arachidonic acid were well separated on HPLC, the Δ5D and Δ9D activity assays were typically conducted in combination with the use of both tracers, as illustrated in Figure 4 . CP-74006, a Δ5D inhibitor with an in vitro IC50 of 40 nM, 12 inhibited the formation of 14C-arachidonic acid in HepG2 cells with an IC50 value of 20 nM without affecting the Δ9D-derived oleic acid formation, confirming its Δ5D specificity. A similar IC50 value of 0.9 µM was obtained for sterculic acid at inhibiting the SCD activity under the dual tracing condition, indicating that the fatty acid metabolism circuits were minimally perturbed by the presence of both tracers.
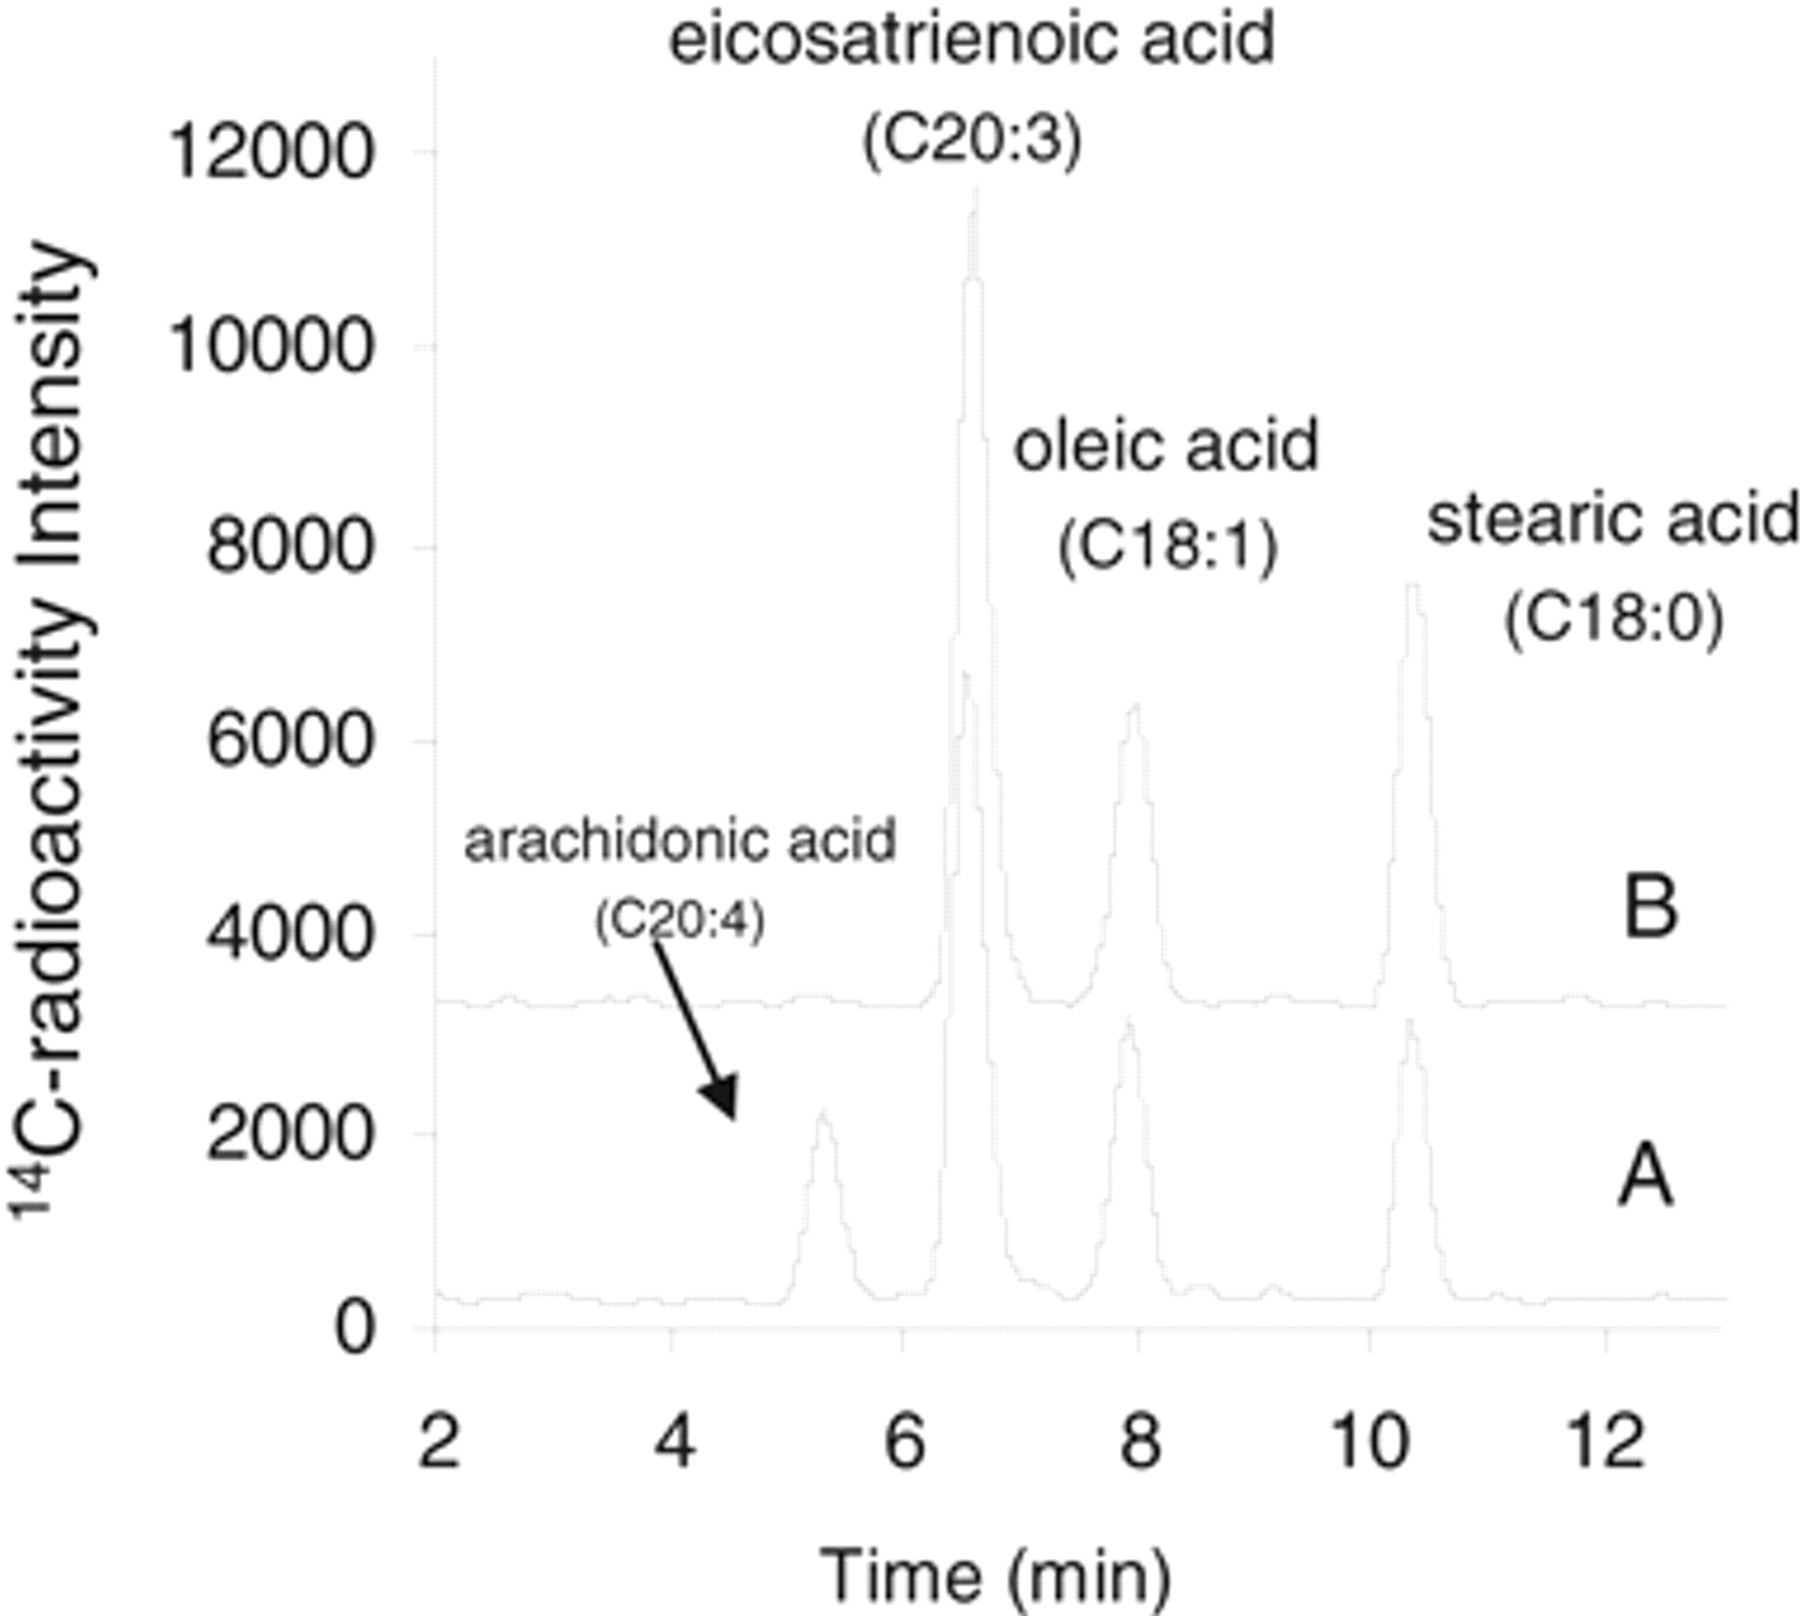
Specific Δ5D inhibition by CP-74006 in the dual Δ5D and Δ9D assay. 14C-metabolites profile on high-performance liquid chromatography (HPLC) from 14C-stearic acid (0.1 µCi/mL) plus 14C-eicosatrienoic acid (0.1 µCi/mL) dual tracing in HepG2 cells. Trace A shows the near-exclusive formation of 14C-oleic acid from 14C-stearic acid and the formation of 14C-arachidonic acid (C20:4) from 14C-eicosatrienoic acid (C20:3) within 4 h. Trace B shows 20 µM CP-74006 selectively inhibited 14C-arachidonic acid formation without affecting the Δ9D-derived 14C-oleic acid formation. The data were from an assay conducted in a 48-well plate. Similar results were obtained in the 96-well plate format.
To monitor the cellular Δ6D activity, we traced the metabolism of [1-14C] α-linolenic acid (ALA, C18:3, cis-9,12,15) to docosahexaenoic acid (DHA, C22:6, cis-4,7,10,13,16,19). A comparison of 2 substrate precursors showed that the metabolism of 14C-α-linolenic acid was 2- to 3-fold higher in HepG2 cells, as opposed to that of 14C-linoleic acid (C18:2, cis-9,12; results not shown). Even within 6 h, complex metabolites were formed, including stearidonic acid (SDA, C18:4, cis-6,9,12,15) and eicosatrienoic acid (C20:3, cis-11,14,17) from Δ6 desaturation and elongation of the C18:3 tracer, respectively; eicosatetraenoic acid (ETA, C20:4, cis-8,11,14,17) from stearidonic acid elongation; eicosapentaenoic acid (EPA, C20:5, cis-5,8,11,14,17) from Δ5 desaturation of ETA (C20:4); and some docosatetraenoic acid (C22:4) and docosahexaenoic acid (DHA, C22:6) from multiple desaturation and elongation, as outlined in Figure 1 . Among them, the Δ6D/elongase/Δ5D-derived EPA (C20:5 n-3) was the most abundant species (~20%). This complex spectrum plus the weak signal of each species severely compromised the quantification ability in delineating the specific desaturation and elongation steps. To simplify the metabolite spectrum and enhance the indexing of the Δ6D-mediated steps, we inhibited the extensive Δ5D-catalyzed desaturation of C20:4 to C20:5 by the addition of CP-74006 (20 µM). Under the Δ5D-depleted condition at 4 h, the Δ6 desaturation plus elongation-derived 14C-ETA (C20:4) accumulated to become the major species (~50% of the total) with ~40% 14C-C18:3 remaining. Two elongation-derived metabolites, 14C-C20:3 from the tracer and 14C-C22:4 from the major C20:4 metabolite, also accumulated to 4% to 5% under the present condition. This simplified α-linolenate metabolism allowed the comparison of the combined Δ6D/elongase index (14C-C20:4/C18:3 ratio) with the corresponding elongation index (14C-C20:3/C18:3), thus enabling the delineation of the Δ6D activity index alone following compound treatment.
This mixed Δ6D/elongase assay is readily combined with the Δ9D activity assay with the use of both tracers. Figure 5 (trace A) illustrates the levels of corresponding metabolites from both tracers in this combination format. Depleting the Δ6D activity with 100 µM SC-26196, a Δ6D inhibitor that blocked PUFA metabolism in several human cells 30 completely inhibited the formation of 14C-C20:4 and its elongated C22:4 from 14C-C18:3, without affecting oleic acid formation or the elongation of 14C-C18:3 to C20:3, demonstrating its specificity on Δ6D over Δ9D or elongase ( Fig. 5 , trace B). Sterculic acid (100 µM) completely suppressed oleic acid formation without altering the multiple metabolite formation from 14C-α-linolenate ( Fig. 5 , trace C), demonstrating its specificity against Δ9D over Δ6D and elongase. It is unclear if the elongase Elov15 is a major contributor in HepG2 cells as in liver. 31
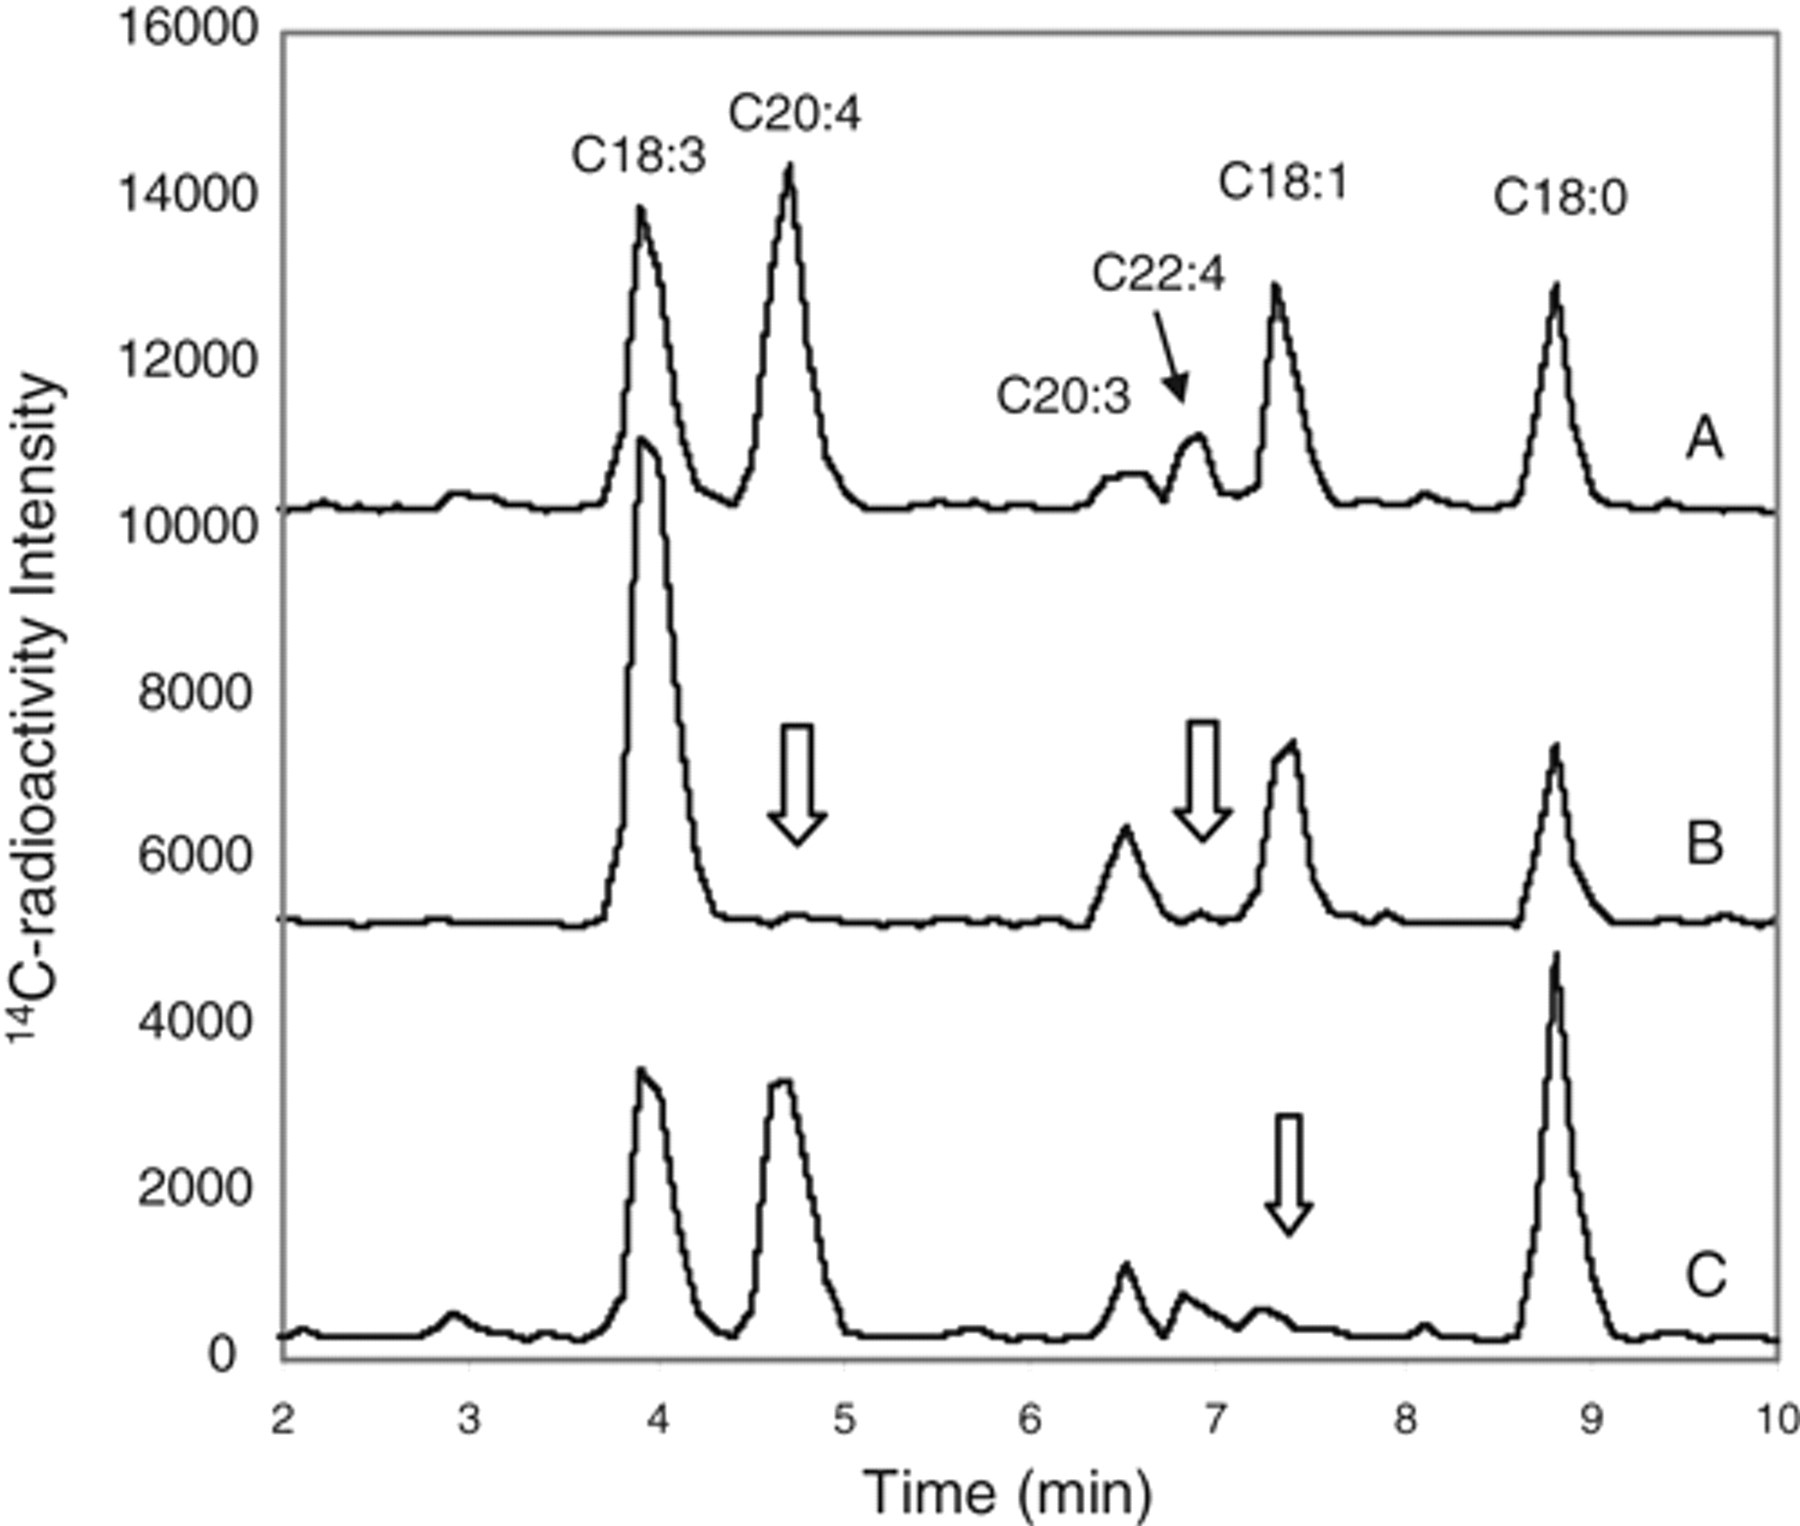
14C-stearic acid and 14C-α-linolenic acid metabolism under Δ5D-depleted condition in HepG2 cells. 14C-metabolite profile on the high-performance liquid chromatography (HPLC) system after tracing with [1-14C]-stearic acid (C18:0, 0.1 µCi/mL) and [1-14C]-α-linolenate (C18:3, 0.1 µCi/mL) in the presence of 20 µM of CP-74006 in a 48-well plate at 4 h. Trace B and trace C were displayed with an offset of 5000 and 10,000 units, respectively, for a clearer illustration. Under the Δ5D-depleted condition, 14C-oleic acid (C18:1) from 14C-stearic acid and 14C-C20:4, C20:3, and C22:4 from 14C-C18:3 were the major metabolites detected (trace A). The Δ6D inhibitor SC-26196 (100 µM) selectively inhibited the formation of C20:4 plus C22:4 (as marked by arrows in trace B) without affecting the elongation of C18:3 to C20:3 or Δ9D-derived oleic acid formation. Sterculic acid (100 µM) selectively inhibited the Δ9D-derived oleic acid formation as marked by the arrow in trace C without affecting the metabolism of 14C-C18:3 to C20:4, C20:3, and C22:4 via Δ6 desaturation and elongation.
To verify the identities of these 14C-metabolites under the Δ5D-depleted condition, we analyzed the corresponding [U-13C]-metabolites formed from [U-13C]-α-linolenate (C18:3) by LC/MS ( Fig. 6 ). The expected [U-13C]-ETA (C20:4), eicosatrienoic acid (C20:3), and docosatetraenoic acid (C22:4) were indeed identified as the major and minor metabolites from [U-13C]-α-linolenate in the presence of CP-74006 (trace A). Treatment with SC-26196 inhibited the formation of [U-13C]-C20:4 and C22:4 as expected (trace B).
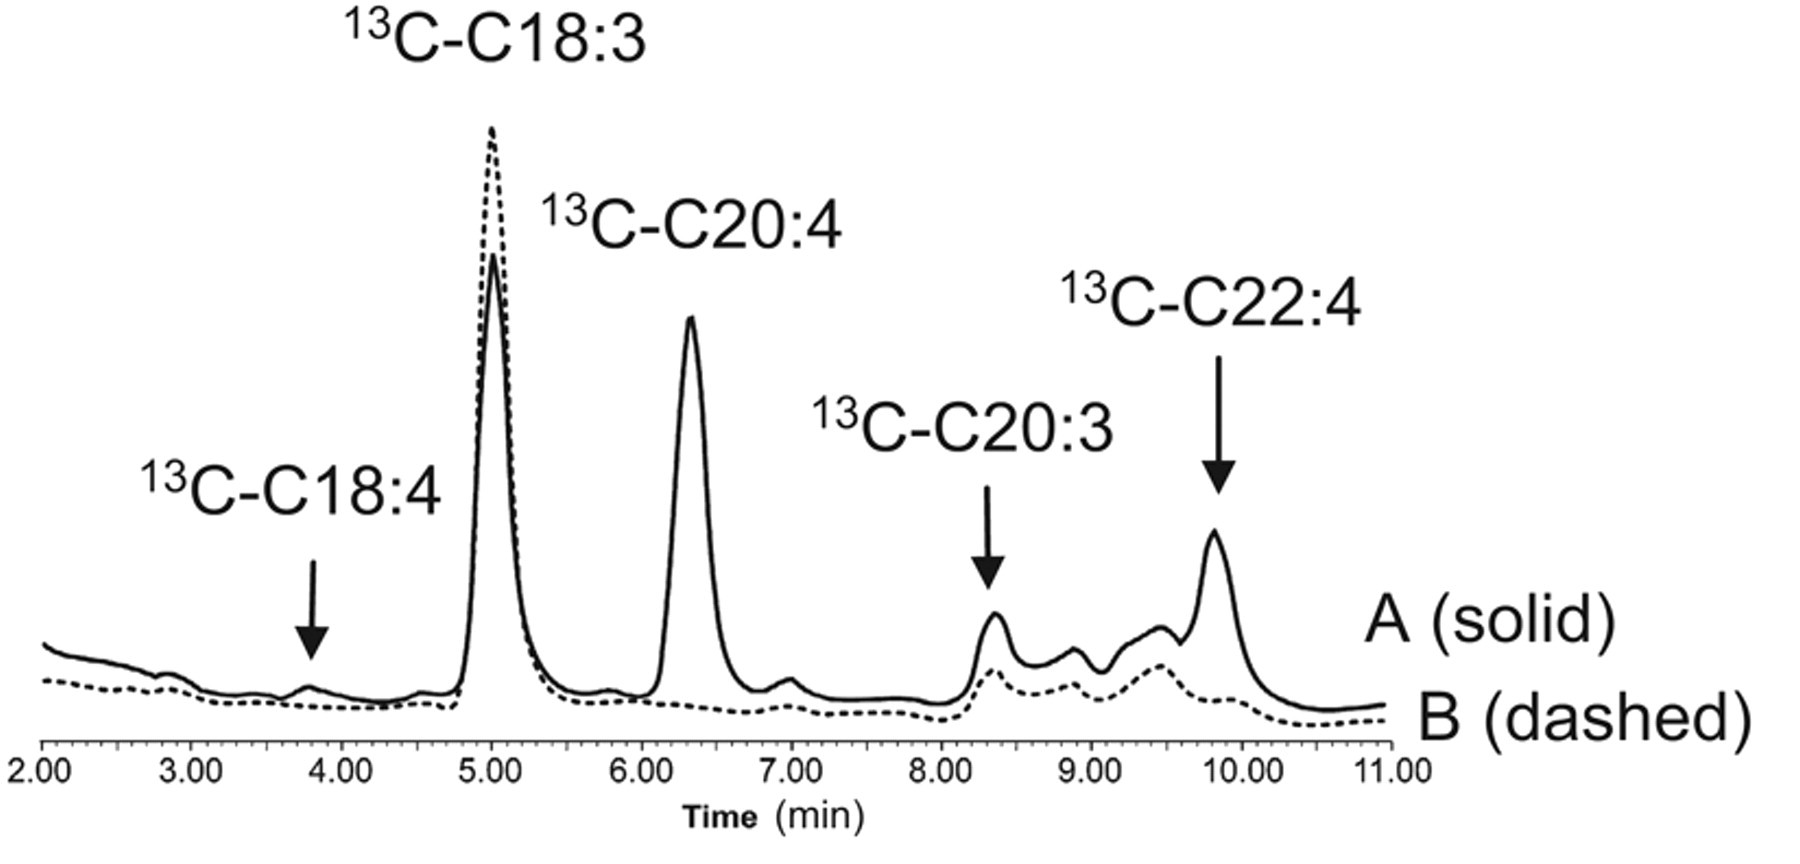
[U-13C]-α-linolenic acid metabolism under Δ5D-depleted condition in HepG2 cells analyzed by liquid chromatography/mass spectrometry (LC/MS) analysis. [U-13C]-metabolites formed at 4 h from using [U-13C]-α-linolenic acid (10 µM) as the tracer under Δ5D-depleted condition (20 µM CP-74006) in a 48-well plate. The metabolites were analyzed by LC/MS. Trace A (solid line) shows that [U-13C]-C20:4, [U-13C]-C20:3, and [U-13C]-C22:4 were the major metabolites detected from [U-13C]-α-linolenic acid (C18:3) under the condition. Trace B (dashed line) shows that the presence of SC-26196 (100 µM) selectively inhibited the formation of Δ6D-derived [U-13C]-C20:4, C22:4, and C18:4, without affecting the elongation-specific product [U-13C]-C20:3.
Table 1 summarizes the potency and specificity of these exemplified inhibitors against the 3 desaturases in HepG2 cells. CP-74006, SC-26196, sterculic acid, and compound A are specific Δ5D, Δ6D, and Δ9D inhibitors with no cross-reactivity toward the other desaturases, respectively. Their whole-cell potency correlated well with their in vitro enzyme potency against the Δ5D, Δ6D, and Δ9D activities of rat liver microsome, illustrating the effectiveness of this cell assay. The results also reveal that these compounds are cell permeable and stable under the assay condition. With the rate-limiting metabolite separation procedure conducted overnight, this assay has a capacity of four to six 96-well plates per HPLC instrument.
Discussion and Summary
Specific fatty acyl-CoA desaturase and elongase inhibitors are valuable tools in the study of fatty acid metabolism imbalance in disease states. The present study reports a multiplexed screening condition to measure the cellular Δ5D, Δ6D, Δ9D, and elongase activities by tracing the metabolism of 14C-labeled eicosatrienoic acid, α-linolenate, and stearic acid in HepG2 cells. In addition to an improved efficiency, this multiplexed format minimizes the need to counterscreen against the shared electron-supplying machinery of these desaturases for compounds that exhibit differential desaturase sensitivity. The assay can tolerate up to 50% serum for protein-shift indexing and can be readily extended into other cell lines, including the primary hepatocytes (data not shown). This multiplexed cell assay provides an efficient platform in the identification of specific desaturase and elongase inhibitors.
Footnotes
Acknowledgements
We thank Brian Kennedy, Joseph Mancini, Deena Waddleton, Kathryn Skorey, Chun Sing Li, and Renata Oballa for many discussions and assistance during the course of this work.
A portion of this study was presented as a poster at the “Keystone Symposium on Diabetes: Molecular Genetics, Signaling Pathways and Integrated Physiology,” in January 2007, Keystone, Colorado.