
Abstract
The self-renewal and phenotypic properties of neural stem cells make them an abundant and more physiologically relevant alternative to recombinant cell lines for drug screens to identify ligands acting at neural targets. Here, the authors use high-throughput phenotypic and signaling assays to test the ability of neural stem cells isolated from postnatal mouse hippocampus (mNSCs) to deliver high-content and physiologically relevant data on native peptide receptor activity. The authors find that mNSCs express PAC1 but not the related VPAC1 and VPAC2 receptors. PAC1 promotes both the proliferation of mNSCs and their differentiation into neuronal-like cells. In addition, the authors show that PAC1 stimulates markedly different extracellular signal-regulated kinase signals in mNSCs than in recombinant CHO-PAC1 cells and is able to couple to Ca2+ elevation only in CHO-PAC1 cells. These data suggest that G-protein coupling in CHO-PAC1 cells is nonphysiological, which may affect the ligand binding properties of the receptor and thus distort the results of a screen by increasing numbers of false positives/negatives. This work reinforces the emerging pharmacological theory that recombinant cell lines are often inappropriate models of natively expressing primary cells, and the authors conclude that mNSCs are a viable and relevant physiological alternative for use in high-throughput drug screens.
Introduction
T
Natively expressing cell systems are increasingly being used as screening tools. However, the nonproliferative nature of neurons in culture confounds this approach for neuronal targets because primary cells cannot be produced in sufficient quantities with which to run a large-scale screen. Neural stem cells offer the potential to be more suitable screening hosts for neuronal molecular targets in high-throughput pharmacological and physiological assays due to their proliferative properties and native expression of neuronal signaling molecules. This arguably makes them phenotypically more physiologically relevant than immortalized nonneuronal cell lines. However, little is known about how these cells perform in moderate- to high-throughput assay technologies. To begin investigating the utility of stem cells for native drug screening assays, we used microplate-based phenotypic assays and intracellular Ca2+ release/extracellular signal-regulated kinase (ERK) phosphorylation signaling assays to characterize PAC1 signaling in mouse neural stem cells. We compared these results to responses in a recombinant CHO-PAC1 cell line, chosen because the CHO cell background is one of those most commonly used for screening despite bearing little similarity to the neuronal cells it is being asked to model, and thus illustrating how cellular background can affect signaling responses.
PAC1 (pituitary adenylate cyclase activating peptide [PACAP] receptor 1) is a 7TMR with pleiotropic activities in several organ systems. 1 In the nervous system, PAC1 mediates neuropeptide signaling in response to its endogenous ligand, PACAP, which is secreted as 27-mer and 38-mer forms with different neuroanatomical distributions. 2,3 PACAP expression begins early in mammalian development and may either increase or decrease the proliferation of both neuronal and glial progenitor cells (reviewed by Meyer 4 ). PACAP may also induce the differentiation of neural stem cells, embryonic stem cells, or neuroblastoma cells into neurons or astrocytes. 5,6 Therefore, PACAP signaling via PAC1 appears to regulate the key events—neural progenitor cell proliferation and differentiation—of neurogenesis. That PACAP can either promote or inhibit proliferation or differentiation of neuronal and glial progenitor cells may be a consequence of alternative splicing of the PAC1 gene transcript. Alternative splicing in the amino-terminus and third intracellular loop (ic3) is well characterized for the rat, mouse, and human genes and gives rise to up to 6 isoforms with different signal transduction properties. 7,8 In vitro, PAC1 may also be activated by vasoactive intestinal peptide (VIP). VIP is structurally related to PACAP, and its receptors, VPAC1 and VPAC2, are structurally related to PAC1. 9,10 It is thought that the functions of PACAP and VIP are nonredundant in vivo, and in vitro, a clear rank order of potency of PACAP and VIP at PAC1, VPAC1, and VPAC2 10,11 makes it theoretically possible to determine which receptor the ligands are activating in a cellular system in which more than 1 of the 3 receptors may be present.
In this study, we chose to characterize the effects of PACAP and VIP on mouse neural stem cell (mNSC) proliferation in vitro while comparing their pharmacology and signaling properties in both mNSCs and recombinant CHO cells. Our data demonstrate that PAC1 stimulates the proliferation and possibly differentiation of mNSCs, perhaps at least in part via its activation of the ERK mitogen-activated protein kinase (MAPK) cascade. However, PAC1 signaled via Ca2+ in recombinant CHO cells but not in mNSCs. Given the ability of signalling effectors (e.g., G-proteins) to modify receptor pharmacology through allosteric interactions with the intracellular domains of a 7TMR, we conclude that mNSCs may represent a more suitable screening host for neuronal PACAP receptors than recombinant CHO cells.
Materials and Methods
Cell culture
Mouse neural stem cells, derived from P10 mouse hippocampus, were a kind gift from Joern Schroeder, GlaxoSmithKline, Harlow, UK. The derivation and characterization of the cells have been described. 12 To maintain the cells in their proliferative stem cell state, we cultured them in Neurobasal-A medium (Invitrogen, Carlsbad, CA) supplemented with 2% (v/v) B27 Supplement (without vitamin A [Invitrogen]), 2 mM L-glutamine (Invitrogen), 100 U/mL penicillin, 100 mg/mL streptomycin sulfate (Invitrogen), 0.025% reduced growth factor Matrigel (BD Biosciences, Franklin Lakes, NJ), 10 ng/mL recombinant human epidermal growth factor (EGF; R&D Systems, Minneapolis, MN), and 10 ng/mL recombinant human fibroblast growth factor 2 (FGF-2; R&D Systems). Cell growth was monitored using the IncuCyte imaging system (Essen Instruments) such that the cells were always passaged, using trypsin-EDTA (Invitrogen), while still in the exponential growth phase. Cells maintained in culture in this way expressed neural stem cell markers for at least 40 passages and could be differentiated into cells of neuronal, astrocytic, or oligodendroglial lineages by removal of growth factors and/or addition of other medium supplements. 12
CHO cells recombinantly expressing the human PAC1 receptor were maintained in MEM:F12 (1:1) medium supplemented with 10% fetal bovine serum (FBS), 2 mM L-glutamine, and 500 µM G418 and grown at 37°C in 5% CO2 humidified atmosphere. PAC1 expression was confirmed by robust Ca2+ signaling in these cells in response to PACAP and VIP, which was absent in the parental cell line.
TaqMan analysis of neuropeptide receptor expression in mNSCs
Following cell lysis in Trizol (Invitrogen), total RNA was extracted from the aqueous phase using the RNeasy Universal method on a Biorobot 8000 (Qiagen, Valencia, CA) and converted to cDNA in replicate using the High Capacity cDNA Archive Kit (Applied Biosystems, Foster City, CA). Quantitative RT-PCR was carried out using a 7900HT Sequence Detector System (Applied Biosystems) with each reaction including cDNA from 10 ng of total RNA, 900 nM of each primer, and 100 nM of probe (LNA-based probe from Roche Universal probe library). Relative transcript levels were calculated from standard curves of serially diluted genomic DNA, and the geometric mean abundance levels were calculated for replicate reverse transcription reactions.
mNSC proliferation assays
Cell Titer-Glo assays
The Cell Titer-Glo Assay Kit was purchased from Promega (Madison, WI) and used according to the manufacturer’s instructions. To assay the effects of PACAP-38 (Sigma, St. Louis, MO) on mNSC proliferation, we plated cells at 15,000 per well in 96-well plates in medium containing reduced concentrations of EGF and FGF-2 (3 ng/mL of each) and PACAP-38 in the concentration range of 2 to 1000 nM (2-fold serial dilutions). Cells were cultured at 37°C in a humidified 10% CO2 atmosphere for 39 h before performing the assay. For some experiments, cells were also treated with the PAC1 antagonist, M65, at a concentration of 1 µM (M65 was obtained by custom synthesis from Sigma-Genosys). Data were calculated as percent stimulation compared to cells grown in medium containing 3 ng/mL of EGF and FGF-2, without PACAP-38.
To assay the effects of VIP (Sigma) on mNSC proliferation, we plated cells at 7500 per well in sterile, clear 96-well plates in medium containing reduced concentrations of EGF and FGF-2 (1.5 ng/mL of each) and VIP in the concentration range of 2 to 1000 nM (2-fold serial dilutions). Cells were cultured at 37°C in a humidified 10% CO2 atmosphere for 48 h before performing the assay. Data were calculated as percent stimulation compared to cells grown in medium containing 1.5 ng/mL of EGF and FGF-2, without VIP.
Cell number determination assays
Changes in mNSC numbers mediated by PACAP-38 and VIP were determined by automated fluorescence microscopy using the Cellomics ArrayScan™-II in conjunction with the Target Activation algorithm. Treatment of the cells with PACAP-38 or VIP was performed identically to the Cell Titer-Glo assays. At the end of the incubation period, the medium was removed and the cells were fixed for 15 min with 4% paraformaldehyde in phosphate-buffered saline (PBS) containing 2.5 µg/mL Hoechst 33342 (Molecular Probes, Invitrogen, CA), prewarmed to 37°C. The fixative was then discarded, and the cells were washed 3 times with PBS. To determine the number of cells per well, the ArrayScan™-II was programmed to count Hoechst 33342–stained objects (nuclei) in all 49 optical fields per well. Data were calculated as percent stimulation compared to cells grown in medium containing 1.5 ng/mL of EGF and FGF-2, without PACAP-38 or VIP.
mNSC growth curve analysis
Real-time analysis of mNSC proliferation stimulated by PACAP-38 or VIP was performed using the IncuCyte imaging system, and the data were used to plot growth curves (% confluence vs. time). Cells were plated at 32,000 per well in 6-well plates (resulting in an initial confluence of <10%) in Neurobasal-A medium supplemented with 2% B27 Supplement (without vitamin A), 2 mM L-glutamine, 100 U/mL penicillin, 100 mg/mL streptomycin sulfate, and 0.025% reduced growth factor Matrigel. All wells also contained 1.5 ng/mL recombinant human EGF and 1.5 ng/mL recombinant human FGF-2 (these basal growth factor concentrations were used as the negative control, without further supplementation). Test wells were supplemented with either 1 µM PACAP-38 ± 1 µM M65 or optimal concentrations of EGF and FGF-2 (10 ng/mL each). Continual growth monitoring was performed for 120 h, with confluence measurements being determined at 1-h intervals.
FLIPR Ca2+ release assay
Cells were plated at either 50,000 per well (CHO-PAC1) or 15,000 per well (mNSCs) in black-walled, clear-bottomed 96-well plates and allowed to adhere overnight. On the day of assay, the medium was removed and replaced with Ca2+ assay buffer (for CHO cells: Tyrodes buffer [NaCl, 137 mM; KCl, 0.1 mM; HEPES, 20 mM; MgCl2.6H2O, 1 mM; NaHCO3, 12 mM; NaH2PO4, 0.4 mM; glucose, 5.5 mM] supplemented with Calcium-3 dye [as per the manufacturer’s instructions; Molecular Devices], 1.8 mM CaCl2, and 2.5 mM probenecid; for mNSCs: growth medium [without phenol red] supplemented with Calcium-3 dye and 2.5 mM probenecid). Plates were placed back in the incubator (37°C) for 1 h. Drug-stimulated Ca2+ release was measured using a FLIPRTETRA (Molecular Devices, Sunnyvale, CA). Drugs were formulated as 10× stocks and added to cell plates by the liquid handling unit of the FLIPRTETRA. Dye fluorescence was measured simultaneously in all wells at intervals of 1 s for 15 s prior to and for a further 65 s after drug addition. Each data point was measured in duplicate for any given plate, and all assays were repeated independently to at least n = 3 (CHO) or n = 4 (mNSC). Adenosine triphosphate (ATP) was used as a positive control to stimulate endogenous nucleotide receptors. All responses were normalized against the Ca2+ signal following addition of 50 µM A23187 (calcimycin) to control wells to saturate intracellular dye.
SureFire™ AlphaScreen ERK phosphorylation assay
To measure ERK phosphorylation in CHO-PAC1 cells and mNSCs, we used the high-capacity phospho-ERK (pERK)-specific SureFire™ AlphaScreen kit (PerkinElmer, Waltham, MA). This kit has been used extensively in recent studies and has been shown to perform at least as well as more traditional Western blot techniques. 13,14 Cells were plated at 50,000 (CHO) or 15,000 (mNSC) per well in 96-well plates and allowed to adhere overnight. On the morning of the assay day, CHO-PAC1 growth medium was removed and replaced with serum-free medium. mNSCs, whose growth medium contained no serum, were simply treated to a medium change. Cells were then incubated for a further 4 h prior to drug addition. Drugs were formulated as 10× stocks in standard PBS and added directly to 96-well plates for the required duration. To terminate the assay, we removed medium and replaced it with SureFire™ lysis buffer. Cell lysates were then processed according to the manufacturer’s instructions and fluorescence signals quantified using an EnVision plate reader (PerkinElmer).
Data analysis
For Ca2+ assays, responses were quantified as the difference between the maximum and minimum values for each well and normalized against the control signal following 50 µM A23187 application. For ERK assays, basal signals were subtracted, and all values were normalized against either the maximal 1 µM PACAP-38 signal (time course experiments) or the upper asymptote of the fitted nonlinear regression curve for PACAP-38 (concentration-response experiments).
Normalized data were analyzed and presented using Prism 5 software (GraphPad, La Jolla, CA). Concentration-response data were fitted using a 3-parameter logistic fit according to the following equation:
where Y is the response; [A] is agonist concentration; Top and Bottom are the upper and lower asymptotes, respectively; and EC50 is the midpoint location (potency) parameter. 15
Results
Expression of PACAP and VIP receptor mRNAs in mNSCs
The expression of receptors for PACAP and VIP in mNSCs was initially confirmed using TaqMan quantification of mRNA for the PAC1, VPAC1, and VPAC2 receptors. The mRNA for PAC1 was expressed most abundantly, with VPAC1 and VPAC2 receptor mRNA expression being approximately 600-fold and 150-fold lower, respectively, than PAC1 ( Fig. 1 ). Nonetheless, PAC1 mRNA expression was very low compared to housekeeping genes such as β-actin (78-fold higher than PAC1) and GAPDH (33-fold; data not shown). Negligible RNA was detected in samples lacking reverse transcriptase, demonstrating the specificity of the reaction.
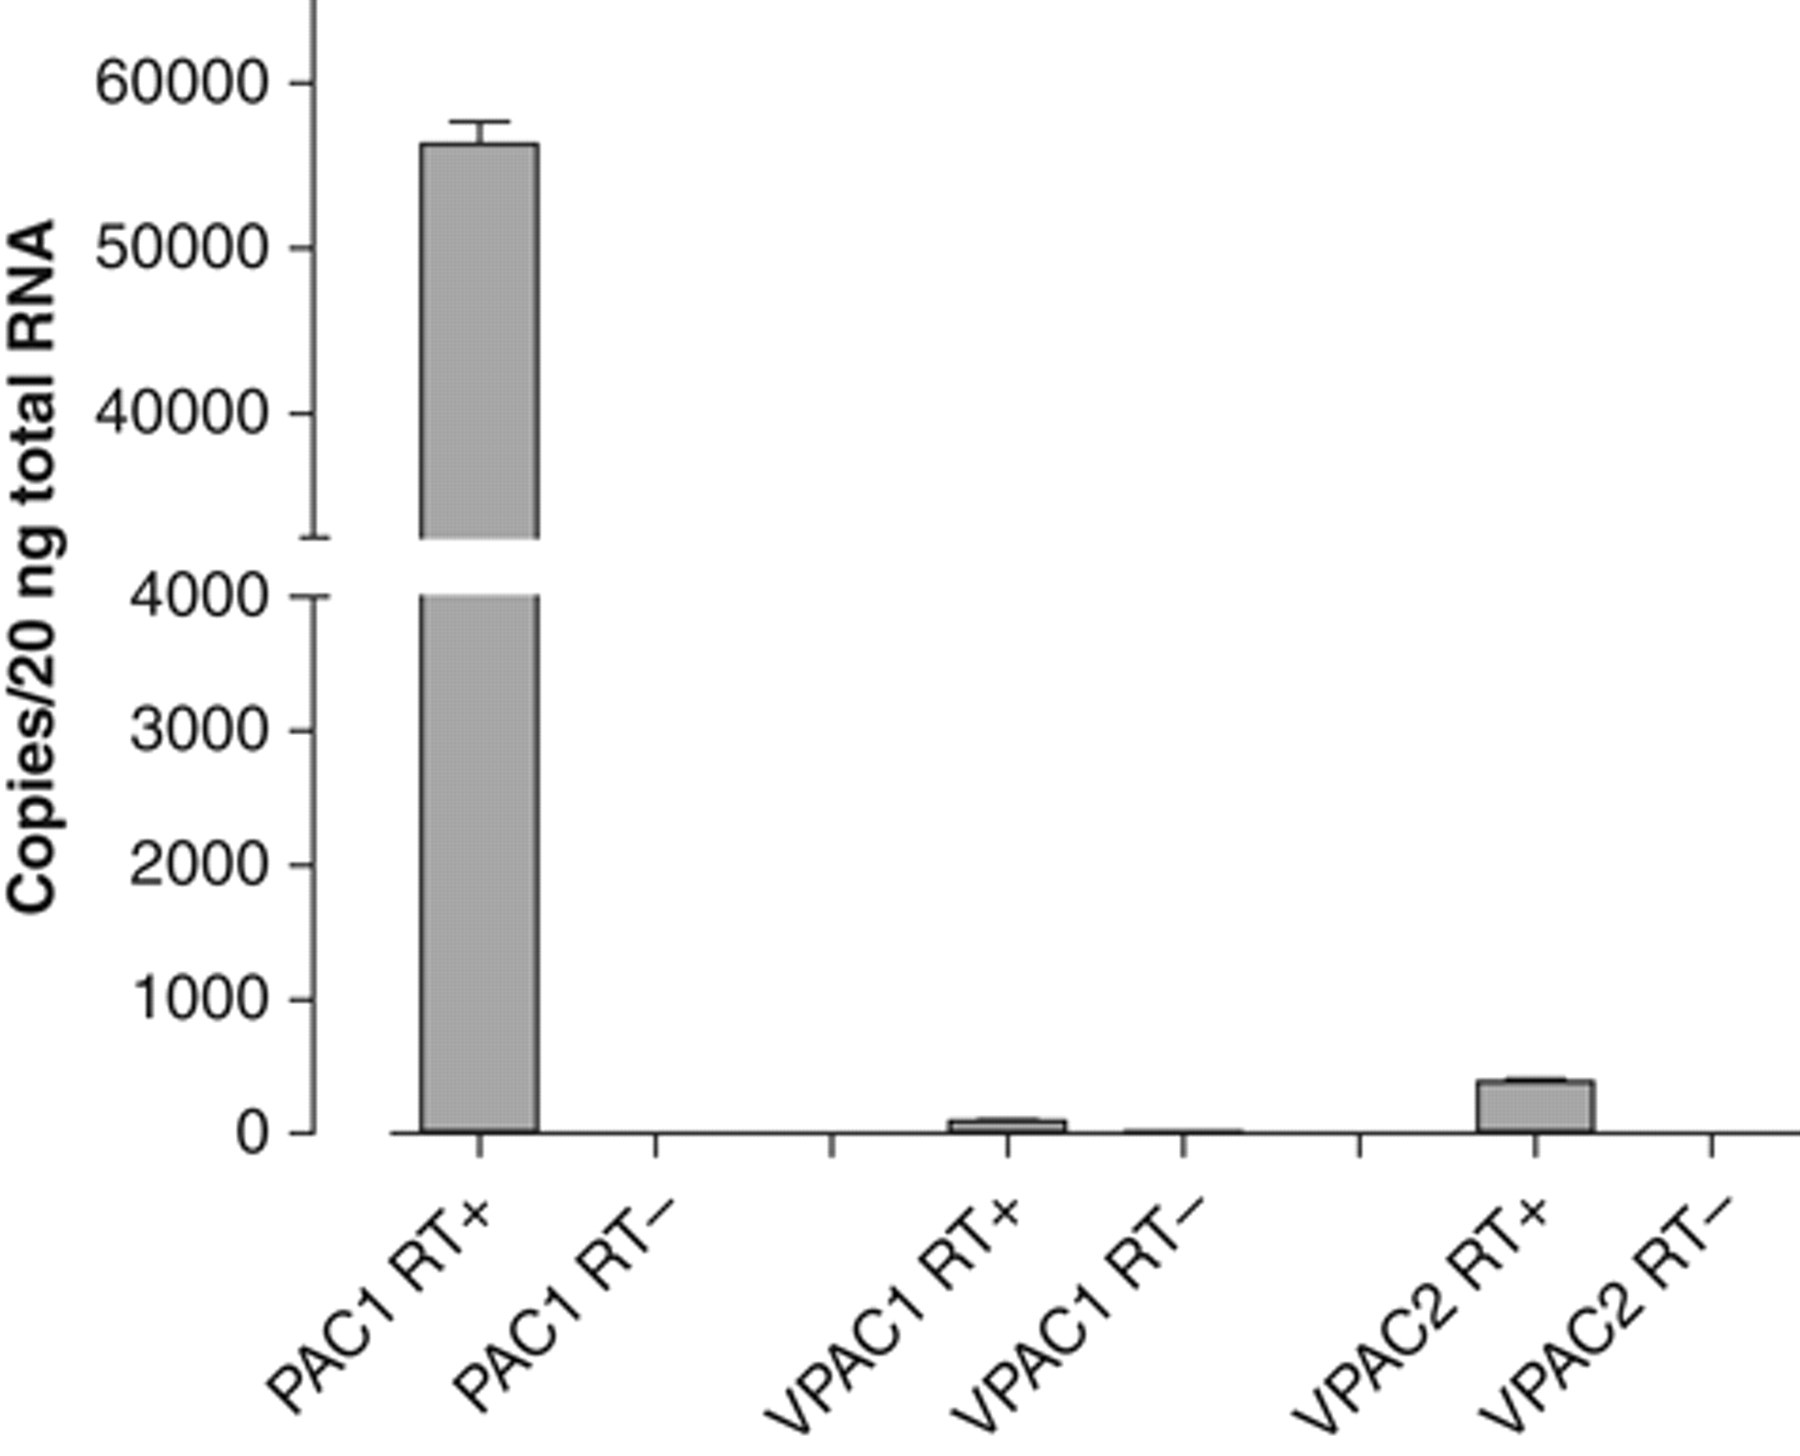
Expression of pituitary adenylate cyclase activating peptide (PACAP) and vasoactive intestinal peptide (VIP) receptor mRNAs in mouse neural stem cells (mNSCs). Experiments were run with and without reverse transcriptase (“+RT” and “−RT,” respectively) to demonstrate the absence of any significant background RNA expression. Data are mean ± SEM, n = 3. Although we were unable to confirm the full complement of PAC1 splice variants expressed by the mNSCs, RT-PCR experiments indicated that at least the null, hip, and/or hop isoform mRNAs were present (data not shown).
PACAP-38 and VIP promote neural stem cell proliferation in vitro
PACAP and VIP have both previously been reported to stimulate proliferation and/or differentiation of neural stem cells in vitro. 4,6,16 To confirm such biological activity with our cells, we tested the effects of both PACAP-38 and VIP in different proliferation assays. We initially confirmed that our chosen assay systems (Cell TiterGlo™ kit to measure cellular ATP content and an automated viable cell counting technique [Cellomics ArrayScan™]) faithfully measured proliferative responses to true mitogens by constructing concentration-response curves to EGF and FGF-2 (0.1-20 ng/mL; 24-, 39-, and 48-h incubations). No significant differences were apparent in the pharmacology as measured by each technique (data not shown). We subsequently tested whether PACAP-38 or VIP could stimulate the proliferation of mNSCs cultured in suboptimal concentrations of EGF and FGF-2. Cell plating density and incubation time conditions were optimized for each agonist (PACAP-38: 15,000 cells/well, 39-h stimulation with PACAP-38, basal EGF + FGF-2 concentration of 3 ng/mL; VIP: 7500 cells/well, 48-h stimulation with VIP, basal EGF + FGF-2 concentration of 1.5 ng/mL). Assaying under these conditions, we found that both PACAP-38 and VIP stimulated mNSC proliferation to 160% to 170% of the basal proliferation level and with pEC50 values of 8.0 ± 0.1 and 6.8 ± 0.1, respectively ( Fig. 2A ). Similarly, in Hoescht 33342–stained cells, the ArrayScan™ technique measured PACAP- and VIP-stimulated increases in nuclei numbers of approximately 50% above basal ( Fig. 2B ) and with potencies (pEC50 = 8.3 ± 0.2 and 6.9 ± 0.2 for PACAP-38 and VIP, respectively) very similar to those measured by the Cell TiterGlo™ ATP assay.
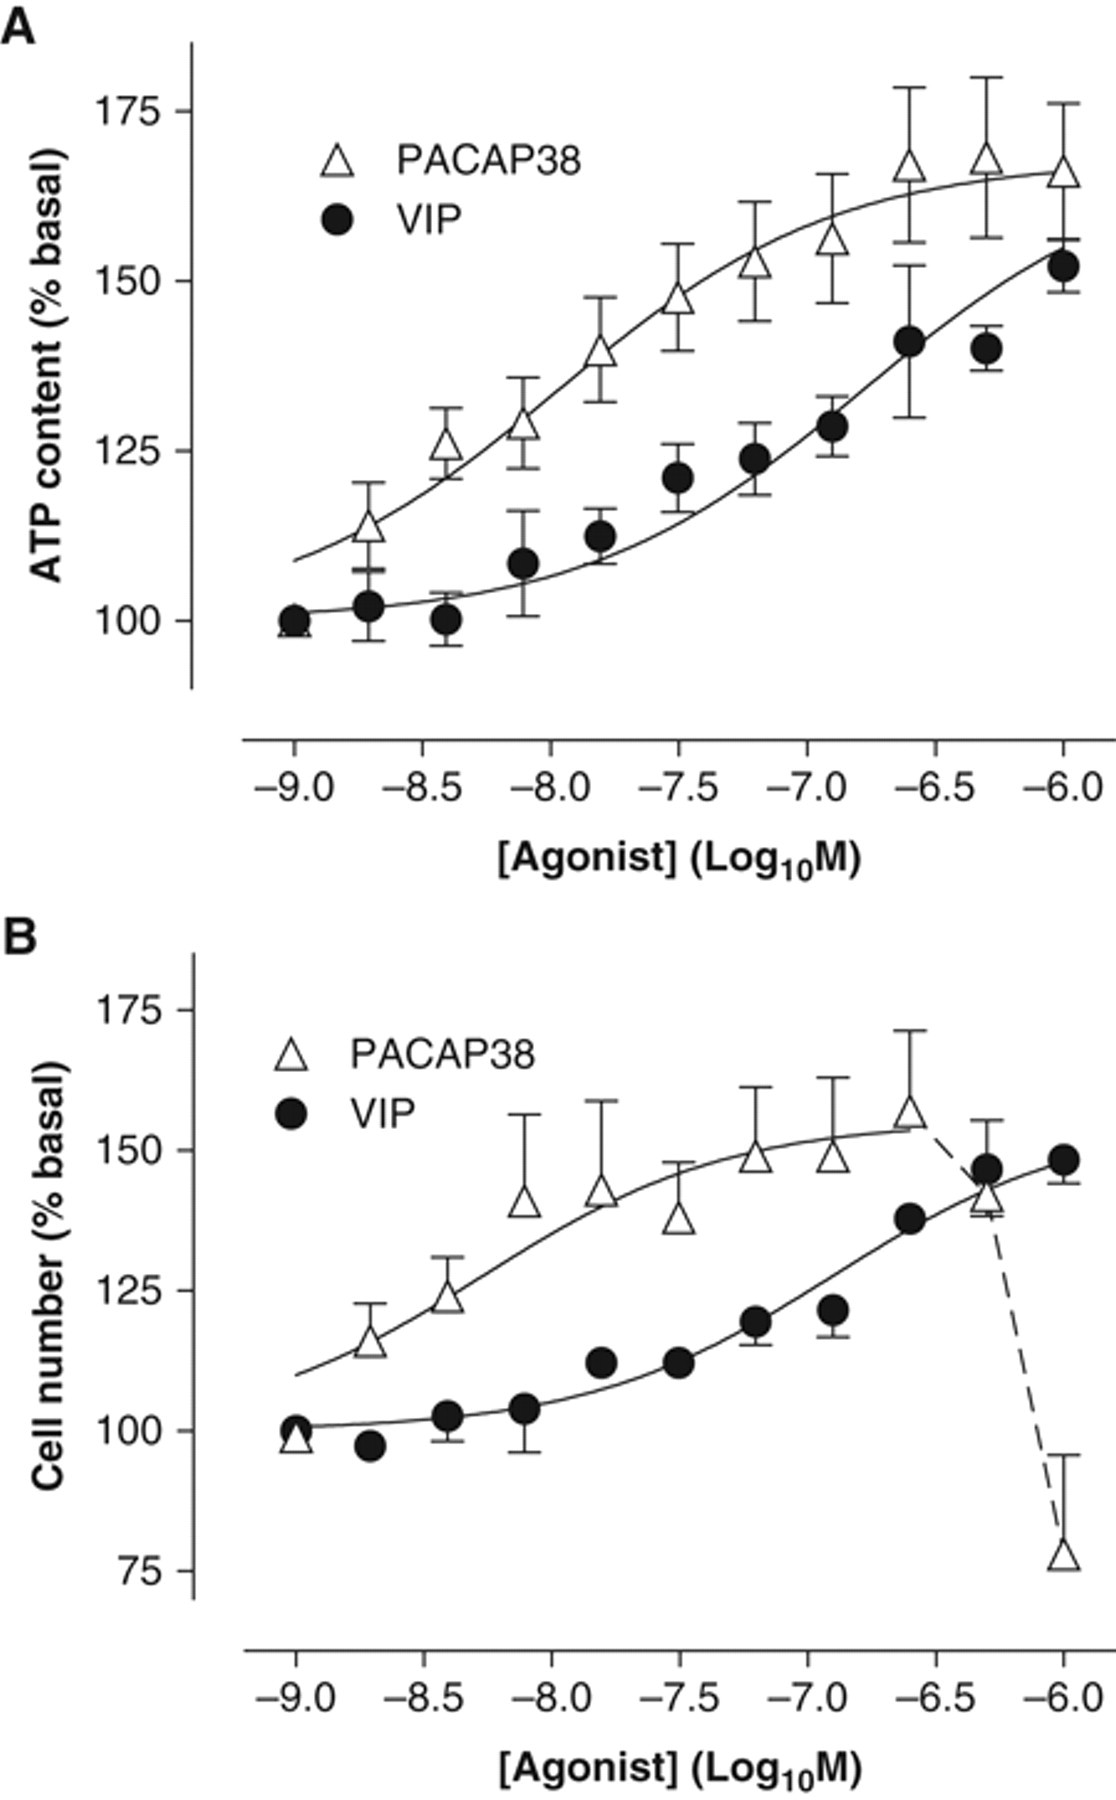
Effects of pituitary adenylate cyclase activating peptide–38 (PACAP-38) and vasoactive intestinal peptide (VIP) on mouse neural stem cell (mNSC) proliferation. Mouse neural stem cells were plated as described in Materials and Methods and stimulated with either PACAP-38 (△) or VIP (●) (concentration range: 1.95 nM to 1 µM). Proliferation was determined using (
Interestingly, there was a sharp decline in cell numbers at high concentrations (≥300 nM) of PACAP-38 ( Fig. 2B ) that could not be explained by buffer effects (both VIP and PACAP-38 were in the same aqueous buffer, and no equivalent effect was seen for VIP) or cell death (because ATP levels remained high at these concentrations of PACAP-38). To further investigate the growth effects of PACAP-38 on mNSCs, we analyzed real-time cell growth kinetics using the IncuCyte™ imaging system (Essen Instruments, Ann Arbor, MI). Growth curves plotted over 120 h showed that cells initially grew at a rate independent of growth factor concentration ( Figs. 3 and 4A , B ). However, in the presence of suboptimal concentrations of EGF and FGF-2 (1.5 ng/mL), the cells stopped proliferating at approximately 70 to 80 h when confluence was around 75% ( Figs. 3 and 4D ). In contrast, cells treated with optimal concentrations of EGF and FGF-2 (10 ng/mL) continued growing until 90 to 100 h and 100% confluence ( Figs. 3 and 4C ). Unexpectedly, cell confluence when stimulated with 1 µM PACAP-38 was markedly reduced after about 70 h, an effect reversed by 1 µM M65 (a PAC1 antagonist; Fig. 3 ). Analysis of the phase microscopic images of cells growing in the presence of PACAP-38 revealed a distinct change in their morphology that began just prior to the decrease in confluence ( Fig. 4 ). PACAP-38-stimulated cells exhibited a neuronal-like morphology, with extending processes and small cell bodies ( Fig. 4E ). Some cell death was also apparent as phase-bright clusters detaching from the culture surface. In contrast, cells cultured with growth factors and PACAP-38 in the presence of 1 µM M65 ( Fig. 4F ) were morphologically similar to cells cultured in the absence of PACAP-38 ( Fig. 4D ). This may be explained by PACAP-38 stimulating differentiation at higher concentrations, which would be consistent with increasing levels of ATP ( Fig. 2A ) despite the declining cell numbers ( Fig. 2B ) on the assumption that differentiation is associated with increased metabolic activity.
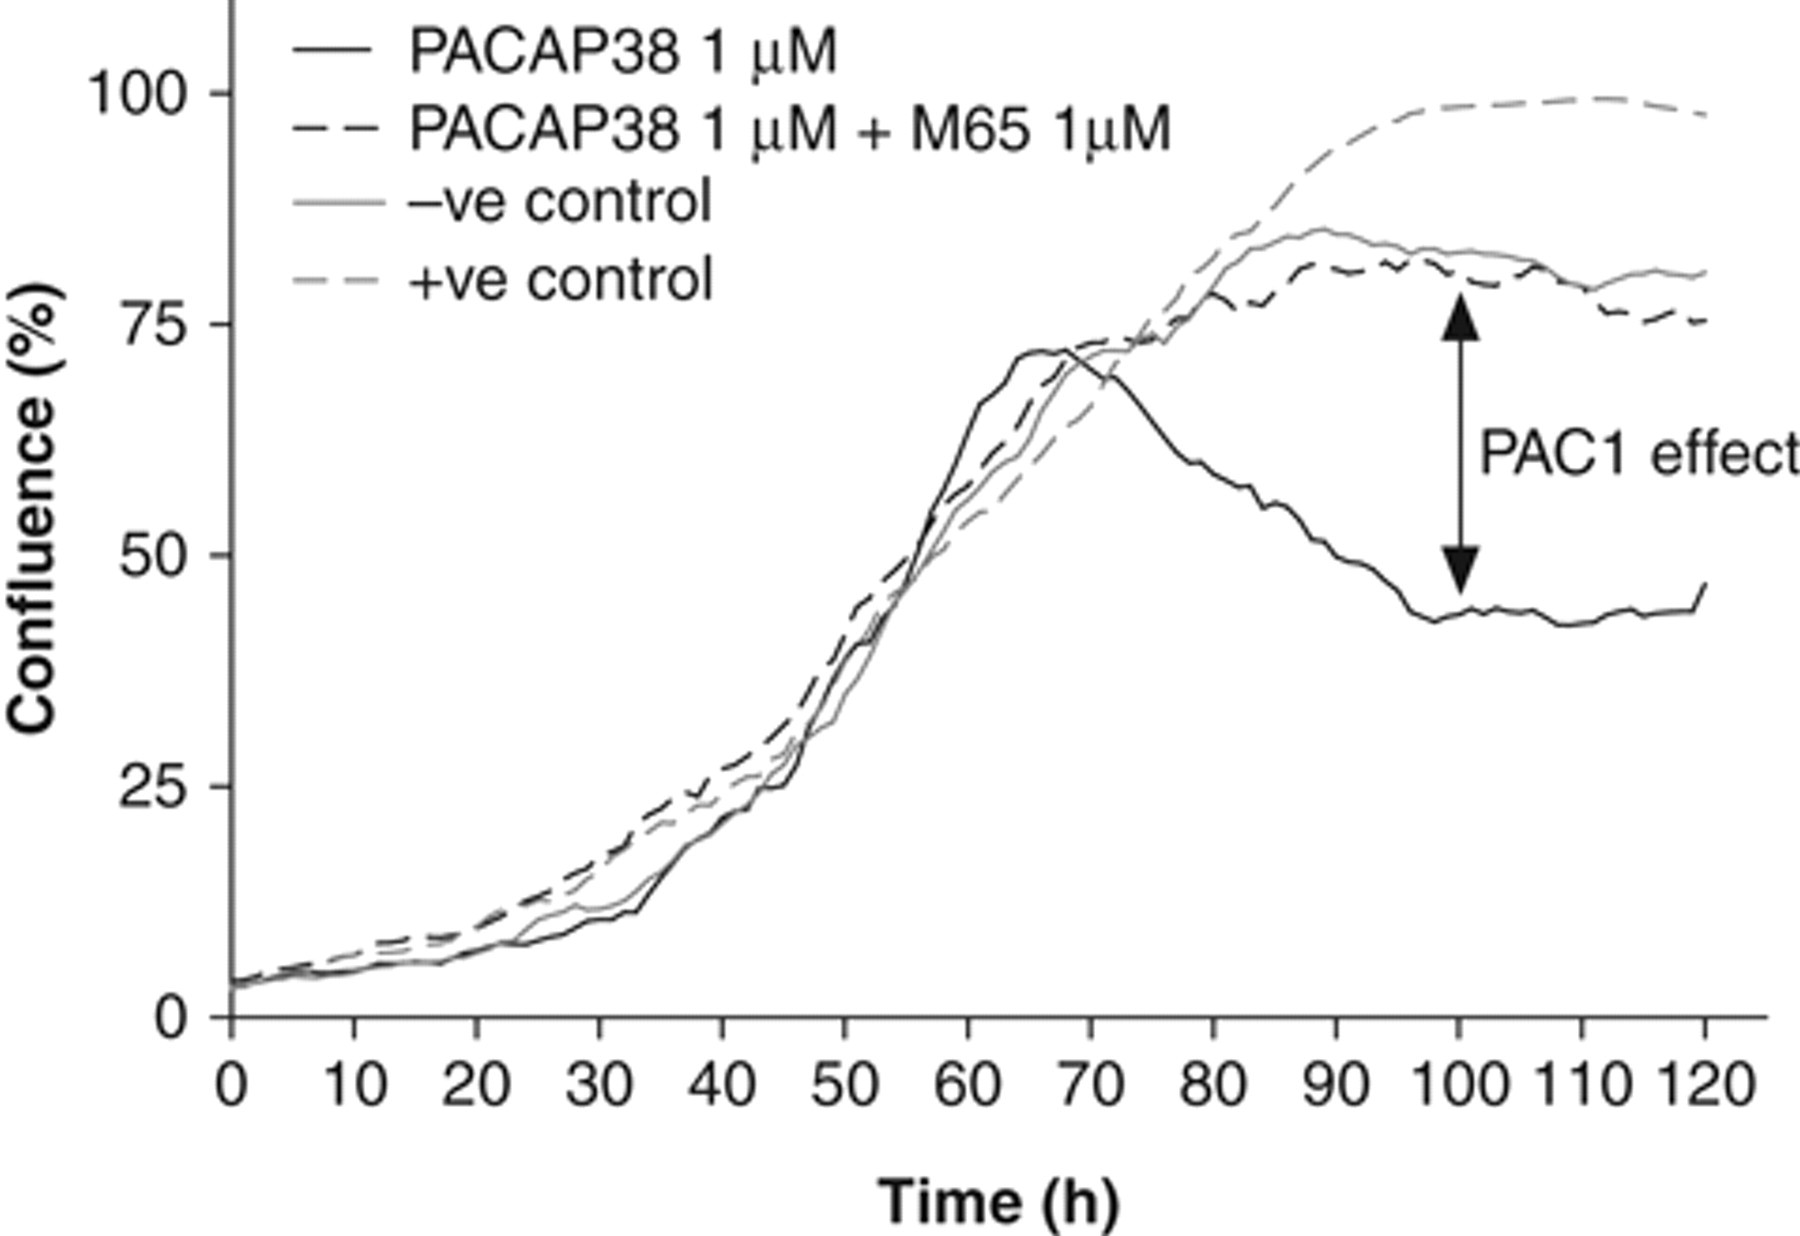
Effects of pituitary adenylate cyclase activating peptide–38 (PACAP-38) on cellular confluence measured in real time. Mouse neural stem cells were cultured at 32,000 cells per well, in 6-well plates, in the presence of 1.5 ng/mL epidermal growth factor (EGF) + fibroblast growth factor 2 (FGF-2) and either vehicle (solid gray line), a further 8.5 ng/mL EGF and FGF-2 (to give a 10-ng/mL final concentration of each; dashed gray line), 1 µM PACAP-38 (solid black line), or 1 µM PACAP-38 plus 1 µM M65 (dashed black line). Cell confluence measurements were taken at 1-h intervals over a 5-day period using the IncuCyte imaging system. For presentation purposes, data have been subjected to 5-point smoothing.
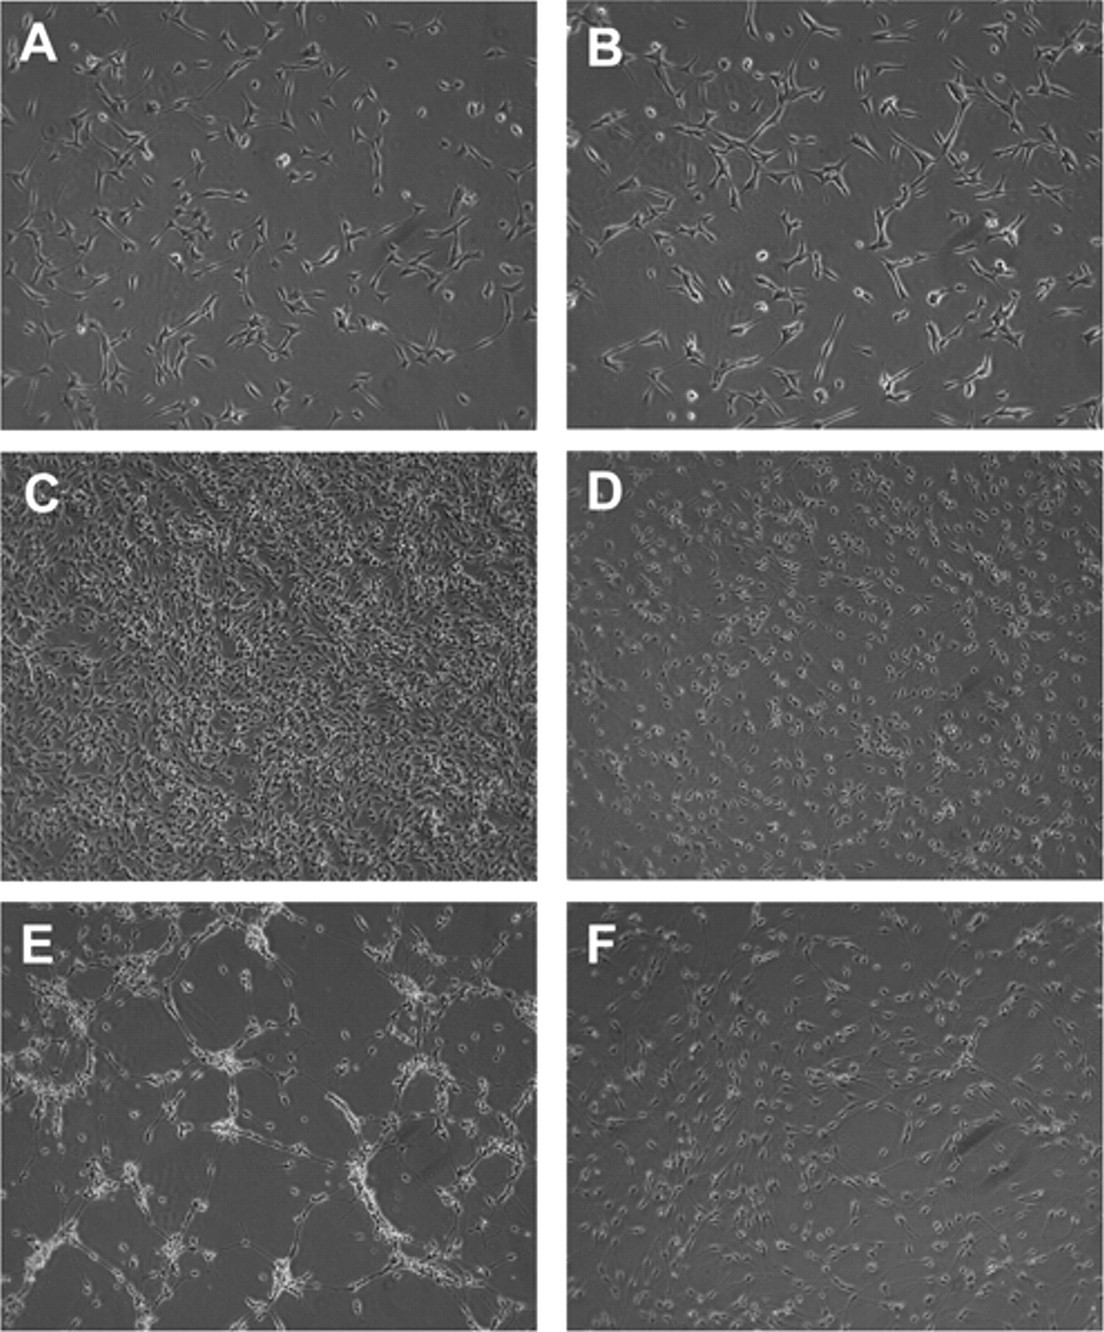
Effect of pituitary adenylate cyclase activating peptide–38 (PACAP-38) on mouse neural stem cell (mNSC) proliferation and differentiation. Representative phase-contrast images of mNSCs during the growth curve experiment presented in
Figure 3
. Representative images of mNSCs growing in the presence of high or low concentrations of growth factors with or without 1 µM PACAP-38 and with or without the PAC1 antagonist, M65 (1 µM), for varying durations. Ligand concentrations and growth periods are as follows: (
Neuropeptide-mediated Ca2+ release
The PAC1 receptor frequently has been reported to couple via Gαq/11 proteins to release Ca2+ from inositol-(1,4,5)-trisphosphate-sensitive intracellular stores. Using the commonly used high-throughput FLIPR Ca2+ detection assay, we tested the ability of PACAP and VIP to stimulate Ca2+ release in the mNSCs and also in a recombinant CHO cell line (CHO-PAC1) expressing the “null” PAC1 variant (i.e., with an unspliced amino terminus but lacking the hip and hop domains 8 ).
In the CHO-PAC1 cell line, stimulation with each of PACAP-27, PACAP-38, and VIP caused a robust elevation of cytosolic Ca2+ concentration, as did the control agonist, ATP ( Fig. 5A ). PACAP-27 and PACAP-38 were approximately equipotent for this effect with pEC50 values of 8.9 ± 0.1 and 9.0 ± 0.1 for PACAP-38 and PACAP-27, respectively, whereas VIP was around 2 orders of magnitude less potent in stimulating Ca2+ release (pEC50: 7.1 ± 0.0). PACAP and VIP were unable to stimulate Ca2+ release in an untransfected CHO cell line (data not shown), demonstrating that signals were mediated entirely via the transfected receptor. Interestingly, in addition to the different agonist potencies, there were also stark differences in the shape of the Ca2+ release profiles following stimulation of the CHO-PAC1 cell line with the various neuropeptides, most noticeably at submaximal agonist concentrations ( Fig. 5B ). The time of signal onset, rate of Ca2+ release, and rate of signal decay differed between all 3 agonists. For instance, PACAP-27 stimulated an almost immediate response, which rapidly accelerated toward its peak level (~15 s after drug addition) and decayed to around 50% of maximum by the end of the experiment. In contrast, VIP-stimulated signals, which had a similarly quick onset and rapid elevation (<10 s between addition and peak response), decayed almost to baseline levels by the end of the experiment. PACAP-38-stimulated signals had an idiosyncratic latency period (~10 s) prior to signal onset, followed by a much slower progression to maximal signal (~40 s from addition to peak response), but showed negligible decay such that signals were still over 90% of maximum at the end of the assay. This suggests that the mode of PAC1 binding and/or activation by these 3 ligands may be subtly different, as illustrated by their divergent Ca2+ response profiles.
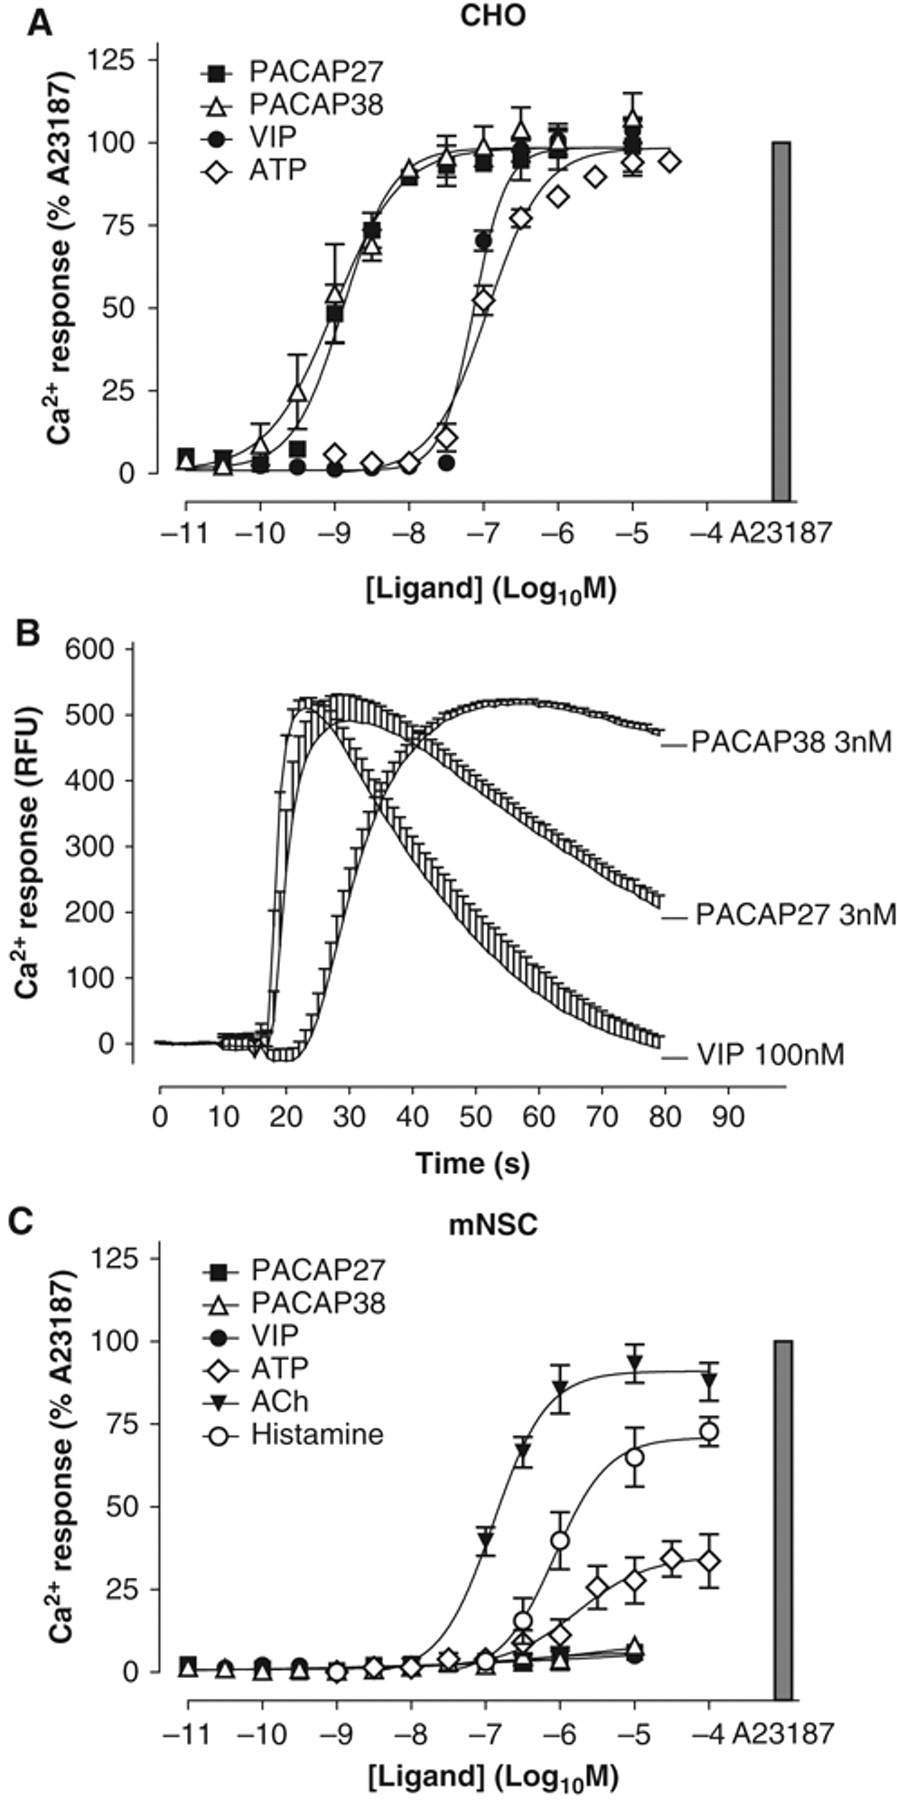
Neuropeptide-mediated Ca2+ release in CHO-PAC1 cells and mouse neural stem cells (mNSCs). Cells were plated as described in Materials and Methods and grown overnight prior to assay. Following a wash and 1-h treatment with the cell permeant, Ca2+-sensitive fluorescent Calcium-3 dye (Molecular Devices), cells were stimulated with ligands and fluorescence measured using a FLIPRTETRA (Molecular Devices). (
Neuropeptide stimulation of mNSCs surprisingly initiated no observable elevation in intracellular Ca2+ concentration, even up to an agonist concentration of 10 µM (a supra-maximal concentration in the CHO-PAC1 assay; Fig. 5C ). This was not because the cells were incapable of Ca2+ signaling because the neurotransmitters ATP, acetylcholine (ACh), and histamine each stimulated responses of varying magnitudes in the mNSCs. Indeed, ACh in particular stimulated a potent and robust Ca2+ release ( Fig. 5C ). ATP stimulated a noticeably lower response in mNSCs than in the CHO cell line, which may indicate expression of a divergent array of nucleotide receptors and/or G-proteins in these 2 cell types.
PACAP- and VIP-mediated ERK activation
All G-proteins are capable of signaling to the ERK MAPK cascade, making ERK a putative integrator of the often pleiotropic signals emanating from some 7TMRs. ERK is thus less prone to cell background-driven variation in signaling machinery, such as we have shown above with the Ca2+ signaling that is generally dependent on Gq/11 family G-proteins. Using the SureFire™ AlphaScreen high-throughput phospho-ERK detection assay, we aimed to define the pharmacology of neuropeptide-induced ERK signaling in mNSCs and contrast it with that in CHO-PAC1 cells.
In CHO-PAC1 cells, a time course of ERK response at varying periods of stimulation with a 1-µM concentration of either PACAP-27 or PACAP-38 revealed a rapid phosphorylation of ERK, emerging at 3 min, peaking at around 30 min and remaining at this maximally elevated level until the end of the assay (60 min; Fig. 6A ). VIP (1 µM) stimulated a similarly rapid and sustained activation of ERK, whereas ATP-mediated ERK activation was rapid and transient ( Fig. 6A ). Concentration-response studies in CHO-PAC1 cells showed that PACAP-27 and PACAP-38 were approximately equipotent (pEC50 = 7.1 ± 0.0 and 7.3 ± 0.0, respectively), with VIP considerably less potent (pEC50 = 5.7 ± 0.1), as is characteristic of these ligands at PAC1 ( Fig. 6B ).
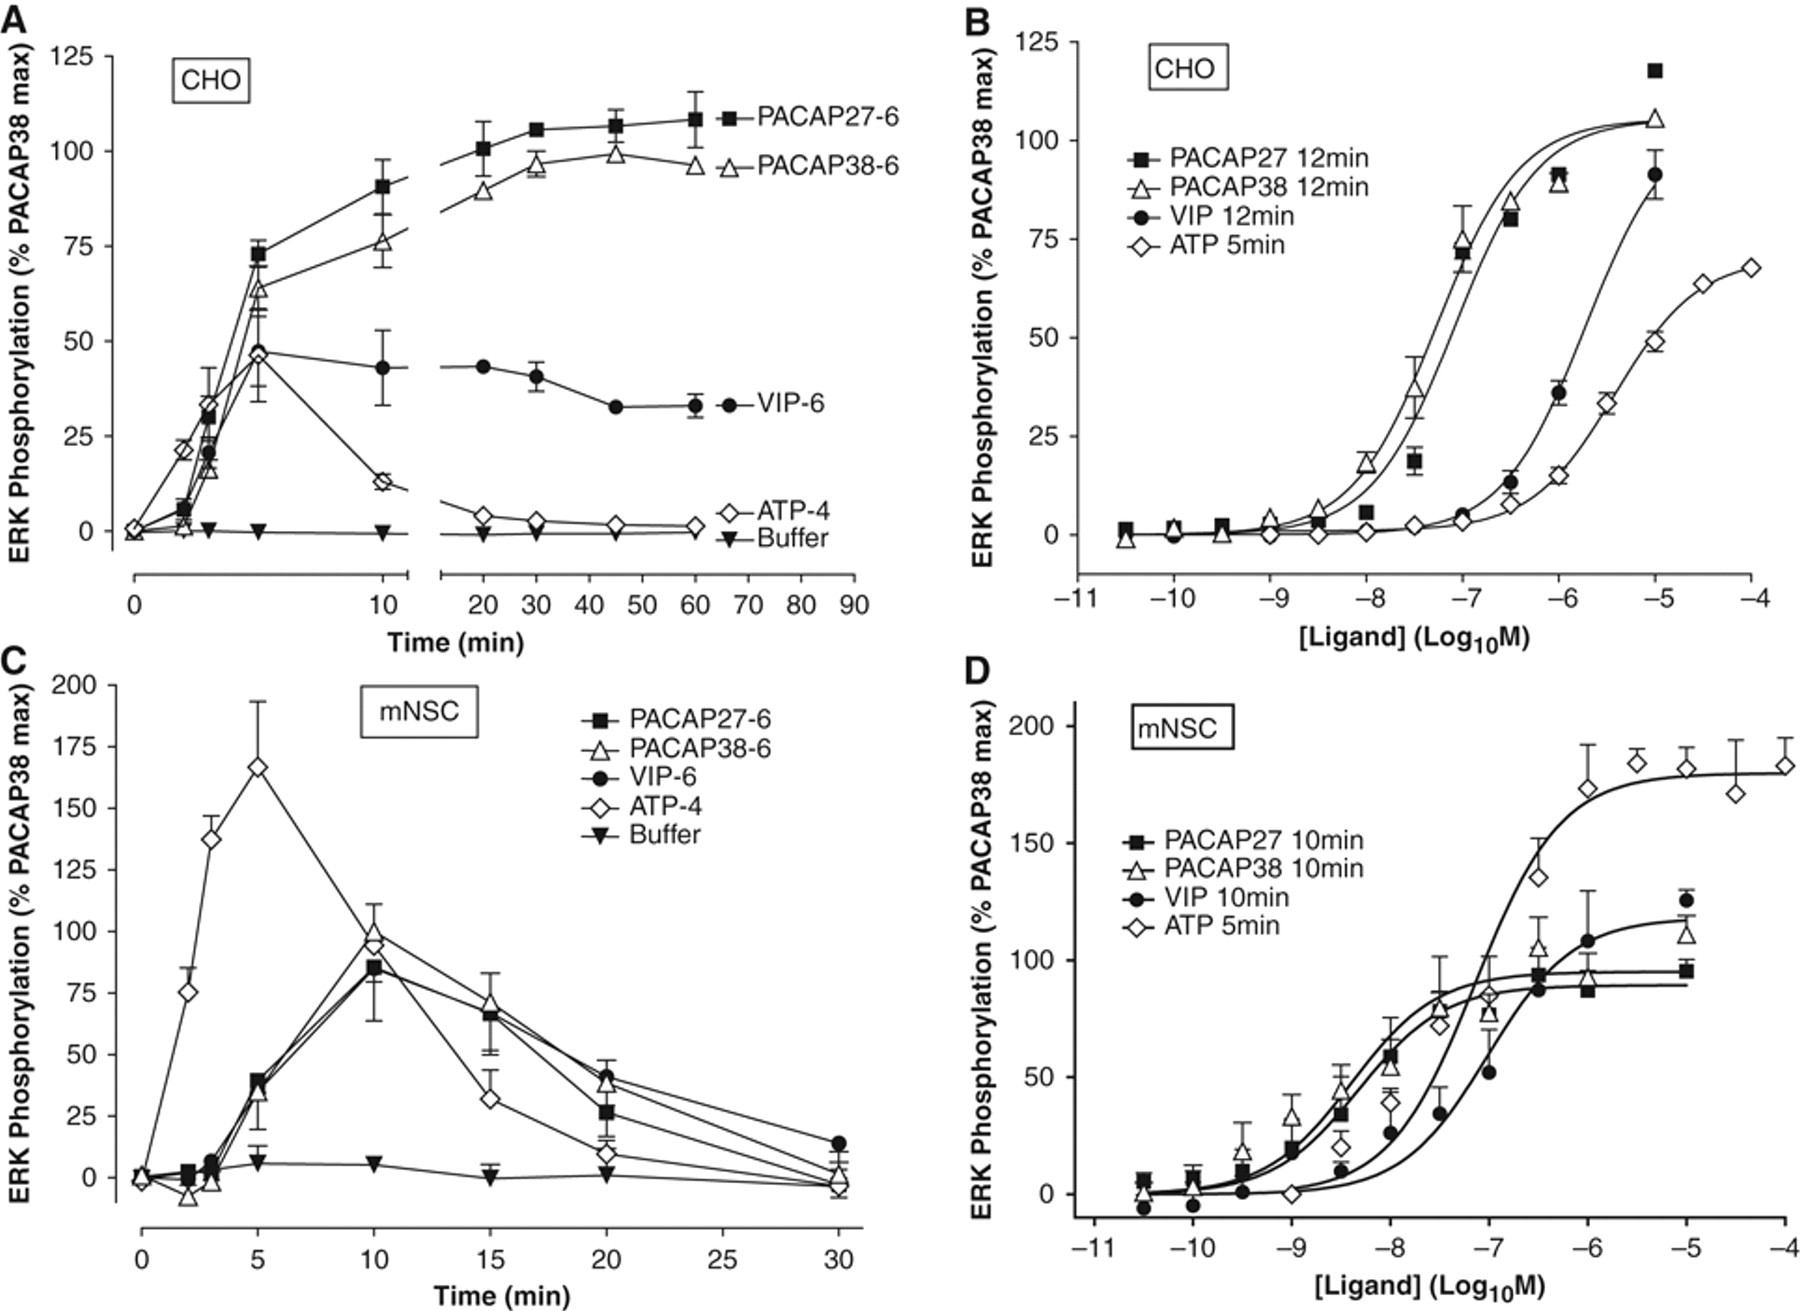
Neuropeptide-stimulated extracellular signal-regulated kinase (ERK) phosphorylation in CHO-PAC1 cells and mouse neural stem cells (mNSCs). Cells were plated as described in Materials and Methods and grown overnight prior to assay. Following a 4-h incubation in serum-free (CHO-PAC1 cells) or complete (mNSCs) medium, cells were stimulated for the required duration with pituitary adenylate cyclase activating peptide–27 (PACAP-27; ■), PACAP-38 (△), vasoactive intestinal peptide (VIP; ●), adenosine triphosphate (ATP; ◊) or buffer (▼) before stopping the stimulation by removing assay medium and replacing with 100 µL SureFire™ lysis buffer. Phospho-ERK content in the lysates was quantified using the SureFire™ pERK AlphaScreen assay kit (PerkinElmer) according to the manufacturer’s instructions. (
In stark contrast, the ERK responses to these same stimulation protocols in mNSCs were transient, and the ligands all showed higher potency than in CHO-PAC1 cells ( Fig. 6C , D ). Stimulation with 1 µM PACAP-27, PACAP-38, or VIP resulted in a slightly delayed ERK response (appearing at ~5 min) followed by a rapid ascension to a peak at around 10 min. This peak was transient, returning to basal levels within 30 min ( Fig. 6C ). ATP responses in mNSCs were almost identical to those in CHO-PAC1 cells: an almost immediate response that peaked at 5 min and returned to basal within ~20 min. There was thus clearly less divergence between the neuropeptide- and ATP-stimulated responses in the mNSCs than in the CHO-PAC1 cells. The concentration-response relationship between the neuropeptides and PAC1 was similar to that in the CHO-PAC1 cells, insofar as the order of potency was still PACAP-27 = PACAP-38>>VIP ( Fig. 6D ). However, there was a striking potency shift in the mNSCs, with all ligands gaining more than an order of magnitude in their potency compared to that in CHO-PAC1 cells. The potencies of PACAP-27, PACAP-38, and VIP increased to 8.3 ± 0.1, 8.4 ± 0.1, and 7.0 ± 0.2, respectively.
Discussion
We have shown in this study that mNSCs can be used in medium- to high-density multiwell plate assays to measure proliferation, differentiation, and second-messenger production, thus demonstrating their potential for high-throughput screens. Moreover, we have shown that PAC1-mediated signaling responses differ dramatically depending on the cellular background in which the receptor is expressed. In mNSCs, PAC1 is unable to couple significantly to any Ca2+ signaling pathway (Ca2+ release from intracellular stores or entry from the extracellular environment). PAC1-mediated ERK responses in mNSCs also vary compared to those in CHO-PAC1 cells, both in agonist potency and temporal profile. The cell type-dependent reversal of neuropeptide potency between the Ca2+ and ERK assays allows both receptor overexpression (in CHOs) and species-dependent ligand affinity (for the human vs. mouse receptor isoforms) to be ruled out as underlying factors in the altered signaling phenotypes. These data therefore strongly suggest that a different mechanistic basis underlies the PAC1-mediated signaling responses in the 2 cell types.
Immortalized cell lines expressing recombinant 7TMRs are often screened using assays to measure intracellular Ca2+ release (FLIPR or aequorin) or cAMP production 17 but can lack physiological relevance if the recombinant target being screened is in a nonnative environment (e.g., a neuronal protein expressed in an epithelial cell or a human target expressed in a rodent cell). Occasionally, cells are also engineered to express a promiscuous G-protein, such as the Gαq/11 family member, Gα16, to facilitate coupling of a Gi/Gs-coupled receptor to the Ca2+ release pathway and enable the use of FLIPR assays regardless of its natural G-protein coupling preferences. 18 However, G-protein binding to receptors prior to ligand binding can exert allosteric-type effects that change (often dramatically) the pharmacology of the ligand-receptor interaction, as described by the cubic ternary complex model (reviewed by Kenakin 19 ). Different receptor:G-protein combinations thus represent distinct receptor active conformations between which ligands may be capable of discriminating. 20 Assaying an inappropriate R:G combination may lead to the identification of false-positive and/or false-negative small-molecule ligands: for example, a ligand may be an agonist at a Gα16-coupled receptor but an antagonist at the same receptor coupled to its preferred native G-protein. Moreover, recombinant cell lines may never adequately replicate the pharmacology of receptors that have multiple splice variants (such as PAC1) or specific accessory partners that influence receptor signaling (such as the PAC1-related receptor, VPAC1, whose signaling changes upon interaction with receptor activity-modifying proteins [RAMPs 21,22 ]).
Clearly, the use of an assay system (e.g., recombinant CHO cells) whose output does not replicate that of a physiological system is a suboptimal way of predicting in vivo activity of compounds at a given receptor. Assaying neuronal receptors is compromised both by the poor availability of human neural tissue and the nonproliferative nature of (rodent) neurons in culture. Neural stem cells offer the advantages of continued expansion in vitro and endogenous expression of neuronal receptors and their associated signaling machinery. Therefore, ligand-driven proliferation and differentiation (phenotypic/physiological responses) can be studied in parallel with signaling output (pharmacological responses) in medium- to high-throughput assays, in both human and rodent cells. In this respect, mNSCs here have proven their utility in medium-throughput physiological assays with functional readouts and in commonly used high-throughput techniques such as FLIPR and SureFire™ AlphaScreen assays.
Initially, the results from our Cell TiterGlo™ and ArrayScan™ assays to measure mNSC proliferation ( Fig. 2 ) appeared to conflict due to decreasing cell numbers at high PACAP-38 concentrations that were not reflected by a concomitant decrease in ATP levels. However, given that the cells have been characterized as being capable of neuronal differentiation 12 and the fact that we noted morphological changes in the IncuCyte real-time growth assay following PACAP stimulation ( Figs. 3 and 4 ), it appeared that high concentrations of PACAP-38 were stimulating mNSC differentiation into neurons. We therefore suggest that mNSC differentiation into neurons requires increased metabolic activity in the cells that do not undergo apoptosis during differentiation. Meanwhile, at concentrations of <500 nM, PACAP-38 appeared to stimulate mNSC proliferation rather than differentiation. Our use of physiological assays across a broad ligand concentration range therefore enabled 2 mNSC phenotypes mediated by PAC1—proliferation and differentiation—to be quantified and related to receptor pharmacology data from the signaling assays. The ability of the mNSCs to differentiate is another advantageous property that distinguishes them from CHO cells. The use of mNSCs not only extends the available repertoire of functional assay formats but also allows the study of the effects of differentiation on the signaling phenotype of the PAC1 receptor (not tested in this study). This flexibility of mNSCs could allow a screen to be run in differentiated cells to further increase physiological relevance.
Our work presented here was performed in mouse neural stem cells. However, there are differences in Ca2+ signaling downstream of PAC1 among stem cells. For example, activation of PAC1 stimulates Ca2+ signaling in embryonic neural stem cells 23 and postnatal stem cells from cortical brain regions. 6 These data contrast with our observations in stem cells from the postnatal hippocampus, suggesting that there are significant differences in either the PAC1 splice variant(s) expressed or the signaling machinery available to them, in neural stem cells at different developmental stages and/or from different brain regions. Such divergence in PAC1-mediated signaling presents additional complexities that are difficult to address with a recombinant cellular model.
In summary, we present evidence demonstrating that endogenous PAC1 signaling in mouse neural stem cells is considerably different from that mediated by the recombinant receptor in CHO cells. This is most likely due to differences in molecular phenotypes between the cells—that is, CHO cells do not normally express PAC1 and so may not be able to integrate signals transduced via the heterologous receptor, whereas PAC1 is essential to the biology of mNSCs. Although some of these differences may be due to the complexities of endogenous PAC1 signaling presented by the existence of different receptor splice variants (and combinations thereof), the issue of cellular background variability may represent a wider problem for screening recombinant 7TMRs, other than PAC1, to identify drug candidates. We believe that the use of mNSCs presents alternative screening opportunities for nervous system targets that can minimize the identification of false positives or negatives and the attendant attrition of drug candidates in the later stages of their development.