
Abstract
Third-party sustainability measures, such as ESG scores and rankings, are central to research linking corporate sustainability and financial performance. However, these measures lack transparency and vary significantly across providers, raising reliability concerns. This systematic review of 82 business journal articles (1995–2024) assesses how scholars engage with and critically assess these measures. We distinguish two sources of uncertainty that limit confidence in these measures: the quality of underlying data (accuracy, reliability, and timeliness) and how data are combined (fungibility assumptions and weighting schemes). Our analysis reveals that discussions of measurement quality are rare, while methodological rigor is bimodal—researchers either scrutinize multiple dimensions or none at all. We observe systematic associations between attention to measurement elements, data-provider choices, and reported financial performance. We argue that choices about measure quality and aggregation are not neutral but directly shape empirical findings and their interpretation. We outline practical recommendations to advance rigor and transparency in sustainability-performance research.
Introduction
Third-party sustainability measures, such as Environmental, Social, and Governance (ESG) scores, rankings, and composite indicators, are central to a major theme in corporate sustainability research: examining the relationship between corporate sustainability and financial performance (Burbano et al., 2024). Yet despite their widespread use, these measures face growing scrutiny over their reliability, comparability, and validity (Berg et al., 2022; Boiral et al., 2020, 2021; Busch et al., 2022; Chatterji et al., 2016; Delmas et al., 2013; Kotsantonis & Serafeim, 2019; Widyawati, 2021). These measures range from fully aggregated scores (e.g., Bloomberg ESG) to disaggregated metrics (e.g., Kinder, Lydenberg, Domini & Co. (KLD)/ Morgan Stanley Capital International (MSCI)’s binary strengths and concerns); we refer to them collectively as “sustainability measures” throughout this review. 1
Much of the criticism targets providers’ proprietary methods and limited disclosure regarding data sources, measurement approaches, and aggregation schemes. These concerns reflect long-standing problems in scientific measurement: all metrics have inherent technical and conceptual limitations. If left unacknowledged, these limitations foster false confidence (National Academies of Sciences, Engineering, and Medicine, 2017, 2019; van der Bles et al., 2019). Research shows that how uncertainty is communicated, or ignored, shapes policy use: downplaying uncertainty can mislead decision-makers and distort expectations (Dhami & Mandel, 2022; Fischhoff & Davis, 2014; van der Bles et al., 2019, 2020). These insights are especially relevant for third-party sustainability measures, where a lack of transparency leads researchers to unknowingly adopt the provider’s assumptions.
Despite these concerns, third-party measures remain a cornerstone of empirical sustainability research largely because viable alternatives are limited (Berg et al., 2022; Dimson et al., 2020; Kotsantonis & Serafeim, 2019). While some call for abandoning these measures (Tayan, 2022), others advocate for greater justification and transparency in their application (Berg et al., 2022; Kotsantonis & Serafeim, 2019). We therefore ask, to what extent and in what ways do scholars engage with and critically assess third-party measures of corporate sustainability when examining the relationship between sustainability and financial performance? Specifically, we examine two domains of measurement uncertainty: the quality of underlying data (whether it is accurate, reliable, and timely) and the methods used to aggregate that data (decisions about fungibility—whether different sustainability dimensions can be meaningfully combined—and weighting).
Existing reviews have examined sustainability measurement from stakeholder-specific perspectives—regulatory requirements (Christensen et al., 2021b), managerial decision-making (Grewal & Serafeim, 2020), and investor use (Frankel et al., 2025); none systematically assess how empirical business researchers engage with measurement uncertainty embedded in third-party data. This gap is consequential: while many reviews examine the sustainability–financial performance relationship with mixed results (Alshehhi et al., 2018; Busch & Friede, 2018; Endrikat et al., 2014; Huang, 2021; Kong et al., 2019; Van Beurden & Gössling, 2008), few examine how the inherent uncertainty of the metrics affects those evaluations. Even meta-analyses reporting positive associations (e.g., Friede et al., 2015) inherit limitations from primary studies reliant on uncertain metrics, and more recent syntheses warn that structural weaknesses in third-party metrics can make them ill-suited for certain contexts (Coelho et al., 2023; Damtoft et al., 2025). Coelho et al. (2023) and Damtoft et al. (2025) do not, however, examine how empirical researchers engage with these weaknesses in practice.
To systematically examine how researchers address measurement uncertainty, we develop an analytical framework that integrates complementary foundations from measurement science (Byerly & Lazara, 1973; Simpson, 1981), social science research on secondary data use (Calantone & Vickery, 2010; Stewart & Kamins, 1993), and environmental and sustainability accounting research that has long treated information quality as a prerequisite for accountability and decision usefulness (Lamberton, 2005; Schaltegger & Burritt, 2000). The latter tradition highlights a foundational problem in accounting: high-quality information reduces the asymmetry between managers and outside stakeholders, yet producing and verifying nonfinancial data remains exceptionally difficult and costly (Dechow et al., 2010; Healy & Palepu, 2001). As Schaltegger (1997) warns, this creates a systemic risk that poor-quality sustainability information will crowd out the good. We then connect these foundations to recent corporate sustainability scholarship by drawing on Berg et al. (2022), who show that divergence across ESG ratings stems from identifiable differences in scope, measurement, and aggregation—the same dimensions our framework is designed to interrogate—and on King and Berchicci (2021), who conceptualize researchers’ analytic choices as “forking paths.” Taken together, these literatures underscore that selecting a third-party sustainability measure is itself a consequential, yet underexamined, forking path because it imports provider-side assumptions about both data quality and aggregation into researchers’ designs. When those foundations go unexamined, the empirical structures built upon them rest on sand: findings that appear robust may instead reflect the unscrutinized choices of a data provider rather than the underlying reality of corporate sustainability.
Operationalizing these insights, our framework identifies five elements—accuracy, reliability, timeliness, fungibility, and weighting—that pinpoint where methodological assumptions enter research designs and potentially shape outcomes. Each element represents a distinct forking path: when researchers choose a third-party measure without interrogating its accuracy, reliability, timeliness, fungibility assumptions, or weighting scheme, they implicitly accept provider-side choices that may condition the direction and magnitude of their findings. We specified these elements prior to coding to reduce the researchers’ degrees of freedom and to ensure consistent evaluation across studies. The first three concern data quality, while the latter two concern how dimensions are combined. By applying this framework, we demonstrate that choices regarding measure quality and aggregation are not neutral but condition the outcomes scholars report.
To explore this, we analyze 82 peer-reviewed articles published between 1995 and 2024. Our aim is not to comprehensively review the literature on the sustainability–financial performance relationship (see, e.g., Chen et al., 2023; Coelho et al., 2023; Gillan et al., 2021); rather, we examine the measurement infrastructure underpinning their findings. Our analysis reveals that while sustainability measures are ubiquitous, most studies pay limited attention to their underlying construction. Few articles critically assess key elements such as accuracy, reliability, timeliness, fungibility, or weighting, and even fewer examine how these elements might affect empirical outcomes. This lack of scrutiny is concerning, given the opacity of third-party methodologies. Notably, engagement with one element, such as accuracy, tends to coincide with attention to others. Moreover, measurement choices are systematically associated with the direction and framing of reported results, underscoring that these decisions are not merely technical but substantively consequential.
The article proceeds as follows. We begin by presenting our framework, which highlights the key elements where methodological assumptions enter research designs and shape empirical results. Next, we detail our review methods, followed by results examining how these elements relate to methodological choices and reported outcomes. We conclude with recommendations to improve rigor and transparency in the use of third-party sustainability measures.
Quality and Aggregation Challenges in Sustainability Measures
Third-party sustainability measure providers typically rely on proprietary, opaque data collection and aggregation methodologies (Kotsantonis & Serafeim, 2019). As a result, researchers using these measures face two main domains of uncertainty. The first, measuring quality uncertainty, concerns the credibility of the underlying data and encompasses issues of accuracy, reliability, and timeliness (Boiral et al., 2020, 2021). The second, aggregation uncertainty, stems from combining individual indicators into composite scores, raising issues of fungibility and weighting (Chatterji et al., 2016; Widyawati, 2020, 2021). Drawing on information quality literature (Byerly & Lazara, 1973; Nelson et al., 2005; Rabinovich, 2005; Simpson, 1981; Wang & Strong, 1996), we emphasize that both the input quality and aggregation methods determine whether measures support valid conclusions. This aligns with accounting research showing that sustainability information differs fundamentally from traditional financial information. Specifically, sustainability information is multidimensional (encompassing ESG dimensions that may not be naturally comparable), involves externalities (capturing impacts on stakeholders beyond firm boundaries), and serves heterogeneous users (investors, regulators, employees, and communities) with divergent information needs (Bebbington & Larrinaga, 2014; Unerman et al., 2018). These characteristics mean that decisions about data quality and aggregation methods are not secondary technical matters but first-order determinants of whether sustainability measures can meaningfully inform decision-making (Christensen et al., 2021a; Friedman & Ormazabal, 2024).
These uncertainties manifest in various ways. Inconsistent collection and reporting standards undermine accuracy and reliability (Berg et al., 2022; Busch et al., 2022), while reporting delays and horizon discrepancies affect timeliness (Delmas, Doctori-Blass, 2010). Fungibility, or treating different sustainability measures as interchangeable, can obscure firm-specific weaknesses (Capelle-Blancard & Petit, 2017; Munda & Nardo, 2005). Prior reviews note that such aggregation practices fuel persistent disagreement among third-party measures and blur the distinction between financially material and immaterial sustainability issues (Friedman & Ormazabal, 2024; Grewal & Serafeim, 2020). In addition, third-party providers often assign weights based on subjective judgments, introducing bias and misalignment with stakeholder expectations (Capelle-Blancard & Petit, 2017; Gan et al., 2017; Greco et al., 2019). Aggregation and weighting schemes often reflect provider incentives and constraints rather than financial materiality, further complicating interpretation by users (Friedman & Ormazabal, 2024). Together, these five elements capture the two principal entry points for uncertainty: the quality of the data inputs and the aggregation of those inputs into composite scores. Table 1 summarizes the definitions and scholarly grounding of these five elements.
Elements of Measure and Aggregation Quality.
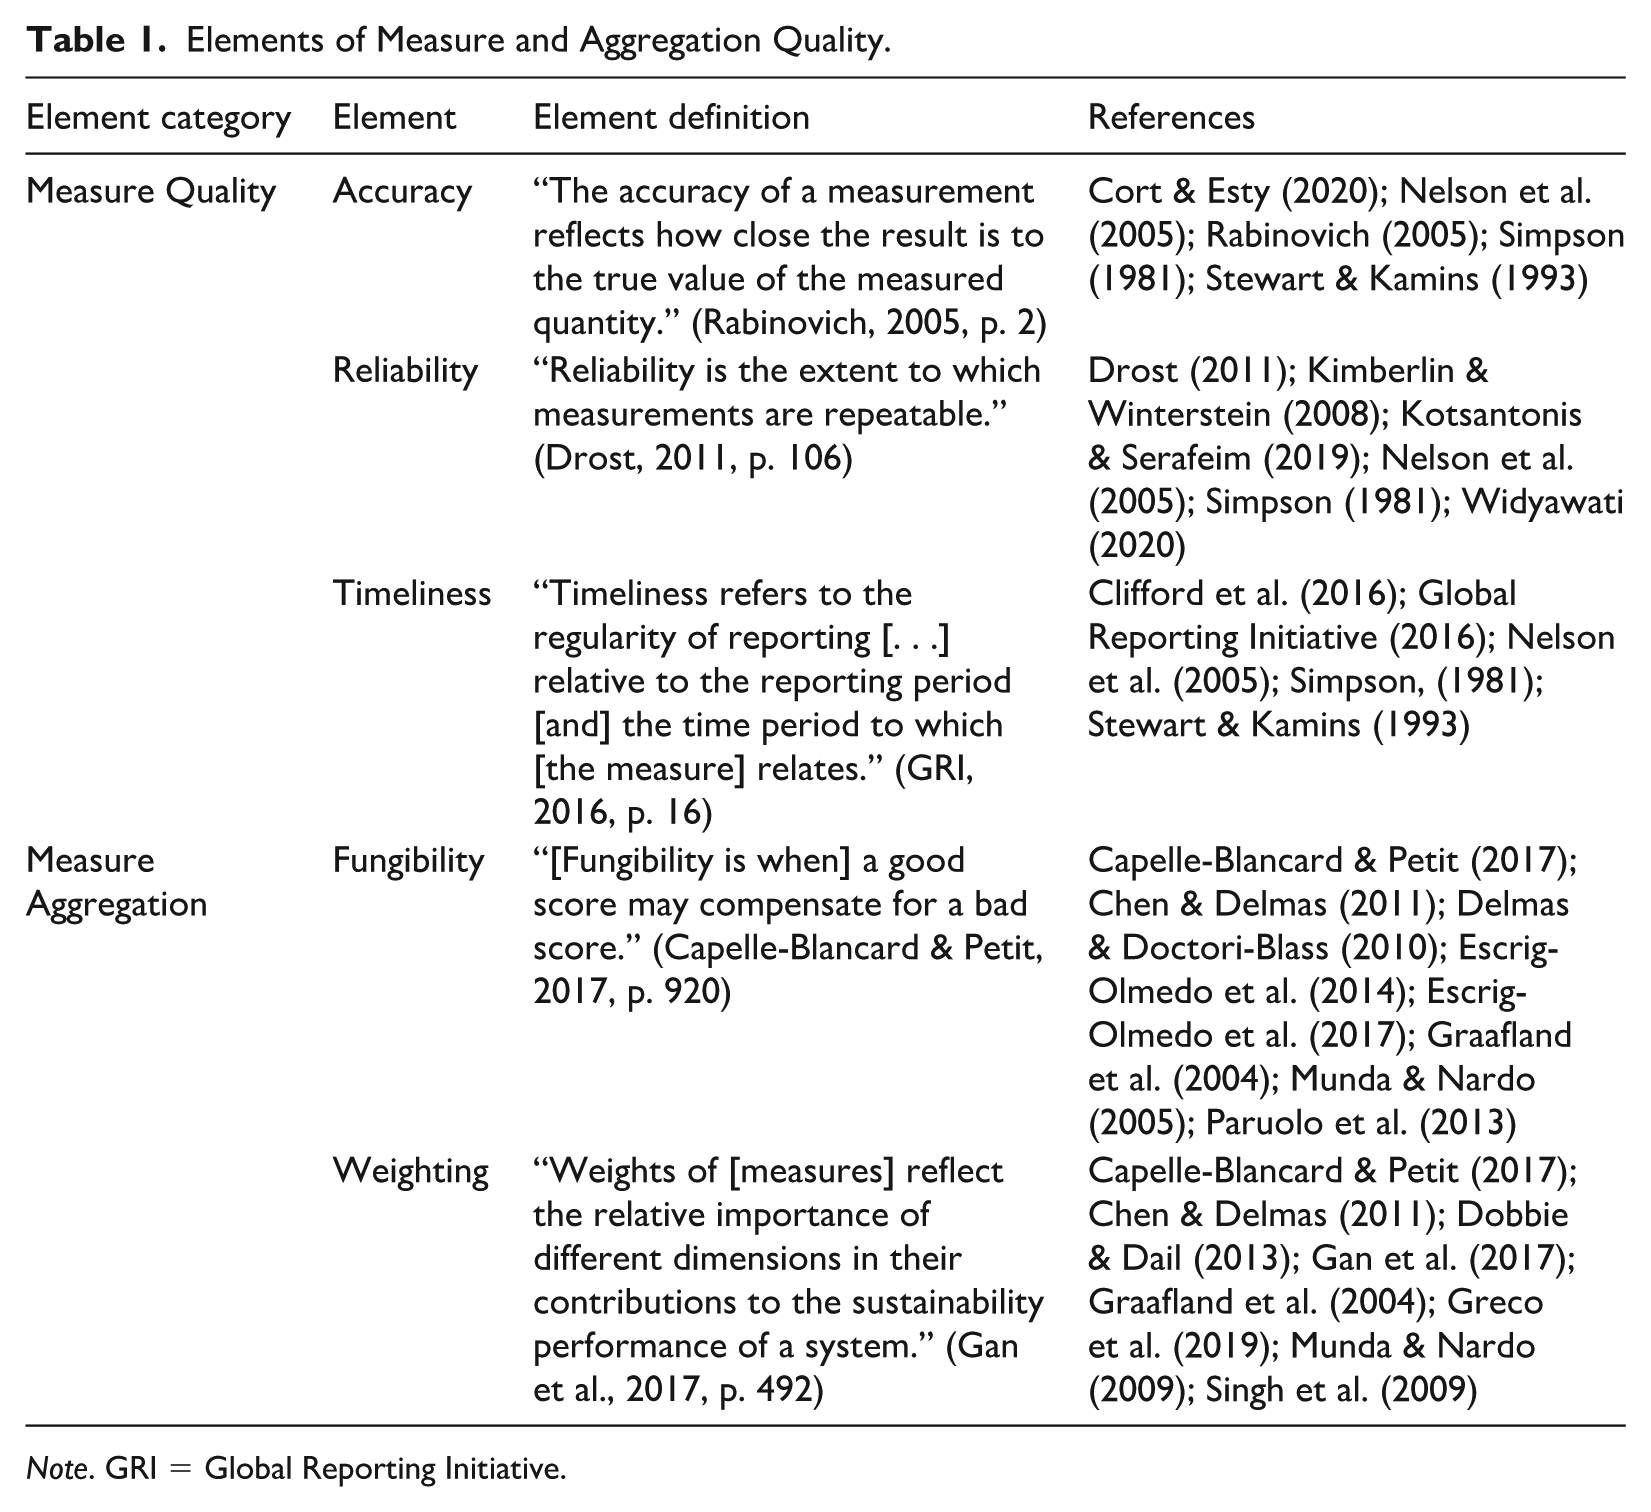
Note. GRI = Global Reporting Initiative.
We investigate how business research acknowledges or assesses these five elements when using third-party sustainability measures. In doing so, we illuminate prevailing practices in the literature and identify opportunities to enhance the rigor and transparency of research relying on these measures.
Sustainability accounting scholars have long argued that nonfinancial information poses distinctive quality challenges that conventional accounting frameworks are ill-equipped to handle. Unlike financial data, sustainability information is multidimensional, difficult to verify, and serves a heterogeneous audience of investors, regulators, employees, and communities with divergent needs (Bebbington & Larrinaga, 2014; Unerman et al., 2018). It frequently relies on estimates, self-reported disclosures, and unverifiable proxies, and it captures externalities—impacts on parties beyond the firm—that fall outside traditional accounting boundaries (Gray, 2010). These characteristics mean that quality cannot be assessed through a single lens: a measure may be timely but inaccurate or comprehensive but aggregated in ways that obscure material weaknesses.
Sustainability accounting research has responded by articulating information quality through a set of qualitative characteristics—most notably relevance (including materiality) and faithful representation, supported by comparability, verifiability, timeliness, and understandability (Bebbington & Larrinaga, 2014; Lamberton, 2005; Schaltegger & Burritt, 2010). Yet scholars have long questioned whether these frameworks can adequately capture sustainability performance, given the treatment of externalities, temporal horizons, and stakeholder plurality they require (Gray, 2010; Unerman et al., 2018). Third-party sustainability measures operationalize only part of this ideal: providers must generate credible inputs, apply standardized data-collection and estimation procedures, and enable comparability across firms (Boiral et al., 2020). 2 These challenges make the quality of third-party sustainability measures especially consequential for empirical research. In this review, we focus on the subset of quality characteristics most directly at stake when researchers select and use such measures: (1) the accuracy and reliability of inputs (e.g., audited data vs. model-based estimates), (2) the timeliness of measurement windows, and (3) the aggregation logic—including fungibility and weighting—used to construct composite outputs. We do not evaluate whether a measure captures the “right” impacts for a given industry or reflects sufficient stakeholder materiality. For example, Greenhouse Gas (GHG) emissions may be less material than data privacy controls for software firms; our concern is not whether GHG emissions are the “correct” sustainability metric in that context, but whether a third-party GHG score used in research rests on credible inputs or potentially inaccurate estimation models. Ultimately, we examine the extent to which scholars interrogate these technical foundations—specifically, whether they acknowledge and account for the inherent uncertainties of measurement and aggregation.
Elements of Measure Quality: Accuracy, Reliability, and Timeliness
Measurement science distinguishes three related but distinct properties: accuracy (closeness to the true value), reliability (repeatability across measurements), and validity (whether a measure captures the construct it purports to represent) (Byerly & Lazara, 1973; Rabinovich, 2005; Simpson, 1981). For composite sustainability scores, validity is arguably the most fundamental concern: a score may be internally consistent—that is, reliable—yet still fail to represent corporate sustainability meaningfully if its scope is arbitrarily defined, its indicators poorly chosen, or its aggregation logic theoretically unjustified (Chatterji et al., 2016; Delmas et al., 2013). We focus on accuracy and reliability as the operationalizable elements of data quality that researchers can interrogate using available information, while recognizing that the construct validity of third-party scores is a prior and largely unresolved question. This connects directly to Berg et al.’s (2022) finding that divergence across ESG ratings stems from scope, measurement, and aggregation differences: scope decisions determine what the measure purports to represent (a validity question), measurement decisions determine how faithfully underlying data are captured (an accuracy and reliability question), and aggregation decisions determine how dimensions are combined (a fungibility and weighting question). Together, these sources of divergence map onto the five elements of our framework and explain why selecting a third-party measure is itself a consequential methodological choice. These are critical concerns for all research relying on secondary data, particularly data “collected by someone else for another primary purpose” (Johnston, 2017, p. 619). Stewart and Kamins (1993) warn that “[n]ot all information obtained from secondary sources is equally reliable or valid” (p. 17), urging researchers to remain skeptical of data quality and assess the potential impact on their analysis.
These concerns are magnified in the sustainability context, where measurement often relies on estimates, self-reported data, and unverifiable proxies, making verification difficult (Friedman & Ormazabal, 2024; Grewal & Serafeim, 2020). Because high-quality environmental information is costly to produce and difficult for external stakeholders to assess, there is a systemic risk that poor-quality information will overshadow the good (Schaltegger, 1997). Inaccurate or unreliable sustainability measures can lead to flawed conclusions about the relationship between sustainability performance and corporate financial performance (CFP). Berg et al. (2022) report that 56% of the variation among sustainability measures arises from differences in how third-party providers define and measure underlying metrics. This variation reflects “noisy measures of an underlying latent quality” (Berg et al., 2022, p. 1330) and can be amplified by reliance on estimates (Busch et al., 2022). Prior reviews interpret this as evidence that greater disclosure does not necessarily improve measurement quality or comparability, particularly when metrics lack standardized definitions or verifiable measurement protocols (Christensen et al., 2021a; Grewal & Serafeim, 2020). Users thus face challenges in discerning variations in accuracy (Cort & Esty, 2020; Kotsantonis & Serafeim, 2019), while opacity in data collection and aggregation exacerbates uncertainty around reliability (Widyawati, 2020). These quality deficiencies limit researchers’ ability to distinguish signal from noise, even when data are publicly available (Christensen et al., 2021b).
The third key element is timeliness, defined by Global Reporting Initiative (GRI; 2016, p. 16) as “the regularity of reporting [. . .] relative to the reporting period [and] the period to which [the measure] relates.” Timeliness requires clarity about the timeframe represented and ensuring consistency across all underlying metrics. For example, while Scope 1 and 2 GHG emissions may correspond to the stated reporting year, Scope 3 emissions may rely on data from prior years. Such temporal discrepancies can influence the predictive validity of an analysis (Clifford et al., 2016; Nelson et al., 2005; Stewart & Kamins, 1993). These mismatches reflect structural challenges in sustainability reporting, where long horizons, supply-chain complexity, and estimation requirements make contemporaneous measurement difficult (Christensen et al., 2021a; Friedman & Ormazabal, 2024). Consequently, analysts must contend with the risk that sustainability data aligned with financial outcomes actually describes earlier periods, complicating causal claims.
Although researchers often align measures with the publication year, firms typically base their data on performance from earlier periods (Delmas et al., 2022). Establishing the precise timing of variables is critical for causal inference. For instance, if a 2025 sustainability measure reflects 2024 performance, lagging the measure to analyze effects on 2025 financial performance could create a 2-year gap, potentially leading to inaccurate conclusions. These challenges reinforce broader concerns that sustainability disclosures may fail to support reliable inference when measurement noise and temporal misalignment are not explicitly addressed (Christensen et al., 2021a; Frankel et al., 2025).
Elements of Aggregation: Fungibility and Weighting
Aggregation methods form the second major domain of uncertainty. Fungibility and weighting are not neutral technical choices; they embody assumptions about trade-offs and priority among sustainability dimensions. When these assumptions remain opaque or untested, they introduce aggregation uncertainty, which can strongly influence empirical results. Prior work in sustainability accounting warns that aggregation practices often lack clear decision-making relevance, risking the reduction of sustainability metrics to symbolic artifacts rather than durable analytical tools (Burritt & Schaltegger, 2010).
Fungibility refers to treating different metrics as interchangeable, allowing strong performance in one area to compensate for poor performance in another (Capelle-Blancard & Petit, 2017, p. 920). In sustainability metrics, fungibility enables overperformance in one domain to offset underperformance in another (Escrig-Olmedo et al., 2017; Graafland et al., 2004). For example, a company might mask poor environmental performance, such as excessive resource consumption, by excelling in social performance. This compensatory logic can obscure deficiencies or incomplete disclosures, complicating interpretation (Berg et al., 2022; Capelle-Blancard & Petit, 2017; Delmas, Doctori-Blass, 2010; Escrig-Olmedo et al., 2014). Aggregating extensive but potentially symbolic disclosures into composite measures may create metrics that appear comprehensive while masking substantive performance gaps (Michelon et al., 2015). Prior reviews caution that such aggregation blurs distinctions between financially material and immaterial sustainability issues (Christensen et al., 2021a; Grewal & Serafeim, 2020). Consequently, highly aggregated measures often obscure the specific drivers of the overall sustainability rating. This demonstrates how fungibility injects uncertainty: by permitting compensation across domains, measures may hide weaknesses material to stakeholders while inflating confidence in composite scores. Early scholarship emphasized that combining indicators involves inherent trade-offs, warning that metrics lose interpretability when these assumptions remain implicit (Figge et al., 2002).
Weighting similarly shapes the construction and interpretation of sustainability measures, as it assigns “the relative importance of different dimensions in their contributions to [. . .] sustainability performance” (Gan et al., 2017, p. 492). Lacking a single objective function for sustainability performance, weighting schemes necessarily reflect normative judgments about importance rather than purely technical considerations (Friedman & Ormazabal, 2024). Weighting may reflect materiality considerations, stakeholder preferences, or an equal-weighting approach (Gan et al., 2017; Singh et al., 2009). Crucially, the choice of scheme determines the extent to which individual metrics compensate for one another. Research demonstrates that even minor weight adjustments can significantly alter measures (Chen & Delmas, 2011). When weights are undisclosed or unjustified, aggregation uncertainty increases: small methodological changes can change effect sizes, significance, and even sign. Such opacity complicates assessments of whether measures capture relevant information or merely encode provider-specific preferences (Frankel et al., 2025).
However, third-party providers often lack transparency about their aggregation methods. For example, Bloomberg offers only a brief two-page overview of its methodology (Bloomberg, n.d., 2021). This opacity forces researchers to make assumptions about fungibility and weighting, introducing uncertainty and potential bias. Without clear information on how providers combine and weight metrics, assessing the validity of measures and the robustness of conclusions becomes a significant challenge (Berg et al., 2022; Boiral et al., 2020). Increased disclosure does not resolve this issue; instead, it may create an illusion of precision when underlying construction choices remain hidden (Christensen et al., 2021a; Grewal & Serafeim, 2020).
Just as accuracy, reliability, and timeliness capture measure quality uncertainty, fungibility and weighting encapsulate aggregation uncertainty. In both domains, uncertainty is embedded in the sustainability metrics rather than arising only from downstream statistical analysis.
Methods
This review follows the systematic review approach defined by Grant and Booth’s (2009) typology and adheres to the PRISMA (Preferred Reporting Items for Systematic Reviews and Meta-Analyses) 2020 guidelines (Page et al., 2021; Panic et al., 2013) to ensure transparency and reproducibility.
Search Method
We searched the Web of Science and ProQuest databases for articles published in English between 1995 and 2024. These databases offer comprehensive coverage of high-quality journals in business, management, economics, and environmental studies and are commonly used in systematic literature reviews within these fields. We limited our search to journals indexed under the following categories: “Business,” “Management,” “Business Finance,” “Operations Research Management Science,” “Economics,” “Environmental Studies,” “Environmental Sciences,” or “Green Sustainable Science Technology.” Articles published in practitioner outlets, book chapters, conference proceedings, dissertations, and non–peer-reviewed sources were excluded.
To define our keyword search, the research team first identified pivotal literature that examined the causal relationship between sustainability measures and CFP. These seminal articles served as an anchoring set against which candidate search terms were evaluated for relevance and coverage. This body of work informed the initial list of keywords used. Given the evolution and breadth of corporate sustainability research, spanning decades and employing a diverse, inconsistent vocabulary and disciplinary traditions, establishing a targeted, theoretically grounded keyword set was an essential early step. The field’s vocabulary has undergone significant shifts over time: early literature often referred to “corporate social responsibility” (CSR), “social performance,” or “triple bottom line,” while more recent research uses terms like “ESG performance,” “sustainability ratings,” or “nonfinancial disclosures.” Some terms have become more narrowly defined (e.g., ESG as an investment screening tool), while others have broadened or blurred in scope. In addition, certain concepts like “stakeholder engagement,” “responsible business,” or “sustainability performance” may be used interchangeably in some contexts and distinctly in others.
This terminological inconsistency creates two risks: including irrelevant articles or missing relevant ones. Without anchoring to key papers, we would have needed hundreds of search terms to identify relevant work. To refine our approach, we conducted multiple rounds of iterative searches, beginning with broader keyword combinations and progressively narrowing the search string. At each iteration, we assessed whether the search results consistently captured the anchoring articles while minimizing the inclusion of clearly irrelevant studies. This process was conducted primarily in the Web of Science database due to its transparent indexing and reproducibility of search strings.
The final keyword string (see Appendix 1) included terms identified as foundational in the field: “Corporate Social Performance” (CSP), “Corporate Environmental Performance” (CEP), and “CSR.” These terms were among the most frequently used in corporate sustainability research between 1994 and 2021, according to a comprehensive bibliometric analysis by Burbano et al. (2024). We also included “ESG” to reflect the term’s prominence in finance and investment research (Chytis et al., 2024; Friede et al., 2015). 3 We applied search strings to article titles, abstracts, and keywords. To further focus the search on empirical studies linking sustainability to financial outcomes, we added “Financial Performance” and “Shareholder Value” to the search string. We limited our search to those published between 1995 and 2024. Preliminary searches indicated that extending the range earlier did not yield additional relevant articles, and influential early work in this domain (e.g., Waddock & Graves, 1997) emerged shortly thereafter.
The Web of Science search returned 4,535 articles, and the ProQuest search returned 2,706 articles. After merging the two datasets, duplicate records were removed. To screen for journal quality, we included journals with a 2022 Journal Citation Indicator (JCI) score of 1.0 or higher. A JCI score above 1.0 indicates that a journal has more citations than the average of journals in the same academic categories (Szomszor, 2021). We also included journals with a 3, 4, or 4* rating, indicating “Highly Regarded,” “Top,” and “World Elite” journals, according to the Association of Business Schools (ABS) 2021 Academic Journal Quality Guide, as well as journals with an “A” or “A*” rating, indicating “Highly Regarded” and “Best or Leading” journals, in the Australian Business Deans Council (ABDC) 2023 Journal Ranking. Journals that did not meet at least one of these quality thresholds were excluded from further consideration. Both journal rating groups are considered two of the top lists for business literature (Harzing, 2023), and this screening approach has been employed in prior literature reviews (Damtoft et al., 2025). After removing duplicates and screening for journal quality, 714 articles remained and were advanced to content-based screening.
We selected articles using sustainability measures as an independent variable and one of four common measures of CFP: Return on Assets (ROA), Marginal Value Added (MVA), Tobin’s Q, and cumulative abnormal return (CAR). This selection follows Berchicci and King (2022), who utilized these metrics to investigate the effects of measurement uncertainty on highly influential sustainability studies. Narrowing our scope to these specific metrics facilitates a more direct and meaningful comparison among the reviewed articles. While this focus necessarily limits the total number of in-scope articles, there is no a priori reason to assume that studies using alternative performance indicators would be systematically more or less rigorous in their consideration of the quality of sustainability measures.
Using these screens, we identified 82 in-scope articles for complete data extraction (see Appendix 2 for the screening flowchart and Appendix 3 for the final sample). Two additional articles identified by the research team as key works were added to the screening set of articles (indicated in Appendix 3 with an “*”). The keyword search string did not capture these articles, as their abstracts use more generic terms than those in our keyword search. Both were identified through prior work that was central to the development of our review, specifically Berchicci and King (2022) and Delmas et al. (2013). This approach yielded a representative set of influential studies published in highly regarded journals, enabling systematic analysis of how the field discusses third-party sustainability measures rather than attempting an exhaustive survey of all sustainability–CFP research.
Data Extraction
The data-extraction grid covered four main areas: firm characteristics, statistical analysis, outcomes, and the measurement quality and aggregation elements (see Appendix 4). Firm characteristics included country, region, sector, and the analysis time range. Statistical analysis information included descriptive statistics of the sustainability measure, the frequency, and names of measure providers; the ESG areas of the measures (e.g., those covering social, environmental, and/or governance aspects of corporate sustainability); and the statistical approach, along with its outcomes.
We coded each article for three quality elements (accuracy, reliability, and timeliness) and two aggregation elements (fungibility and weighting), as summarized in Table 1. To capture substantive engagement beyond exact terminology, we coded elements as present whether explicitly named, described with synonyms, or implicitly operationalized. For example, we coded reliability as present if authors discussed data “precision,” “consistency,” or “verification.” We coded fungibility as implicitly present when authors described aggregation methods that treated positive and negative performance as interchangeable, such as subtracting “concerns” from “strengths” in KLD scores.
Data Synthesis
To synthesize the extracted data, we followed a two-step process. First, we categorized the study scope, third-party sources, and statistical models. We also recorded the statistical details on the relationship between the sustainability measures (independent variable) and financial measures (dependent variable), including direction, magnitude, and significance. Second, we conducted a thematic and descriptive analysis of the uncertainty elements (see Table 1 and Appendix 4).
Results
We begin with a high-level overview of the 82-article sample, followed by a detailed exploration of how the five key elements of our framework—accuracy, reliability, timeliness, fungibility, and weighting—are addressed and how they relate to provider choice and reported statistical outcomes. While the search included articles published between 1995 and 2024, more than 50% of the articles in our sample were published in 2019 or later.
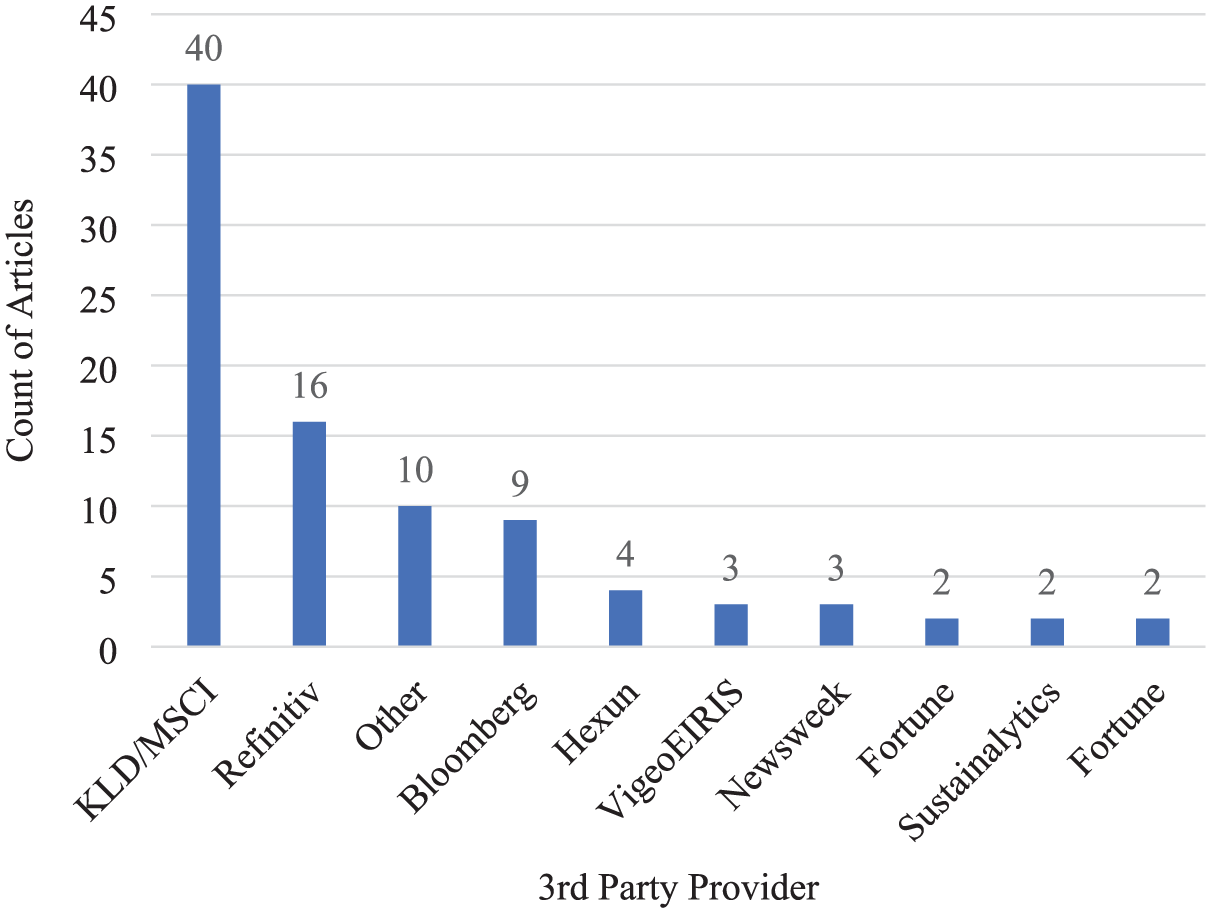
Reliance on third-party providers varied. Eighteen different sources were used, the most common being KLD/MSCI (purchased by MSCI in 2010), Refinitiv (formerly of Thomson Reuters, and now part of the London Stock Exchange Group, LSEG), and Bloomberg ESG (see Figure 1). The KLD/MSCI dominated before 2015, while other providers gained traction more recently. Most articles (91%) relied on a single provider. Seventy-two percent employed sustainability measures that encompassed ESG dimensions, while the remaining articles focused on only one or two dimensions—most often (28%) excluding governance.
Next, we examine whether and how provider choice relates to reported statistical outcomes. Table 2 summarizes the direction and significance of the reported relationships between sustainability measures and CFP.
Summary of Scales and Reported Ranges of Third-Party Scores Used.
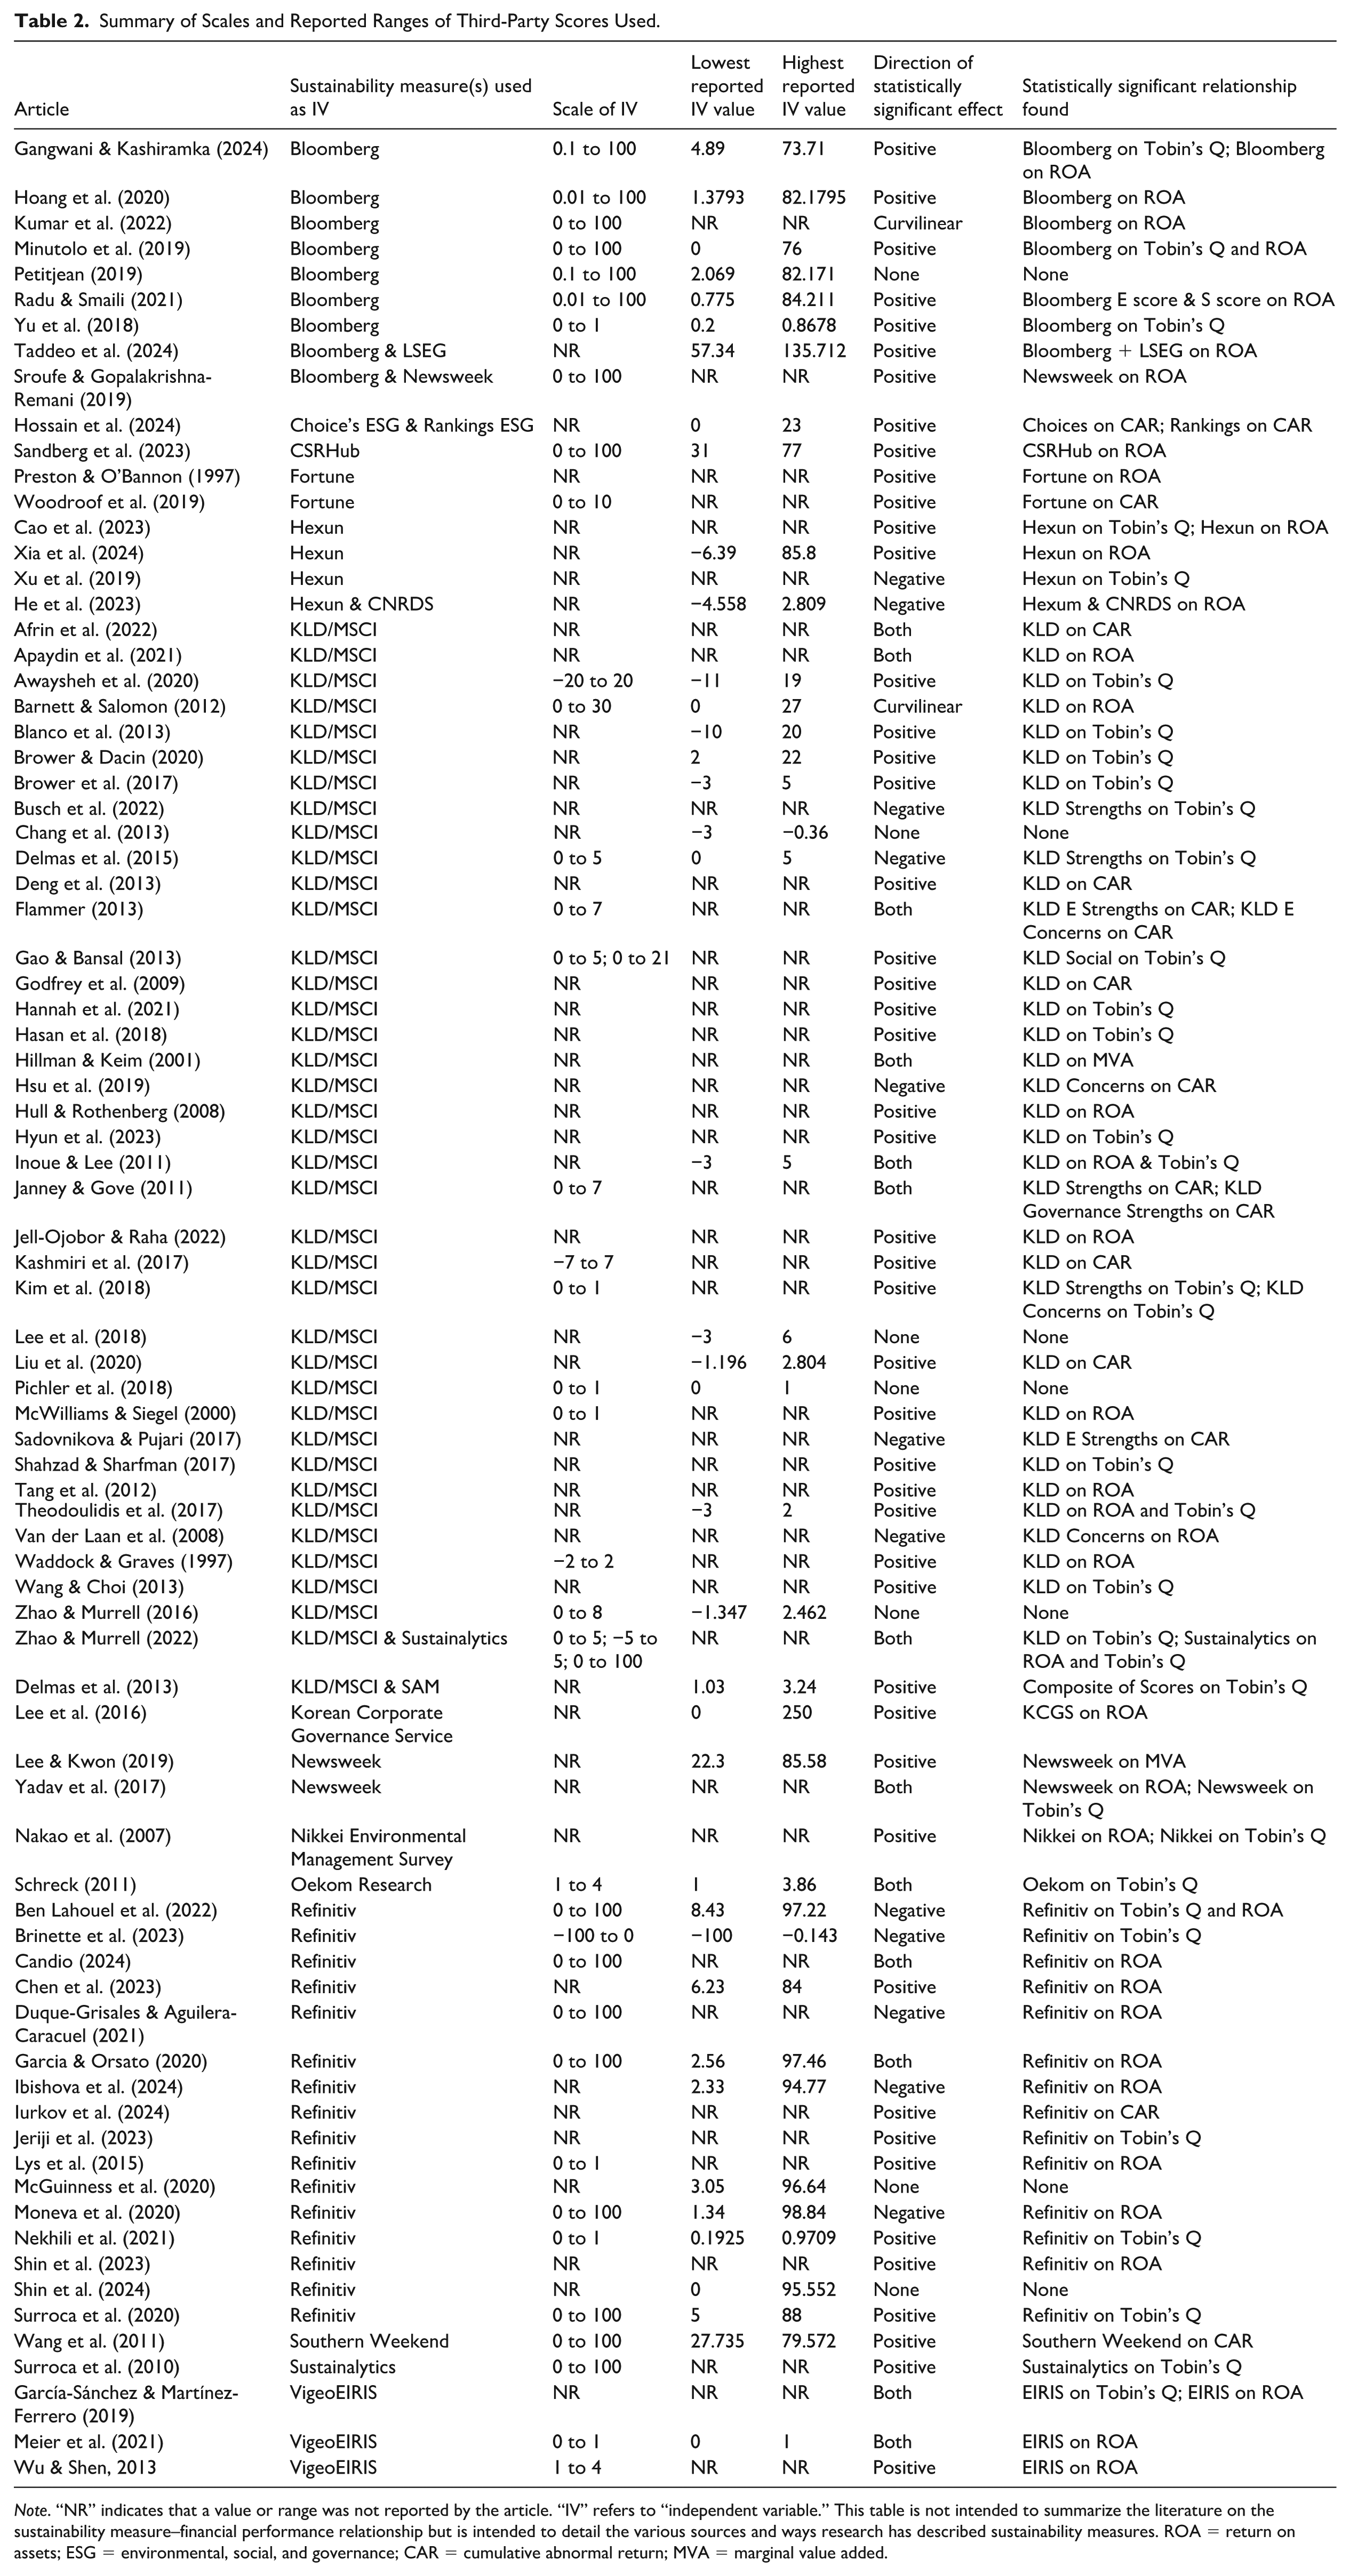
Note. “NR” indicates that a value or range was not reported by the article. “IV” refers to “independent variable.” This table is not intended to summarize the literature on the sustainability measure–financial performance relationship but is intended to detail the various sources and ways research has described sustainability measures. ROA = return on assets; ESG = environmental, social, and governance; CAR = cumulative abnormal return; MVA = marginal value added.
The majority of studies (59%) report only a positive and statistically significant relationship between sustainability measures and CFP. In contrast, 15% report only a negative relationship, and 9% find no significant effect. Notably, 18% of studies report both positive and negative effects, often due to disaggregated analyses across sustainability dimensions or the presence of nonlinear relationships. This distribution underscores both the predominance of positive findings and the heterogeneity in reported effects. Mixed (both positive and negative) results occur mainly in KLD/MSCI-based and VigeoEIRIS-based research, indicating that aggregation choices (e.g., how “strengths” offset “concerns”) could shape observed effect patterns. In contrast, Bloomberg and Refinitiv measures overwhelmingly yield unidirectional findings, with only a handful of papers documenting curvilinear relationships (e.g., Barnett & Salomon, 2012; Kumar et al., 2022).
Table 2 also shows considerable variation in how third-party sustainability scores are scaled and reported across the 82 studies. Most providers (e.g., Bloomberg, Newsweek, Sustainalytics, and CSRHub) use a 0 to 100 scale, but reported values often fall within a narrower range (e.g., Bloomberg scores 0–100, with observed minima around 2–5 and maxima below 85), raising the possibility of floor or ceiling effects. Other measures use 0 to 1 scales (e.g., Refinitiv and VigeoEIRIS), while KLD/MSCI’s disaggregated “strengths” and “concerns” scores span −20 to +20, and Fortune rankings use a 0 to 10 scale. This lack of standardization in both scaling and observed ranges complicates cross-study comparability.
Engagement with the framework elements also varied. Only a small fraction of the 82 reviewed articles addressed accuracy (24%), reliability (28%), or timeliness (6%), whereas weighting (59%) and fungibility (53%) received far greater attention. We coded each article to indicate whether it discussed the five elements (1/0), and we calculated φ correlation coefficients to examine the relationships among the elements, the statistical outcomes, and the sustainability measures used (see Table 3).
φ Coefficient of Elements, Statistical Outcomes, and Measure Providers (N = 82).
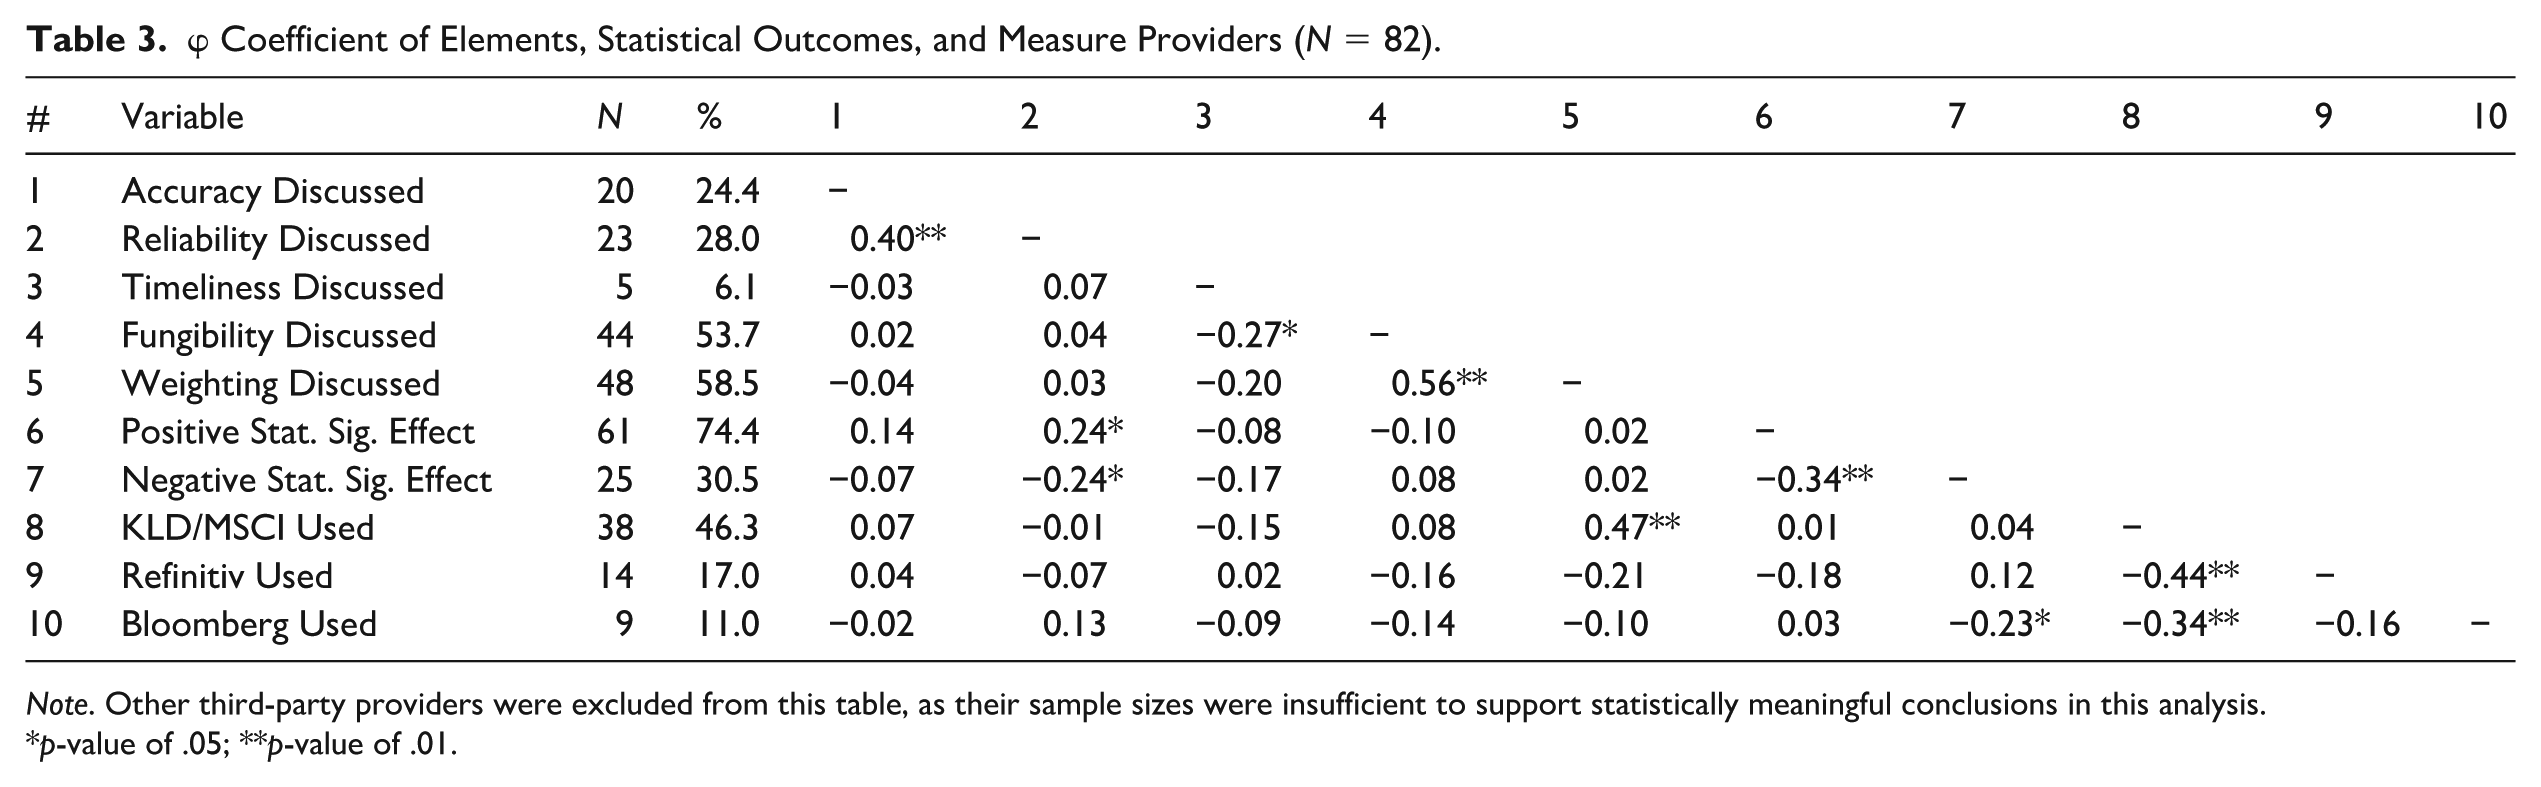
Note. Other third-party providers were excluded from this table, as their sample sizes were insufficient to support statistically meaningful conclusions in this analysis.
p-value of .05; **p-value of .01.
The analysis reveals two clusters among measurement-quality elements. Articles discussing accuracy are 10.5 times more likely to also discuss reliability (OR = 10.5, χ² = 9.8, p = .002), while fungibility discussions strongly align with weighting discussions (φ = .56, p < .01). These clusters indicate a systematic divide: researchers either approach third-party data with comprehensive skepticism—addressing multiple quality dimensions simultaneously—or treat it as validated input requiring minimal scrutiny.
Emphasis on reliability is positively associated with reporting statistically significant positive effects (φ = 0.24, p < .05) and inversely with reporting negative effects (φ = −0.24, p < .05), while timeliness shows negative associations with fungibility discussions (φ = −0.27, p < .05). Studies relying on KLD/MSCI data are far more likely to engage in weighting discussions (φ = 0.47, p < .01). Bloomberg-based research reports fewer negative effects (φ = −0.23, p < .05). Overall, these associations indicate that conceptual emphases (which elements authors discuss) and methodological choices (which provider they use) covary with the direction of reported effects. This reinforces our core argument: measure choices are not neutral, so their implications and limitations should be examined in studies that use them.
Measure Quality
Despite their importance, discussions of measurement quality were rare: only 24% addressed accuracy, 28% reliability, and 6% timeliness. When mentioned, these elements were typically brief justifications for data choice, not rigorous assessments of the measures’ actual quality. For example, some articles cited reliability as a rationale for using a given dataset but did not explain why reliability was critical to their analysis (e.g., Blanco et al., 2013; Gao & Bansal, 2013; Oikonomou et al., 2014; Petitjean, 2019). Illustrative statements include describing KLD data as “more objective” due to independent aggregation (Blanco et al., 2013, p. 70) or claiming Bloomberg ESG data are entirely “transparent back to a company document” (Petitjean, 2019, p. 504).
Only 10 articles discussed potential limitations related to reliability or accuracy—a striking gap given that 56% of variation among ESG measures stems from provider differences (Berg et al., 2022). Gao and Bansal (2013) noted that “KLD data [is] limited [. . .] due to the binary nature of the variables” (p. 252), while Duque-Grisales and Aguilera-Caracuel (2021) observed that the Refinitiv measure “is not free of subjective influences” (p. 330). However, most articles did not state their assumptions about data quality, raising questions about the validity of their statistical findings. This omission is especially consequential when results are borderline significant: among articles reporting statistically significant results, 17% reported p-values between .05 and .10 (i.e., meeting a p < .10 threshold but not the conventional p < .05 standard). A comparison of two studies illustrates how engagement with quality varies even among similar research designs. Lee et al. (2016) and Gangwani and Kashiramka (2024) both examined the relationship between sustainability measures and ROA, reporting significant associations at the 0.10 level only. Lee et al. (2016) explicitly discussed the construction and reliability of their Korean Corporate Governance Service (KCGS) data. In contrast, Gangwani and Kashiramka (2024) did not discuss the accuracy or reliability of Bloomberg’s data. It is therefore impossible to assess whether a minor inaccuracy in the Bloomberg data would change their conclusions.
Temporal alignment is rarely scrutinized. Although over 45% of articles employed lagged sustainability measures in their analyses, only five explicitly addressed timeliness. These five varied in approach: Pichler et al. (2018) justified their temporal framing based on data availability constraints, while Sandberg et al. (2023) focused on the public release date of a measure—when it becomes accessible to investors—rather than the performance period it reflects. Only Sandberg et al. (2023) explicitly justified their lag choice based on the period represented by the measures. Most studies seem to assume that sustainability measures are contemporaneous, with little scrutiny of how well the timing of sustainability and financial performance variables aligns. Preston and O’Bannon (1997) and Nakao et al. (2007) addressed this uncertainty by running models with both lagged and contemporaneous specifications.
Neglecting timeliness undermines longitudinal designs, which comprised over 95% of the sample. Researchers may assume that year-to-year changes in sustainability measures reflect actual shifts in firm performance. Yet variation may instead result from changes in providers’ methodologies (Albuquerque et al., 2019; Harrison et al., 2023) or from inherent instability (Awaysheh et al., 2020). Conversely, KLD/MSCI measures have exhibited limited variability over time, presenting a different timeliness challenge (Chatterji et al., 2009) that few studies explicitly address (see Table 2). While Waddock and Graves (1997) note that “KLD staff members meet on a weekly basis [. . .] to assure that decisions [. . .] are being made consistently,” such endorsements rarely address potential consequences for studies using that data (p. 308). Overall, discussions of accuracy, reliability, and timeliness were brief and seldom integrated into research design.
Measure Aggregation
Aggregation decisions—particularly fungibility and weighting—embody normative assumptions about trade-offs among sustainability dimensions, making substantive engagement with these elements essential for transparent research. The results are mixed. Seventy-two percent of studies relied on aggregated measures, raising questions about construct validity and aggregation logic, and engagement was higher than for measure quality elements: 59% of articles discussed weighting, and 54% addressed fungibility. These discussions typically appeared in the methods sections, focusing on weighting choices (commonly equal weighting or proprietary formulas) and decisions about whether to combine dimensions (e.g., using a composite ESG score vs. separate E, S, and G scores). Even when aggregation was discussed, authors often treated it as a procedural choice rather than as a set of substantive assumptions about trade-offs among sustainability dimensions.
Most studies discussing weighting relied on unjustified equal weighting (see Figure 2). Some researchers, such as García-Sánchez and Martínez-Ferrero (2019), explicitly noted that equal weighting assumes all metrics are equally important, an assumption rarely empirically validated. Waddock and Graves (1997) and Zhao and Murrell (2016) established weights via “expert opinion” surveys. In addition, 25% of the articles referencing weighting cite third-party providers that use proprietary schemes, such as Bloomberg ESG’s industry-group weighting, without providing methodological details (e.g., Radu & Smaili, 2021; Yu et al., 2018). Notably, articles using KLD/MSCI sustainability measures were more likely to engage in discussions about weighting (see Table 2), likely due to the disaggregated structure of KLD/MSCI data, because this forces researchers to make explicit decisions regarding fungibility (e.g., whether to combine “strengths” and “concerns”). In contrast, no statistically significant relationship was observed between weighting discussions and the use of Refinitiv or Bloomberg ESG measures.
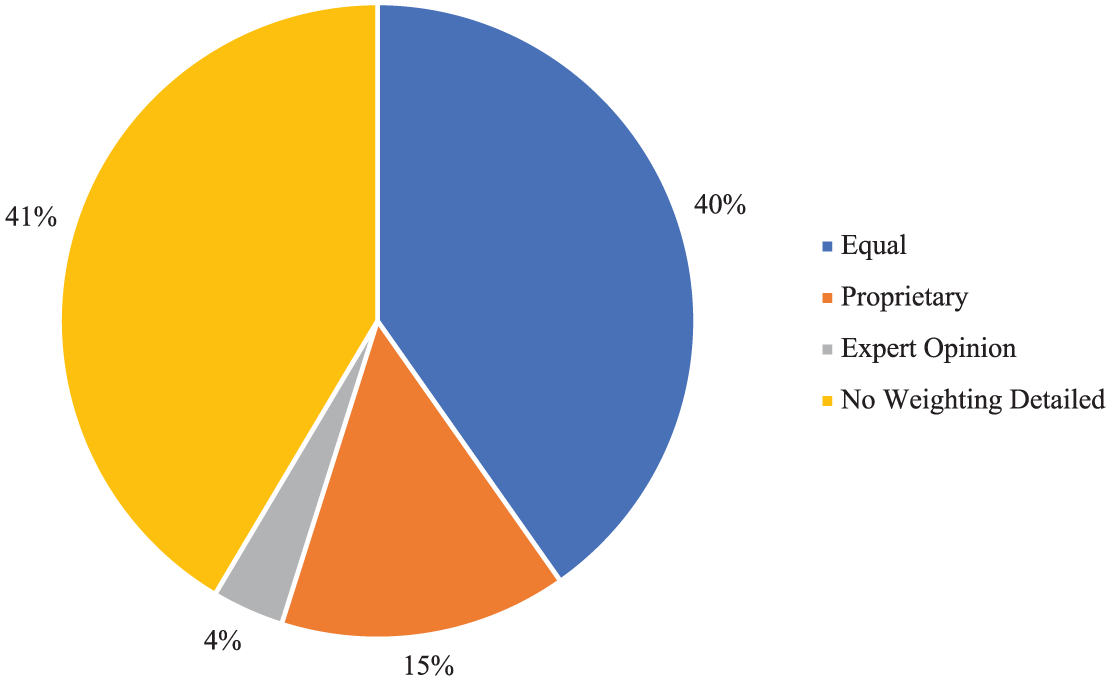
Weighting schemes identified (N = 82).
Although aggregation inherently assumes fungibility, it was addressed less frequently than weighting. However, these two elements were often discussed together (see Table 2). Fungibility discussions were most common in KLD/MSCI-based research (e.g., Flammer, 2013; Kim et al., 2018; Waddock & Graves, 1997; Zhao & Murrell, 2022). These articles explore whether a “strength” can offset a “concern,” with several authors arguing that aggregating them into a single “net” score (strengths minus concerns) is inappropriate, rejecting the assumption that positive and negative social performance are fungible.
Comparing Busch et al. (2022) and Awaysheh et al. (2020) illustrates the consequence of fungibility assumptions. Both relied on KLD/MSCI data and used Tobin’s Q as their measure of financial performance, as well as looking at a similar range of years (2005–2014 and 2003–2013, respectively). However, Busch et al. (2022) treated strengths and concerns as nonfungible and estimated their effects separately; they reported a negative relationship between KLD strengths and Tobin’s Q. In contrast, Awaysheh et al. (2020) treated them as fungible by collapsing them into a single score, reporting a positive relationship between this net KLD score and Tobin’s Q. This divergence demonstrates how the decision to allow positive and negative indicators to offset one another directly influences the sign and interpretation of reported effects.
Similarly, 12 articles analyzed ESG measures independently. While these approaches suggest a more granular view of sustainability, few studies articulated the theoretical implications of these choices in detail.
Taken together, these findings reveal a striking asymmetry: while a majority of studies (59%) report positive relationships between sustainability measures and financial performance, critical engagement with measurement quality remains limited. Nearly three-quarters of articles fail to address accuracy or reliability, and only 6% engage with timeliness. Aggregation choices receive more attention, yet even weighting and fungibility discussions often lack theoretical justification. This pattern suggests that reported findings may reflect not only underlying relationships but also unexamined assumptions embedded in measure construction and provider selection.
Discussion
This review examines how scholars engage with third-party sustainability measures when investigating the relationship between sustainability and financial performance. Unexamined assumptions about data quality and aggregation can influence research findings. Our analysis reveals a pattern: researchers who scrutinize one quality element (e.g., reliability) tend to scrutinize others, while many scrutinize none. This suggests researchers either approach sustainability data with critical skepticism or accept it wholesale. Rather than treating scores as “black boxes” to be unpacked, most researchers simply accept provider aggregation choices without discussion (Boiral et al., 2021; Gangi et al., 2022).
Most articles relied on an equal-weights approach (e.g., McWilliams & Siegel, 2000; Zhao & Murrell, 2022), adopting aggregation assumptions with little justification. This approach is not neutral; it implicitly assigns identical importance to all dimensions. While some scholars derived weights through expert panels (Waddock & Graves, 1997) or adopted provider-specific schemes (Petitjean, 2019; Yu et al., 2018), such transparency remains the exception. Regardless of the approach, researchers must document the trade-offs and potential biases implied by their weighting decisions. Hull and Rothenberg (2008, p. 784) provide a good example, noting: [Our] approach has the advantage of providing a numerical score [and] it is more easily reproduced by future researchers than is the weighted index described by Waddock and Graves (1997), though the weights they describe appear to correspond fairly well with ours.
However, such transparency is rare.
Fungibility is inherent in aggregation. This logic risks masking poor performance in one area with excellence in another (Delmas & Doctori-Blass, 2010). To evaluate these aggregation choices, researchers need to specify which indicators are combined and where compensatory logic is permitted. Our review found varied, often unarticulated, approaches: some treated all the data as fungible (e.g., Blanco et al., 2013; Godfrey et al., 2009), others treated subdimensions, like KLD/MSCI’s “strengths” and “concerns,” as nonfungible (e.g., Busch et al., 2022; Delmas et al., 2015; Flammer, 2013; Kim et al., 2018; Van der Laan et al., 2008), and some treated broader categories such as “environmental” and “social” as nonfungible (e.g., Janney & Gove, 2011; Oikonomou et al., 2014). These differences complicate cross-study comparison.
Jell-Ojobor and Raha (2022) provide a good example of explaining their fungibility approach: We grouped the environmental scores into four main GSCM [Green Supply Chain Management] dimensions [from KLD]: (1) pollution and waste, (2) natural capital, (3) environmental opportunities, and (4) climate change. These scores reflect internal GSCM practices, such as sourcing and using water and energy for core business operations, and external GSCM practices, such as implementing programs with suppliers to reduce their carbon footprint. (p. 1970)
This specificity helps move scholarship beyond implicit reliance on third-party scores toward more interpretable and theoretically grounded measurement choices, including explicit assumptions about where substitution across dimensions is (and is not) allowed.
These aggregation choices also intersect with contested notions of materiality in sustainability reporting. Traditional financial materiality, which focuses on information relevant to investor decisions, can systematically exclude social and environmental impacts that are material to other stakeholders (Adams, 2015, 2017; Unerman et al., 2018). When third-party providers adopt investor-centric materiality frameworks, they may inadvertently reinforce a narrow view of corporate accountability that privileges financial returns over broader sustainability outcomes (Gray, 2010). This dynamic exacerbates the problem Schaltegger (1997) warned of: because high-quality environmental information is costly to produce and difficult for diverse stakeholders to verify, poor-quality or overly narrow metrics can easily dominate the landscape. This has direct implications for empirical research: studies using materiality-weighted measures (such as those from Bloomberg or Sustainalytics) embed these normative choices into their research designs, potentially limiting the generalizability of findings to contexts where stakeholder materiality differs from financial materiality.
Assumptions about accuracy and reliability also shape interpretation. Mainstream accounting literature emphasizes that information quality is not absolute but is contingent on the specific decision-making context (Dechow et al., 2010). Consequently, directly observed measures (e.g., employee demographics) differ from modeled measures (e.g., Scope 2 GHG emissions estimates) and imputed measures (e.g., annualized charitable giving); each introduces distinct sources of error and ambiguity about what is being captured (e.g., a point-in-time snapshot vs. a year-average or a modeled baseline vs. a firm-specific outcome). Unreliable measures with unknown margins of error can distort results. For example, Radu and Smaili (2021, p. 3354) note unreliability in Bloomberg’s ESG measures, stating that “Given the nature of [Bloomberg’s] sources of information, some gaps could exist between self-reported disclosure and actual performance.” Similarly, Duque-Grisales and Aguilera-Caracuel (2021) remark that “the score assigned to each [Refinitiv] variable is not free of subjective influences, which may decrease the validity of our results” (p. 330).
Timeliness is the most neglected element. While traditional financial accounting research treats timeliness as a core attribute of information quality that has a direct, measurable impact on a firm’s cost of equity (Francis et al., 2004), researchers utilizing sustainability scores typically assume sustainability scores reflect the reporting year, ignoring temporal mismatches. Sustainability reports are typically published months after the end of a fiscal year, and third-party providers may take several more months to collect, verify, and aggregate that data into a formal score. Consequently, scores often lag the performance they supposedly measure. This lag can distort causal inference about sustainability-performance links (Delmas, Doctori-Blass, 2010). Without explicit attention to these temporal structures, researchers risk misaligning sustainability measures with financial metrics, obscuring the relevant window of market reaction or performance impact, and weakening the internal validity of causal claims.
In summary, the literature exhibits limited and uneven engagement with third-party sustainability measures: scrutiny is selective, attention clusters around certain elements, and many studies rely on implicit assumptions. This overlooks the measurement uncertainty introduced by provider-side design choices, from data modeling to analyst judgment. Because the choice of provider covaries with the direction and framing of reported results, we conclude that these measurement attributes are not neutral.
Recommendations
We recommend several approaches to address the limitations of third-party sustainability data.
Use Multiple Independent Sustainability Measures
For instance, use Bloomberg’s materiality-weighted score alongside equal-weighted KLD/MSCI’s strengths/concerns. If both approaches yield similar results, confidence increases. If they diverge, this reveals how measurement choices shape conclusions. Such transparency clarifies the assumptions embedded in the chosen measure and acknowledges its limitations. Given the well-documented divergence among sustainability metrics (Berg et al., 2022), one effective strategy is to replicate analyses using multiple independent data sources. This approach, recommended by Dorfleitner et al. (2015) and Widyawati (2021), enhances robustness and supports broader generalizability. For instance, Delmas et al. (2013) combined environmental ratings from three major providers to extract key components of CEP. In contrast, studies relying on a single measure may demonstrate a correlation between that specific metric and financial performance but risk overstating the generalizability of their findings to broader notions of sustainability.
Analyze the Sensitivity of Sustainability Measures to Inaccuracy and Unreliability
One approach is to introduce random noise into sustainability measures within a realistic range and rerun analyses. If conclusions remain stable, measurement quality may be less critical to the findings. If results change substantially, this indicates that findings depend heavily on provider accuracy. By incorporating a defined range of measurement error as a robustness check, scholars can evaluate how robust their inferences are to deteriorating data quality. While no articles in our review employed such approaches, Berchicci and King (2022) provide a compelling example of how this methodological rigor could be applied.
Align Lagged and Unlagged Variables Based on the Period the Sustainability Measures May Represent
The timing of sustainability data are critical for research design, yet it is often uncertain. Providers frequently revise their methodologies, potentially altering scores in ways unrelated to a firm’s actual performance (Cho et al., 2015; Gillan et al., 2021). Moreover, ratings may reflect prior-year performance rather than the year of publication. For instance, a 2025 score may be based on 2024 data, making it appropriate to pair with a 2025 financial outcome in a study using ESG data to predict CFP. In the absence of clear information about the period the rating represents, researchers should test both lagged and unlagged specifications to assess the sensitivity of their results. Preston and O’Bannon (1997) and Nakao et al. (2007) employed this strategy and found consistent directional outcomes. Without explicit alignment between the timing of sustainability measures and financial variables, claims about causality or performance effects remain tentative.
Ensure an Appropriate Level of Aggregation
Aggregation of sustainability measures should reflect the study’s analytical aims. Broader questions may warrant composite indicators, whereas disaggregated measures are better suited to isolate the effects of specific sustainability dimensions. For example, Petitjean (2019) found no relationship between Bloomberg’s environmental score and ROA, whereas Minutolo et al. (2019) identified a positive relationship using Bloomberg’s aggregated ESG score. Disaggregated approaches help reduce assumptions associated with fungibility and weighting by treating ESG dimensions as distinct constructs, allowing for a clearer understanding of each measure’s contribution to financial performance.
Assess Sensitivity to Weighting Schemes
Few studies evaluate how alternative weighting schemes affect results. Surroca et al. (2020), using Refinitiv data, offer a good example through testing multiple weighting schemes to assess robustness. When working with disaggregated data, such as KLD/MSCI’s “Strengths” and “Concerns,” one can simulate a range of aggregate scores by applying different weightings to the individual components. This approach reveals how sensitive findings are to methodological choices. Hall and Rothenberg (2008) followed this strategy by comparing results across two prior studies that used different aggregation methods with KLD/MSCI data (i.e., McWilliams & Siegel, 2000, and Waddock & Graves, 1997).
The measurement limitations documented in this review do not affect researchers alone. Investors, managers, employees, and regulators all rely on third-party sustainability measures and are equally exposed to the uncertainties embedded in them (Amel-Zadeh & Serafeim, 2018; Clementino & Perkins, 2021; European Parliament & Council of the European Union, 2024; Welch & Yoon, 2023).
Investors should be careful not to overinterpret any given study and build an investment strategy on its findings. They should consult various ratings to avoid overreliance on a single source, just as they seek diverse perspectives in traditional financial research. In addition, changes in sustainability measures, as some of the articles in this review show, can affect investment returns. Investors need to understand what can drive these changes, encompassing both the underlying metrics and their relative weighting. This requires an understanding of when sustainability measures are updated and the period they reflect. Considering these temporal structures can help investors more accurately assess the impact of sustainability measures on investment analyses.
Managers who rely on sustainability ratings should recognize that provider methodologies differ substantially—in what they measure, how they weight dimensions, and when scores are updated. Optimizing for a single provider’s score risks overlooking dimensions that matter to other raters. A more robust approach is to monitor performance across multiple providers, recognizing that ratings can shift due to changes in provider methodology that are unrelated to the firm’s actual sustainability performance.
Policymakers face challenges in detecting greenwashing when sustainability measures allow strengths in one area to offset weaknesses in another (Montgomery et al., 2023). Requiring more disaggregated disclosures and limiting compensatory scoring can improve transparency and reduce misleading claims. Although policymakers may not rely directly on third-party scores, research using this data can help identify misalignments between fund-level sustainability claims and actual portfolio composition. More broadly, emerging mandatory reporting requirements—including the International Sustainability Standards Board (ISSB) framework, California’s SB 261 and SB 253, and the European Union’s Corporate Sustainability Reporting Directive (CSRD)—represent a structural opportunity to reduce dependence on opaque third-party scores. By mandating standardized, verifiable disclosures, these frameworks could substantially improve the accuracy, reliability, and comparability of underlying sustainability data, directly addressing the quality concerns this review documents.
In sum, these recommendations can strengthen the validity of sustainability–CFP research and support more informed analysis by stakeholders relying on widely used sustainability measures.
Conclusions, Limitations, and Future Research
Our systematic review of 82 articles yields two main findings. First, engagement with the five framework elements is limited and uneven: only 24% of reviewed studies addressed accuracy, 28% reliability, and a mere 6% timeliness. Second, methodological rigor is distinctly bimodal: articles discussing accuracy are 10.5 times more likely to also discuss reliability (OR = 10.5, p = .002), indicating that researchers either approach third-party data with comprehensive skepticism or treat it as validated input requiring no scrutiny. These patterns matter because unexamined measurement choices are not merely omissions—they are active confounds. When researchers adopt a provider’s score without interrogating its construction, they import that provider’s scope, estimation, and aggregation decisions directly into their research design, where those decisions shape the variance and direction of the independent variable in ways that standard model controls cannot address. This scrutiny, however, remains rare.
We examined the quality elements related to “how” sustainability measures are created and how uncertainty is addressed. By focusing on use rather than construction alone, we extend prior conceptual critiques (Damtoft et al., 2025) and bring attention to researchers’ practices. Whereas Damtoft et al. (2025) develop a normative framework for context-specific measurement design, the present review documents how practicing researchers actually engage—or fail to engage—with the uncertainty embedded in the third-party scores they adopt.
These findings have several implications. First, the field lacks shared standards for methodological rigor—researchers either scrutinize several dimensions of measurement or not at all, with little middle ground. Second, the provider differences, which are often not critically examined in the studies using that data, challenge the assumption that sustainability ratings measure a common underlying construct.
Provider opacity complicates researcher efforts to assess measurement elements (Boiral et al., 2021; Delmas et al., 2013; Escrig-Olmedo et al., 2014; Kotsantonis & Serafeim, 2019). However, when researchers cannot determine the quality and aggregation methods of the underlying data, they must examine how inaccuracy, unreliability, timeliness, and different aggregation approaches may affect their analyses. Our analysis shows that when such examination occurs, it clusters around reliability, fungibility, and weighting, while timeliness remains neglected. Neglecting these uncertainties risks overstating the validity of findings.
This review is not without limitations. Our Web of Science and ProQuest searches focused on business journals, limiting our scope to how business research has used sustainability measures. Other fields and interdisciplinary research also use sustainability measures, but we excluded publications from those fields from our review. As a result, the systematic associations we identify reflect patterns within business research and may differ in fields where sustainability measures are theorized or operationalized differently.
Restricting the analysis to high-quality peer-reviewed journals introduces potential selection bias. First, articles with serious measurement problems may have been rejected during peer review, meaning our findings may underestimate the extent of measurement issues in the broader research population. Second, publication bias may favor positive findings regardless of measurement quality, which could explain some of the associations we observe between measurement attention and reported effects. Future research could address this by analyzing working papers or rejected manuscripts or by surveying researchers directly about their measurement decision-making—approaches that would reveal whether the selective engagement we document is even more pronounced outside the published record.
We deliberately do not evaluate the substantive dimensions of what sustainability measures are intended to capture. These dimensions, such as completeness, commensurability, materiality, and balance, have been emphasized in broader information quality research (e.g., Nelson et al., 2005), as well as standards for sustainability reporting (Schaltegger & Burritt, 2000), and are essential for understanding the substantive validity of sustainability indicators. However, incorporating these dimensions would require engaging with firm-level disclosure choices, stakeholder prioritization, and normative judgments about sustainability performance, issues that lie outside of the focus of this review.
Future literature reviews could extend our approach by examining how researchers justify the selection of sustainability measures with respect to substantive dimensions such as materiality, balance, and completeness and whether attention to these dimensions is likewise associated with systematic differences in research findings. Such research could move the corporate sustainability field closer to developing measures that better reflect firms’ “true” sustainability. Nonetheless, our study shows that understanding and explicitly managing challenges related to quality and aggregation remain essential for credible and transparent research.
While comparing effect sizes across providers would be valuable, heterogeneity in model specifications prevented such analysis. For instance, Jeriji et al. (2023) and Yu et al. (2018) both predict Tobin’s Q using global samples, but with different providers (Refinitiv and Bloomberg, respectively) and different specifications. Yu et al. (2018) include ESG and ESG² as independent variables, while Jeriji et al. (2023) focus on GRI disclosure with CSP as a control variable, including a GRI × CSP interaction. Attributing coefficient differences to provider choice rather than model specification would therefore be unjustified. Similarly, Busch et al. (2022) and Minutolo et al. (2019) both examine U.S. large-cap firms using KLD/MSCI and Bloomberg data, respectively, but with incompatible designs: Busch et al. (2022) focus on GHG emissions with KLD/MSCI strengths and weaknesses as separate controls, while Minutolo et al. (2019) use Bloomberg scores as the main independent variable and include ROA as a predictor of Tobin’s Q. These specification differences make meaningful effect size comparisons infeasible. Even Friede et al.’s (2015) comprehensive meta-analysis relied on vote-counting and simple correlations rather than standardized effect size comparisons across studies.
A further boundary condition concerns financial performance measurement—our review focused only on articles using four indicators: Tobin’s Q, ROA, MVA, and CAR. While these are widely accepted metrics, many other financial performance measures exist. For example, profitability ratios such as profit margins or return on equity and market value indicators such as price-to-earnings ratios or earnings per share are also well-established methods for assessing CFP. Moreover, financial performance is not the only relevant outcome for research. Studies examining the impact of sustainability measures on environmental and social outcomes have reported concerning findings (Kathan et al., 2025; Raghunandan & Rajgopal, 2022). Future studies could examine whether the patterned relationships we observe between measurement emphases and outcome direction persist across alternative financial and nonfinancial performance indicators. Overall, further research is needed to explore how firm performance, whether financial or nonfinancial, is measured and understood.
Finally, we specifically examined sustainability measures from third-party providers. Researchers can and do construct their measures from data they collect instead of using third-party data (Delmas et al., 2025). Although this approach introduces additional challenges, the elements of measurement quality and aggregation remain relevant, without the opacity created by third-party providers. With advancements in large language models and machine learning, the rapid and accurate collection of firsthand sustainability data is becoming less labor-intensive, reducing researchers’ and stakeholders’ dependence on proprietary third-party sources. These developments may help bridge the gap between voluntary disclosures and mandatory reporting requirements, while also enabling researchers to test whether greater transparency reduces the systematic associations between measurement choices and reported outcomes identified in this review.
This review does not make a blanket argument against the use of sustainability measures in research. Instead, it responds to a desire to simplify the complex task of measuring corporate sustainability, attempting to provide a clear and comprehensive overview of how sustainability measures are used. Our five-element framework echoes long-standing principles in information quality assessment (Nelson et al., 2005), while tailoring them to the unique challenges of sustainability measurement. Its goal is not to highlight the well-established weaknesses of these metrics but to introduce a framework of elements that define their construction quality and to offer actionable guidance for addressing known limitations. By showing that measurement choices covary with the direction and framing of empirical results, our review underscores why interrogating these assumptions is a substantive concern for theory development. The failure to do so contributes to the continued legitimacy of opaque and inconsistent metrics (Berg et al., 2022; King & Berchicci, 2021). As the title of this article suggests, without explicit scrutiny of these methodological “forking paths,” scholarship risks being built on sand, where findings are less a reflection of corporate reality and more an artifact of unexamined measurement infrastructure.
Supplemental Material
sj-docx-1-oae-10.1177_10860266261443020 – Supplemental material for Building on Sand? Third-Party Sustainability Measures in the Business Literature
Supplemental material, sj-docx-1-oae-10.1177_10860266261443020 for Building on Sand? Third-Party Sustainability Measures in the Business Literature by Tyson Timmer, Magali A. Delmas, Charles Corbett, Olivier Boiral and Laurence Guillaumie in Organization & Environment
Footnotes
Funding
The authors received no financial support for the research, authorship, and/or publication of this article.
Declaration of Conflicting Interests
The authors declared no potential conflicts of interest with respect to the research, authorship, and/or publication of this article.
Use of AI
This work was supported by AI for assistance with copy editing of the text and survey questions. The author maintains full control over the final content.
Supplemental Material
Supplemental material for this article is available online.
Notes
Author Biographies
References
Supplementary Material
Please find the following supplemental material available below.
For Open Access articles published under a Creative Commons License, all supplemental material carries the same license as the article it is associated with.
For non-Open Access articles published, all supplemental material carries a non-exclusive license, and permission requests for re-use of supplemental material or any part of supplemental material shall be sent directly to the copyright owner as specified in the copyright notice associated with the article.