
Abstract
Why is there such great heterogeneity in environmental, social, and governance (ESG) performance between firms? Drawing inspiration from the locus of performance literature, we use variance partitioning methods to analyze the extent to which CEO, firm, industry, year, and state effects explain variation in ESG performance over recent decades. Our findings show that internal effects (i.e., CEO and firm) are the strongest determinants. Yet, disaggregation of the multidimensional ESG construct shifts the salience of the factors significantly, revealing the importance of the external environment (i.e., industry and year) in explaining ESG concerns. Our research extends the locus of performance literature to our understanding of the triple bottom line and contributes to understanding the complex determinants of firm-level ESG performance across an array of positive and negative ESG indicators.
Keywords
“It is more important than ever that businesses take active leadership to show that growth and sustainability are not in conflict.” “I am endlessly sorry we betrayed their trust. . . . I am convinced that the Volkswagen Group and its team will overcome this grave crisis.”
Since the United Nations World Commission on Environment and Development (WCED) highlighted the importance of sustainability over three decades ago—defined as meeting the needs of the present generation without compromising the ability of future generations to meet their needs WCED, 1987, p. 43)—many organizations have incorporated sustainability considerations into their operations. Notably, executives, investors, analysts, and other corporate stakeholders have converged on a set of environmental, social, and governance (ESG) indicators upon which to compare the performance of corporations (Eccles et al., 2020; Esty & Cort, 2020; Gartenberg & Serafeim, 2019). Corporations also have embraced a variety of ESG indicators, with 90% of S&P 500 constituents now formally publishing some form of ESG report, up from 20% just 9 years ago (Governance & Accountability Institute, Inc., 2020).
Yet, as our epigraph illustrates, there remains great heterogeneity in actual ESG performance between firms. For scholars of strategic management and organization, these dynamics raise interesting questions as to the determinants of this heterogeneity. Theoretically, ESG performance is likely to be influenced by a range of instrumental and normative considerations originating from multiple sources. In an effort to disentangle these disparate sources in this article, we ask: what factors explain variation in ESG performance between firms?
Extant scholarship has engaged a diverse array of theoretical perspectives to identify the underlying causal mechanisms that explain why firms differ in their ESG performance. Some scholars have explored the influence on ESG performance from external factors such as the industrial environment (Flammer, 2015a; Hawn & Kang, 2018), whereas others have applied an internally oriented lens to explore the role of firm attributes (Howard-Grenville, 2006; Sandhu & Kulik, 2019) and strategy to achieve competitive advantage (Bansal & Roth, 2000; Russo & Fouts, 1997; Surroca et al., 2010) and ultimately increase market value (Flammer, 2015b; Hawn et al., 2018). Others have taken an upper echelons perspective to explore the influence of managerial discretion and the top management team’s role in ESG performance (Chin et al., 2013; Ortiz-de-Mandojana et al., 2019).
Despite these numerous efforts to elucidate the complex dynamics of heterogeneity in ESG performance, there still remains a limited holistic understanding of the relative importance of these different factors. Stated differently, while both firm leadership and the industrial environment no doubt influence corporate ESG performance, just how much each of these factors matter compared with one another is basically unknown. Therefore, an analysis that integrates the disparate determinants at multiple levels and enables a simultaneous comparison of relative importance in explaining variation is imperative to scholarly understanding of the heterogeneity in ESG performance while also providing a potential roadmap of relationships worthy of further investigation.
This puzzle is reminiscent of a key concern in the field of strategic management: the locus of performance. Following Schmalensee’s (1985) landmark study attributing the majority of variance to a firm’s industry, a group of strategy scholars sought to understand the extent to which firm financial performance is explained by a firm’s external environment versus its internal characteristics, with growing theoretical, empirical, and methodological sophistication. For instance, Rumelt (1991) extended Schmalensee’s original work by adding a temporal dimension that enabled the ability to differentiate between transient and stable effects. Other research has since followed these two pivotal studies with more comprehensive data sets that provide increasingly robust results (Brush et al., 1999; McGahan & Porter, 1997, 2002). Recently, scholars have added methodological rigor through the use of multilevel modeling instead of analysis of variance (ANOVA) for decomposition of the variance components (Misangyi et al., 2006; Quigley & Hambrick, 2015).
In this article, we draw inspiration from this literature stream. Namely, we mobilize methodological innovations that were initially pioneered to explain variance in corporate financial performance and instead marshal this analytic apparatus to explain corporations’ non-financial performance. Whereas prior research has focused on just one bottom line, we expand the focus to include the other two aspects of the so-called triple bottom line (Elkington, 1998): people and planet. Instead of measuring accounting returns such as return on assets (ROA) (the most common dependent variable in these prior studies), we model ESG performance as the dependent variable. Our analysis is conducted in the U.S. context and utilizes comprehensive data drawn from two extensive and widely used databases, Execucomp and MSCI ESG KLD STATS. Our primary sample consists of an unbalanced panel of 2,171 unique firms observed over a period of 8 years. A secondary sample is used consisting of a smaller set of 1,010 firms observed over a longer period of 18 years.
Our results suggest that firm effects and CEO effects are strong determinants in all circumstances, but disaggregation of the multidimensional ESG construct shifts the salience of the factors significantly. Ultimately, this article contributes to the ESG literature by providing a new understanding of the absolute and relative importance of different drivers of ESG performance. By doing so, we are able to elide debates about whether or not such ESG performance is financially beneficial for firms (Margolis & Walsh, 2003; Orlitzky et al., 2003; Wang et al., 2016). Instead, we take a strategic and organization theoretic lens that aims to develop an integrated and holistic understanding of the diverse ESG performance of corporations.
Overall, our study makes two important contributions. First, we contribute to the ESG literature by providing a detailed analysis of the factors that are most consequential to ESG performance, both overall and across multiple ESG dimensions. This relative comparison is critical for both scholars and practitioners because it elucidates the “points of intervention” that might be used to improve the ESG performance of firms. For example, we find that the CEO effect is strong across a variety of circumstances which suggests that continued scholarly focus on top management teams is a worthwhile endeavor. Our results also suggest theoretically important asymmetry in relation to the industry and year effects across the different dimensions of ESG. Whereas we find strong industry effects in relation to environmental concerns, industry effects are weak for other dimensions of ESG performance. This indicates that while industry-level interventions may have utility in reducing negative externalities related to the environment, they may be less effective in catalyzing other dimensions of ESG performance. Finally, we find that internal effects related to the CEO and firm consistently matter, which indicates the relevance of further research at these levels of analysis. We highlight the extent to which future scholars could also benefit from disaggregation of the ESG construct to further unpack the complexities of different dimensions of ESG performance.
Second, we contribute to the locus of performance literature, a foundational concern in the field of strategic management, by extending it to a broader set of outcomes. While previous research has focused on firm financial performance and accounting returns, we expand the scope of the concept to encompass contemporary considerations that are interested in other bottom lines for their own sake. Interestingly, our analysis finds similar results as previous scholarship in the financial performance literature in regard to the dominance of internal effects (e.g., CEO and firm). Relative to the debate on the locus of performance, our analysis shows that internal characteristics are the most important levels of analysis in explaining the variation in firm performance regardless of what bottom line is being measured. Yet, we also demonstrate that disaggregation of ESG performance into its individual dimensions alters the relative importance of the factors and reveals a strong external locus in explaining the variation in performance on negative ESG indicators. Thus, we support earlier findings from the locus of performance literature while also contributing new insights which suggest that the relative importance of external factors is greatly increased for outcomes of interest beyond financial returns.
Theoretical Background
The Locus of Performance
A foundational concern within the field of strategic management is firm performance. The Academy of Management Strategic Management division statement reads, “Division scholars seek to understand and predict when and why some firms perform better than others over time” (2020), while the Strategic Management Journal (SMJ) states, “Overall, SMJ provides a communication forum for advancing the understanding of strategic management. This includes all topics that are relevant to the performance of firms and non-profit organizations” (Strategic Management Society, 2021). Indeed, the field has coalesced around performance as a primary concern and firms as the primary nexus of investigation (Nag et al., 2007). Of course, the field of strategy has dynamically evolved to encapsulate a wide variety of phenomena related to the various ways in which firms achieve such performance.
One line of inquiry that has been present since the inception of the field is interested in understanding which level of analysis explains variation in performance between firms. Hoskisson and colleagues (1999) suggest that scholarship has oscillated in a manner analogous to the “swings of a pendulum” between internal and external theoretical perspectives. We refer to this historical debate as the locus of performance. Regardless of the theoretical toolkit applied by the researcher, the debate on the locus of performance is primarily concerned with the extent to which firm performance is determined by a firm’s external environment or its idiosyncratic internal characteristics. Most researchers tend to subscribe to a particular perspective, but a line of inquiry pioneered by Schmalensee (1985) and Rumelt (1991) has taken a comparative approach to understanding the relative importance of internal and external sources of variation in firm performance. Subsequent research has utilized increasingly improved datasets (McGahan & Porter, 1997, 2002) and more comprehensive coverage of the salient factors (Makino et al., 2004; Quigley & Hambrick, 2015), but the discussion has continued to this day (Wang, 2020). These studies conceptualize each level of analysis as an “effect” which enables a holistic understanding of which sources of variation actually matter relative to one another. The various external effects represent the extent to which the performance of firms is determined by their environment while internal effects represent the extent to which unique attributes and management of firms matters.
The external effects studied within the locus of performance literature include industry, region, and time. Industry effects as a determinant of firm performance have roots in industrial economics and the work of Joe Bain (1951). This classical tradition saw firms as largely homogeneous entities with negligible differences compared with others in the same industrial environment and a primary goal of this research was to explain firm conduct based on market structure (Schmalensee, 1985). While industry has undoubtedly been given primacy in the external environment, scholars have also suggested that regional environment matters. Both formal and informal institutional environments can shape firm practices and ultimately performance across regions even within the same industry (Makino et al., 2004; McGahan & Victer, 2010). Finally, temporal effects encapsulate higher level macroeconomic factors that determine firm performance. For example, during a year with a recession or a pandemic, all firms may have decreased performance regardless of the industry or region.
The internal effects studied in the literature include firm and CEO. In contrast to the conceptualization of firms as homogeneous within an industry, some scholars argued that idiosyncratic firm attributes were a better explanation of the heterogeneity in performance (Rumelt, 1991). 1 These effects encompass a myriad of organizational features too comprehensive to fully discuss here, but include attributes such as unique portfolios of businesses (Wernerfelt, 1989), core competencies and rigidities (Leonard-Barton, 1992; Prahalad & Hamel, 1990), and heterogeneous bundles of resources (Barney, 1991; Wernerfelt, 1984). All of the facets that distinguish organizations in the same industry from one another are included. While the firm effect captures the influence of the pervasive elements of organizations such as structure, culture, reputation, or knowledge which endure between generational changes in leadership, the CEO effect captures variation in performance under different leaders. CEO effects have their origins in upper echelons theory which posits that idiosyncratic attributes of individual executives such as experiences, values, and personalities influence firm strategy and performance (Hambrick & Mason, 1984). Although upper echelons theory suggests that the entire board and top management team will influence performance (Hambrick, 2007), the literature has utilized stability and change in the CEO as a proxy for the board and top management team (Quigley & Hambrick, 2015).
ESG Performance
In the decades since the WCED’s landmark report, scholars of management and organization have adopted a particular interest in what researchers have often described as business or corporate sustainability (Bansal, 2005; Slawinski & Bansal, 2015). However, plural conceptualizations of what precisely these sustainability practices consist of have emerged over time. The phenomenon remains an essentially contested concept and what constitutes sustainability is both socially constructed and evolving over time (Garud & Gehman, 2012).
Nevertheless, numerous organizations and formal structures have emerged that strive to establish guidelines for achieving corporate sustainability, such as the Global Reporting Initiative (GRI), Sustainability Accounting Standards Board (SASB), and Carbon Disclosure Project (CDP). One particularly important avenue has been the advent and diffusion of ESG. An important function of ESG rating agencies is commensuration or the comparison of different entities according to a common metric (Espeland & Stevens, 1998). These organizations transform complex sustainability information about firms into a quantitative metric that enables stakeholders to compare firms on their level of ESG performance (Eccles et al., 2020; Slager et al., 2012) which is particularly pertinent for investors and analysts that are placing increasing value on firm ESG (Flammer, 2013; Hawn et al., 2018; Ioannou & Serafeim, 2015). Clearly, to generate a measure of performance, corporations must have something to “perform.” ESG rating agencies generate a set of ESG indicators upon which they can measure firm performance across multiple dimensions of ESG. These indicators evaluate a subset of sustainability practices that are assessable, salient, and worthy of the resources required to assess them. Below we unpack these critical facets further.
To be incorporated into a quantitative measure of performance, ESG indicators must first be deemed salient by the rating agency and their constituents because, like sustainability more generally, ESG is a socially constructed phenomenon (Eccles et al., 2020). Contentious issues may not be considered as relevant by all stakeholders and thus may be more difficult to assimilate. Core issue areas such as carbon emission reductions are prime candidates for ESG indicators because the majority of stakeholders can achieve consensus that such issues are salient to sustainability. Second, ESG indicators must be able to be assessed by a rating agency across an array of firms. If a sustainability practice cannot be assessed or is idiosyncratic to a firm then it is unlikely to be used as an ESG indicator. After all, the purpose of ESG ratings is the comparison of firms which inherently requires reliable ratings between multiple corporations. Levels of carbon emissions or firm philanthropy are metrics conducive to measurement and comparative analysis. Importantly, evaluation does not necessarily require that indicators be purely quantitative; qualitative indicators may be sufficient so long as they can be assessed and commensurated.
Finally, ESG indicators must be considered worthy of the resources it takes to measure them. Scholars have argued that ESG rating agencies place more emphasis on a corporation’s practices rather than the actual resulting social impacts to society more broadly (Barnett et al., 2020; Howard-Grenville, 2021). However, these impacts are notoriously difficult to measure. For example, it is straightforward to determine whether firms publish ESG reports or provide particular employee benefits, but what impact such activities actually have is more difficult to assess. Rating agencies could interview or survey employees to assess the social impact of benefits, but doing so for many firms would require substantial investments of resources. Thus, ESG indicators usually constitute what firms are doing and the beneficial nature of the resulting social impacts is assumed a priori.
Potential Sources of Variation
As is tradition in the locus of performance literature, we do not formulate explicit hypotheses. To some extent, this is a function of methodology because effects cannot be negative, but more importantly there is no theoretical cutoff point at which effects start or cease to matter. In fact, because we are interested in relative comparison, it is difficult to assess any single effect in a vacuum. Instead, in this section, we utilize the prior literature on ESG performance to theoretically ground our understanding of how each of the five effects established in the locus of performance literature may be relevant to explaining ESG performance.
External: Industry Effects
First, there is evidence to suggest that the industry environment is a salient influence on ESG performance. Early scholars interested in the relationship between ESG and financial performance identified differences in ESG performance between industries, and subsequent scholarship has included control variables for this factor (Russo & Fouts, 1997; Waddock & Graves, 1997). General characteristics such as competitive intensity of the industry environment can be a particularly strong influence on ESG performance (Fernández-Kranz & Santaló, 2010; Flammer, 2015a; Hawn & Kang, 2018). In addition, industries are subject to different levels of regulatory constraints in the form of both informal self-regulation and formal government enforced regulations and sanctions (Aragòn-Correa, Marcus, & Vogel, 2019).
Perhaps the best theoretical justification for industry effects on ESG is that some industries are simply “dirtier” than others (Gehman & Grimes, 2017). For example, just 50 fossil fuel companies are responsible for over half of all global greenhouse gas emissions (Griffin 2017). While this is particularly pertinent in the context of the natural environment, it also applies to social dimension indicators such as employee safety (U.S. Bureau of Labor Statistics, 2019) and workforce diversity (U.S. Department of Labor, 2018). Certain industries are inherently disadvantaged across various dimensions of ESG and by extension, some industries must be advantaged and more readily able to achieve ESG performance. On the demand side, the characteristics of the product market can also influence firm ESG performance. For example, Siegel and Vitaliano (2007) find that firms in industries selling durable experience goods and credence services are more likely to have higher ESG performance than industries selling search goods. Similarly, industrial markets that sell to other businesses may be less inclined toward ESG performance than those that sell directly to the end user (Haddock-Fraser & Tourelle, 2010). Therefore, there seems to be ample evidence of industry influence on firm ESG performance.
External: Regional Effects
Second, although industry effects are clearly salient to ESG, we expect that the regional environments where organizations are embedded may shape firm ESG performance. Factors such as the educational system, regulations, and sociocultural elements can vary substantially across these environments. For example, although regulations are typically conceived of as being attributable to the industrial environment, certain regions may impose stronger sustainability regulations across an array of industries (Vogel, 2019). Regional environments can also vary in their informal institutions such as culture which further influences ESG (Park et al., 2007).
Regional environments are a socially constructed proxy for such institutional factors and thus can be applied at different levels of analysis such as the country (e.g., Germany or China) or the state (e.g., California or Texas). For example, sustainability scholars have examined community-level (Lee & Lounsbury, 2015), state-level (Meek et al., 2010), and country-level (Frig & Sorsa, 2020; Yan et al., 2021) phenomena. The theoretical impetus behind inclusion is similar at all levels of analysis and largely a function of the scope of the data. Based on this prior literature, we find it plausible that a firm’s regional environment might influence its level of ESG performance. Both the internal constituents that comprise the organization as well as the external stakeholders that exert influence are shaped by such environments. Therefore, the inclusion of region as a potential influence on variation in corporate ESG performance is a worthwhile pursuit in the context of this analysis. As our study is a single-country analysis, we examine the question of regional effects at the state-level.
External: Temporal Effects
Third, similar to financial performance more broadly, macroeconomic fluctuations are also of theoretical importance to ESG performance. If it were costless, presumably more firms would have high ESG performance. But such levels of performance require an investment of firm resources. Thus, some scholars posit that organizations use slack resources to invest in increasing ESG performance (Bansal, 2005; Surroca et al., 2010; Waddock & Graves, 1997). Firms also can withdraw from or reduce investment in such activities during economic downturns (Bansal et al., 2015; Delmas & Pekovic, 2015) and other similar turbulent times such as the COVID-19 pandemic (Amankwah-Amoah, 2020; Ramya & Baral, 2021). Therefore, macroeconomic conditions may be a source of variation in ESG performance as firms reallocate resources away from ESG investments to survive under challenging circumstances.
However, another plausible explanation is that temporal effects could be the result of shifts in the sociocultural elements of the broader institutional environment. Unlike financial performance, which is an ubiquitous goal of publicly traded companies, ESG performance represents a metric that not all firms aim to achieve. Firms can pursue ESG as one of myriad alternative methods to successfully compete and thus ESG performance should experience dynamic shifts as the degree to which firms perceive ESG as beneficial or appropriate changes. A year effect helps account for the dynamic intra-institutional shifts toward or away from ESG between years and across all organizations in all industries and regional environments.
Internal: Firm Effects
Fourth, firm effects are likely to be a significant driver of ESG performance. Notably, the primary argument for firm effects originates from scholarship on ESG as a strategic endeavor, which has highlighted the role of intangible resources as an outcome of ESG performance (Hart, 1995; Russo & Fouts, 1997; Surroca et al., 2010). For example, the level of ESG performance has been shown to lead to increases in firm human capital (Albinger & Freeman, 2000; Brekke & Nyborg, 2008; Greening & Turban, 2000). Applicants and potential employees seem to ascribe more value to a sustainable company ceteris paribus, and thus a strategic benefit of ESG investments is the acquisition of superior human capital. Firms may integrate ESG into their strategy as a means of differentiating themselves and securing competitive advantage. Thus, there is a reasonable expectation that variation in ESG performance may arise as organizations in the same industry choose to compete differently.
Empirical studies also have explored the effects of other firm attributes including size, culture, and structure which may explain variation in firm-level ESG performance. In an ethnographic study, Howard-Grenville (2006) showed how organizational culture can shape the way organizations interpret and act upon external cues related to the natural environment. Similarly, recent work by Sandhu and Kulik (2019) finds that the structure of the organization can shape the ability of intra-organizational actors to develop and implement sustainability initiatives. Research further demonstrates that large firms are more likely to have high ESG performance because these companies have more resources to expend and tend to experience greater public scrutiny (Chih et al., 2010; Drempetic et al., 2020; Stanwick & Stanwick, 1998). A study by Tang and Tang (2016) supports this theory by showing how media coverage diminished the level of pollution activities by the covered firms. In addition, some scholars have argued that corporations may be subject to organizational inertia in ESG performance, meaning that their performance tends to remain stable at the firm-level (Dahlmann & Brammer, 2011). Therefore, both firm attributes and firm strategy can influence ESG performance.
Internal: CEO Effects
Finally, scholars drawing on the upper echelons perspective have demonstrated that CEOs are able to influence the ESG performance of the corporations that they lead and have linked such influence to an array of executive characteristics (Wernicke et al., 2021). These include personality traits such as narcissism (Petrenko et al., 2016), confidence (McCarthy et al., 2017), hubris (Tang et al., 2015; Zhang et al., 2020), and moral identity symbolization (Ormiston & Wong, 2013) as well as different demographic characteristics such as gender (Manner, 2010), age (Ortiz-de-Mandojana et al., 2019), and educational background (Manner, 2010). The ideology and values dimensions of upper echelons theory are of particular salience to ESG performance due to the potential of normative motivations for pursuing ESG. Chin et al. (2013) explored the impact of CEO political ideology on ESG performance and found that more liberal CEOs had a higher propensity for ESG which has seen subsequent empirical support (Gupta et al., 2019). Yet, as Chin and colleagues (2013) note, upper echelons research has primarily focused on the characteristics of CEOs rather than their values, and thus, the literature in this line of inquiry is sparse. Nevertheless, we believe there is sufficient theoretical evidence to warrant inclusion of a CEO effect in this analysis.
The Locus of ESG Performance
Although prior scholarship has established the importance of particular factors in explaining ESG performance, little research has been conducted that compares the relative importance of these factors with one another, nor is there systematic understanding of the extent to which these factors may matter differently depending on the dimensions of ESG performance being assessed. Accordingly, in this final section, we posit a tentative argument as to why some effects may be more important than others. Our starting point for doing so harkens back to the core of the locus of performance literature: namely, a debate as to the relative importance of internal and external factors. More recently, sustainability scholars have distinguished between corporations “being good” and “being bad” as two separate phenomena that can occur simultaneously (Kotchen & Moon, 2012; Strike et al., 2006).
Drawing on these two literatures, we propose a theoretical distinction between positive and negative indicators of ESG performance as well as between internal and external factors. Positive indicators of ESG performance include activities such as philanthropy and voluntary ESG reporting for which ESG rating agencies reward firms. Negative indicators of ESG performance include detrimental activities such as environmental degradation and safety controversies for which ESG rating agencies punish firms. While both are clearly salient to ESG performance, scholars have suggested that positive and negative indicators reflect fundamentally different activities (Chatterji et al., 2009). Our main thesis is that, in terms of the locus of ESG performance, factors related to the external environment will matter more for negative indicators of ESG performance.
Our rationale for this argument is that performance on negative ESG indicators is driven by external factors to a greater extent than performance on positive ESG indicators. For instance, the negative effects from environmental degradation or safety issues are likely to be clustered in “dirty” industries and may be incredibly costly or challenging for firms to reduce (Griffin 2017; Gehman & Grimes, 2017). Similarly, formal regulations are likely to focus on reducing externalities that arise from such activities (Aragòn-Correa et al., 2019). Thus, we theorize that there will be a stronger external locus in determining firm performance on negative ESG indicators. By comparison, we theorize that performance on positive ESG indicators is more likely to be driven by strategic considerations. For example, any firm regardless of industry or region can easily engage in philanthropic activities or voluntarily publish an ESG report to strategically differentiate itself (Governance & Accountability Institute, Inc., 2020). We expect that some firms will choose to engage in these strategic endeavors and others will not even within the same environment. Thus, we do not expect that factors in the external environment will have as strong of an influence in determining firm performance on positive ESG indicators.
Method
Data and Sample
Choosing a source for ESG data is no simple task (see Cort & Esty, 2020; Delmas et al., 2013, for recent discussions). Chatterji and colleagues (2016) suggest that scholars should provide a solid justification behind a decision that is appropriate to the study. We opted to utilize MSCI ESG KLD STATS (hereafter MSCI STATS), “an annual data set of positive and negative environmental, social, and governance performance indicators applied to a universe of publicly traded companies” (MSCI, 2015) for several reasons. MSCI STATS is the most extensive set of ESG ratings, and over the past 30 years, these data have become the most widely used and critically evaluated metrics of ESG performance (for assessments, see Chatterji et al., 2009; Delmas et al., 2013; Hart & Sharfman, 2015; Mattingly & Berman, 2006). In addition, MSCI STATS is historically one of the only ESG ratings that does not use a materiality-based approach (during the sample period) in which corporations are rated differently depending on their industry classification. For example, Sustainalytics utilizes different key performance indicators and weights depending on a company’s primary industry, whereas Thomson Reuters uses a category benchmarking approach. As a result, these ratings providers do not allow commensurated comparisons of company-level ESG performance across industries, which is a necessary element of our analysis. Finally, MSCI STATS data are advantageous because they clearly delineate the positive and negative ESG performance indicators using separate “strengths” and “concerns” which enables us to explicitly test our tentative thesis regarding the locus of ESG performance.
We conduct our variance partitioning analysis utilizing two different samples. The starting point for our primary results is 2003, the first year that MSCI STATS expanded its coverage to include the entire universe of U.S. publicly traded firms. Namely, coverage is based on the MSCI USA Investable Market Index, which covers 99% of the U.S. stock market, including large, mid, and small cap segments. Similarly, the final year of our primary sample is 2010, at which point MSCI STATS changed its methodology in ways that introduce validity concerns when making year-over-year comparisons, particularly with regard to industry and year effects. Specifically, as the result of an acquisition the company shifted to a financial materiality approach that rendered its post-2010 data no longer comparable (Eccles et al., 2020). In addition to MSCI STATS, as described below in greater detail, other important variables for our study were drawn from the Execucomp database. We also utilized a merger & acquisitions deals database provided by Refintiv to account for mergers between firms in our sample. After matching on these data, we were left with an unbalanced panel consisting of 11,855 firm-year observations. Overall, we observe a total of 2,171 unique firms and 3,109 unique CEOs during the 8 years of our study. The average firm is in our panel for 5.5 years.
In our primary sample, we elected to start in 2003 because while MSCI STATS initially covered the S&P 500 and the FTSE KLD 400 Social Index, the agency later greatly expanded its coverage. Thus, a large number of firms were added to MSCI STATS in this year and such a large influx of new firms could impact the variance partitioning analysis if prior years without these firms were included. However, in a secondary sample, we circumvented this problem by restricting the sample to only firms that were rated prior to this expansion. This had the effect of reducing the number of firms in the panel, but greatly expanded its temporal duration. Specifically, a sample was constructed for 1993–2002 using the same procedure as the primary sample. This time period contained 1,010 firms and we used this list of firms to constrain the later observations from our primary sample such that only firms that appear in the first time period are utilized. In essence, we “lock” the sample from any new entrants after 2002, but continue to capture firms observed in the earlier time period through 2010. This provides a sample period of 18 years in which we follow the 1,010 firms dating to 1993.
Model and Estimation
Variance partitioning is a method of deriving the proportion of variance explained by categorical variables at different levels of analysis. It is typically insensitive to directionality or underlying causal mechanisms; it simply analyzes the proportion of the variation explained by a particular source. For instance, one could use this method to analyze university faculty member salaries and in such a case the levels might include the university and the department. If the university effect is strong, then heterogeneity in the overall sample of salaries can be explained by category membership at this level (e.g., the university at which a faculty member works) because the difference in mean salary from one school to the next is substantial. That is, there is great variation in faculty salaries between universities. If instead the department effect is strong, then the heterogeneity in salaries is explained better by whether a faculty member is in say the management department versus the engineering department, independent of the specific university. That is, the variation is explained within universities and between departments. Overall, variance partitioning models excel in distinguishing which categories matter in explaining the dependent variable.
As Quigley and Hambrick (2015) describe the method, the independent variables are essentially operationalized as very large sets of dummy variables. Industries, years, states, firms, and CEOs are each assigned unique dummy variables and thus the analysis usually includes a few thousand indicator variables. Of course, dummy variables are not novel to regression analysis, but a traditional linear regression model with such an extreme number of variables produces unique coefficients for each dummy variable that will each vary in magnitude, direction, and significance, thus rendering the output illegible. In contrast, variance partitioning is able to generate a random effect for each level or category of dummy variables thereby revealing the proportion of the overall variance explained at that level.
This resulting percentage of variance explained addresses the inquiry advanced by Rumelt (1991): “How much does industry matter?”. The higher the percentage of variance explained by a given level or category, the more it matters in explaining the heterogeneity in the dependent variable. Each random effect encapsulates possible variables at the respective level of analysis (e.g., munificence at the industry-level, innovation at the firm-level, or narcissism at the CEO-level). This is advantageous in that actually including such variables would considerably diminish the sample, but variance partitioning is able to zoom out and provide a holistic understanding of the relative importance of the levels in totality while preserving the entire sample. In some ways, the most intriguing results are any weak effects because a low percentage implies that it is essentially irrelevant what category membership a firm has at that level. For example, in our analysis, a negligible CEO effect would indicate that no amount of variables at the CEO-level would be useful to explaining variance in firm ESG performance. Hence, by including multiple levels in the variance partitioning analysis simultaneously, we can ascertain what factors are most salient relative to one another.
Although some previous studies of the locus of performance utilized ANOVA (McGahan & Porter, 1997, 2002; Rumelt, 1991), the current state of the art is multilevel modeling (MLM) which is advantageous because it can better account for the nested structure of the data (Crossland & Hambrick, 2007; Misangyi et al., 2006; Quigley & Hambrick, 2015). In this article, we use MLwiN, a software program developed by researchers affiliated with the Centre for Multilevel Modeling at the University of Bristol (Rasbash et al., 2009). This program is computationally optimized for MLM and is especially adept at handling complex structures. We utilized runmlwin, an extension of the MLwiN software available for Stata (Leckie & Charlton, 2013). This particular analysis uses a cross-classified structure (Rasbash & Goldstein, 1994) to derive the variance components as well as Markov Chain Monte Carlo (MCMC) estimation techniques (Browne, 2015). A cross-classified structure enables a more accurate representation of how the independent variables work in conjunction with one another. For example, firms can be considered as nested within states as well as nested within industries, but neither states nor industries are assumed to be at a higher level in the hierarchy than the other. The MCMC technique establishes priors using a regular hierarchical structure followed by a burn-in value of 10,000 iterations to derive a satisfactory starting point. The Markov Chain is a length of 100,000 to achieve the equilibrium distribution. In Appendix A, we report robustness checks related to the MLM estimation techniques.
Dependent Variables
This study uses different configurations of the MSCI STATS data for the dependent variables in each set of models. Table 1 displays all of the MSCI STATS dimensions and the indicators used within each category to generate the measure of ESG performance for each firm.
MSCI STATS Indicators.
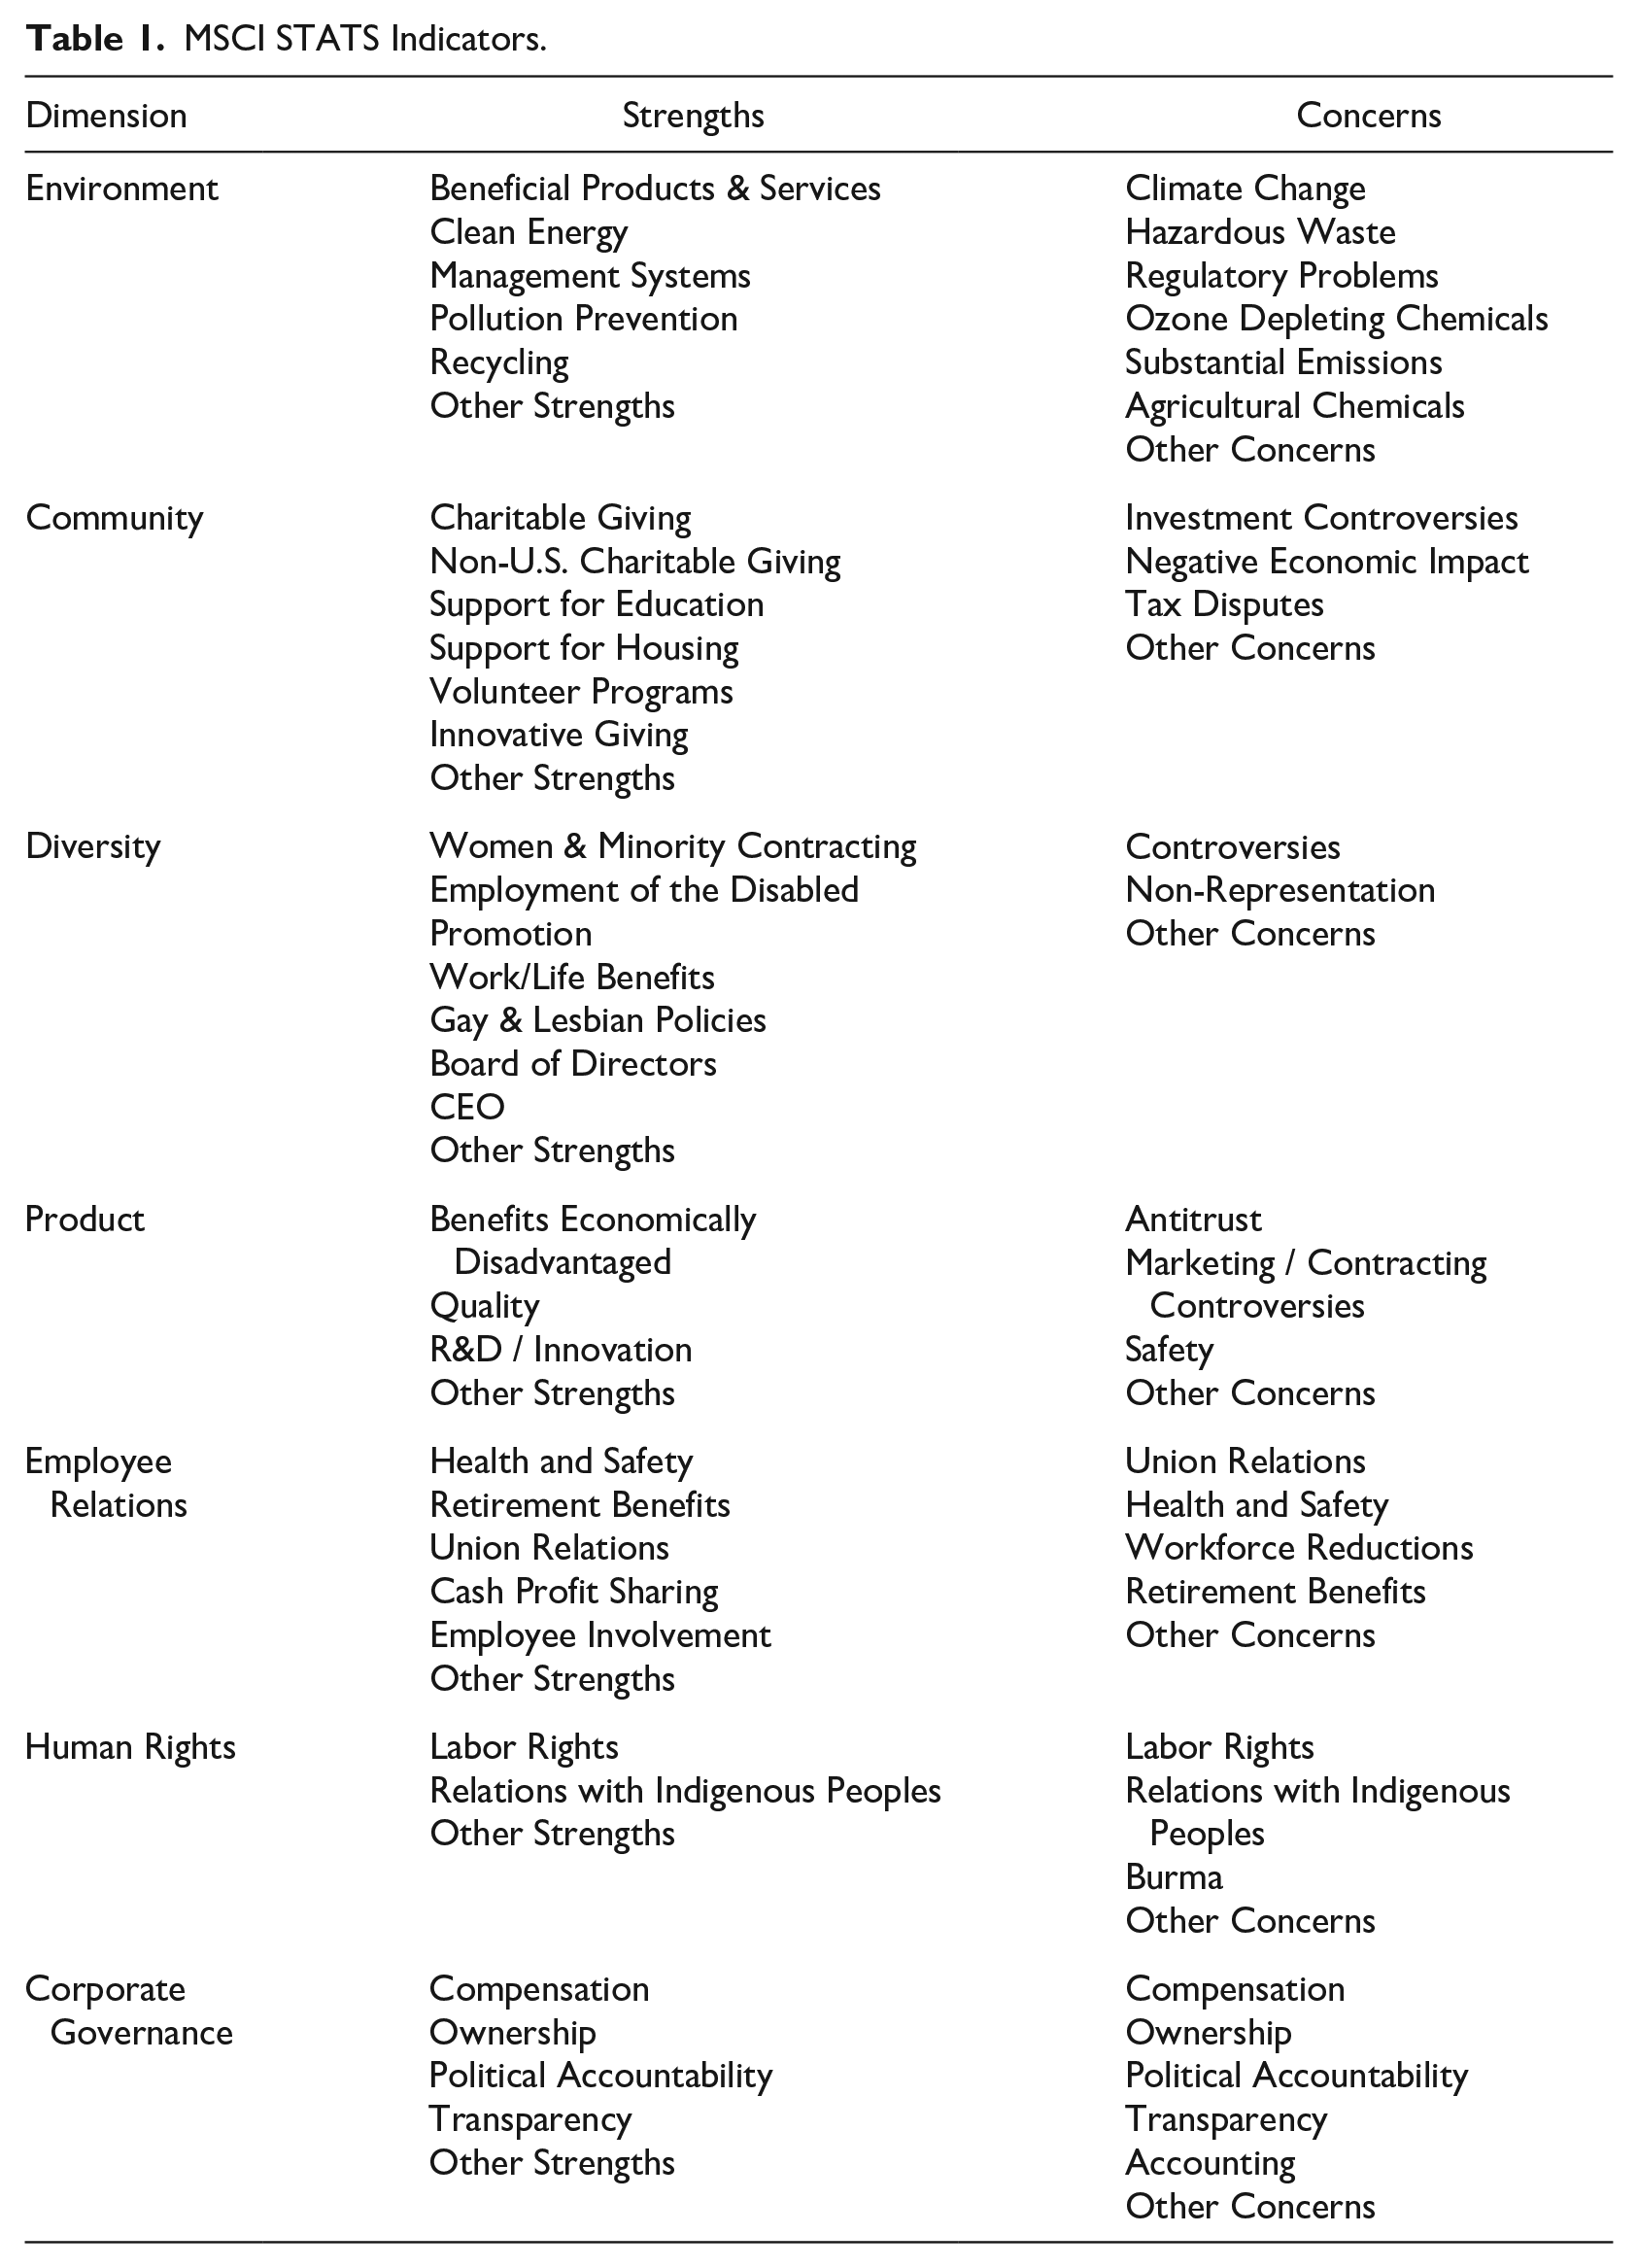
Our first dependent variable, net ESG, is calculated by summing the total of all MSCI STATS strengths from all categories and subtracting the total of all concerns indicators. Our second set of dependent variables, ESG strengths and ESG concerns, utilized the disaggregated MSCI STATS strengths and concerns totals, the most common approach among prior studies (Kotchen & Moon, 2012; Manner, 2010; Strike et al., 2006). 2 These variables allow the models to differentiate firms that may have identical net ESG performance but as a result of different configurations. For instance, a company with 2 strengths and 0 concerns will have a net score of 2; similarly, a company with 12 strengths and 10 weaknesses will achieve the same net ESG score of 2. Clearly, however, the practices of these two firms are not equivalent. The third set of dependent variables, net E, net S, and net G, was calculated by summing the total of the strengths and subtracting the total of the concerns for each of the three dimensions of ESG performance. Finally, the fourth set of dependent variables further disaggregates the three dimensions into their positive and negative indicators (e.g., E strengths and E concerns). All dependent variables were normalized using a Z-score transformation.
Independent Variables
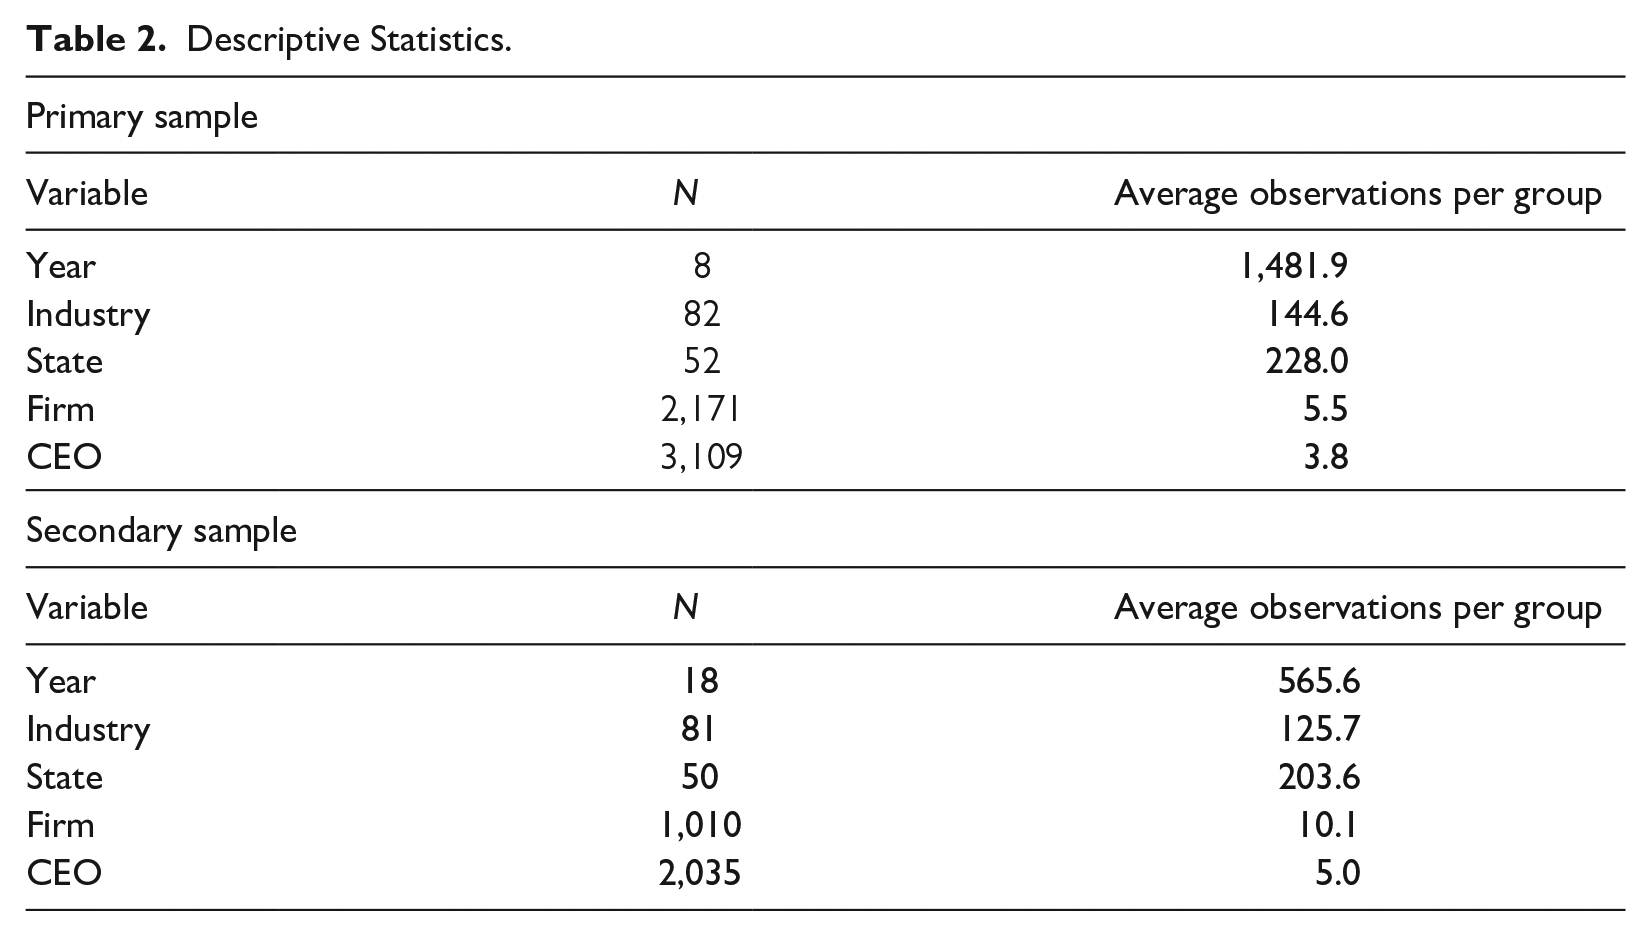
The independent variables in each model were year, industry, state, firm, and CEO. As mentioned previously, the analysis can be understood as comprising thousands of dummy variables. All of the independent variables were constructed as categorical factor variables. For example, a factor variable is used to code each CEO by their executive ID from the Execucomp database such that in any given year each firm has a unique value. A three-digit NAICS code was used as the measure of industry, and the location of the firm’s headquarters was used to reflect the state. Table 2 displays the number of groups or possible categories for each level of analysis and the average number of observations per group for both the primary and secondary samples (e.g., an average of 5.5 observations per firm in the primary sample).
Descriptive Statistics.
Results
Table 3 displays the results of the first model for net ESG. In this model, results are displayed for each random effect. The mean-variance estimation represents the variance components, and a percentage of variance explained is computed by dividing the variable variance component by the sum of all variance components, including the residual, p values, standard errors, and effective sample sizes (ESS), which are also displayed. Standard errors are computed by dividing the standard deviation of the random effect by the square root of the ESS. To conserve space, in the remaining tables, only the percentage of variance explained is displayed, but as is typical of previous variance partitioning studies, the p values for all remaining models similarly take values of 0. The results of the model suggest a few things. First, relative to our theoretical distinction between internal and external effects, it is clear that the internal effects are responsible for the largest proportion of variance in net ESG with the firm dominating at 47.38%. In contrast, the external effects are relatively weak with the strongest effect being the industry at 5.65% and the cumulative percentage of all external effects being only 7.71%.
Net ESG Results.
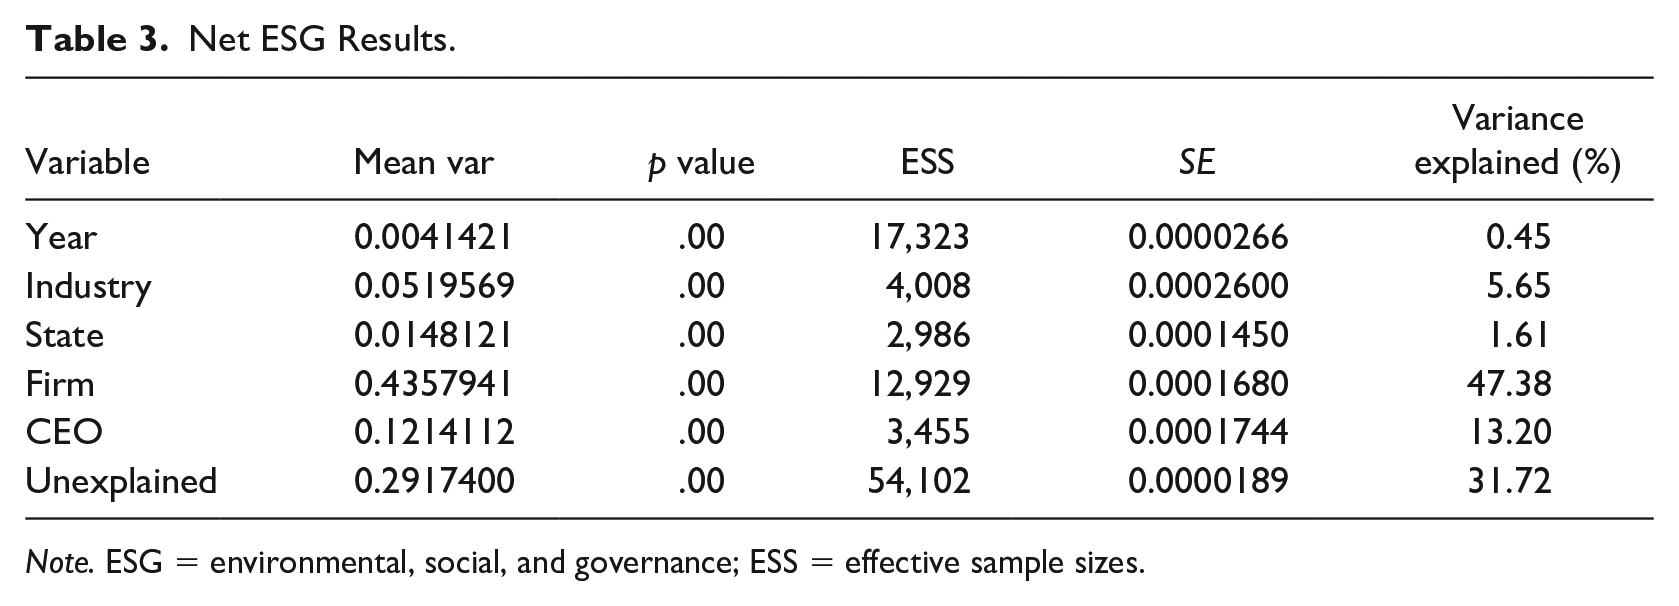
Note. ESG = environmental, social, and governance; ESS = effective sample sizes.
Table 4 reports the results of the second set of models in which we distinguish between ESG performance on positive and negative indicators as measured by the uncombined total strengths and total concerns. The differences relative to the previous results are quite revealing. Consistent with our theoretical expectations, the concerns model has higher percentages of variance explained for all of the external effect variables, whereas the strengths model has higher percentages of variance explained for both the internal effect variables. A particularly noteworthy outcome is that the industry effect explains significantly more variance in the ESG concerns model. At 17.83%, it is more than 3 times larger than in the previous net ESG performance results and more than 5 times larger than the total strengths model. Overall, the year effect is small, and the state effect continues to explain the negligible proportion of the variance in both cases. For the internal effects, the firm effect clearly explains the greatest proportion of the variance in both models although it is higher in the case of strengths at 65.06% compared with 51.95% in the concerns model. The CEO effect likewise follows this pattern. These two models demonstrate that there is a significant asymmetry in the locus of ESG performance between positive and negative indicators.
Strengths and Concerns Results.
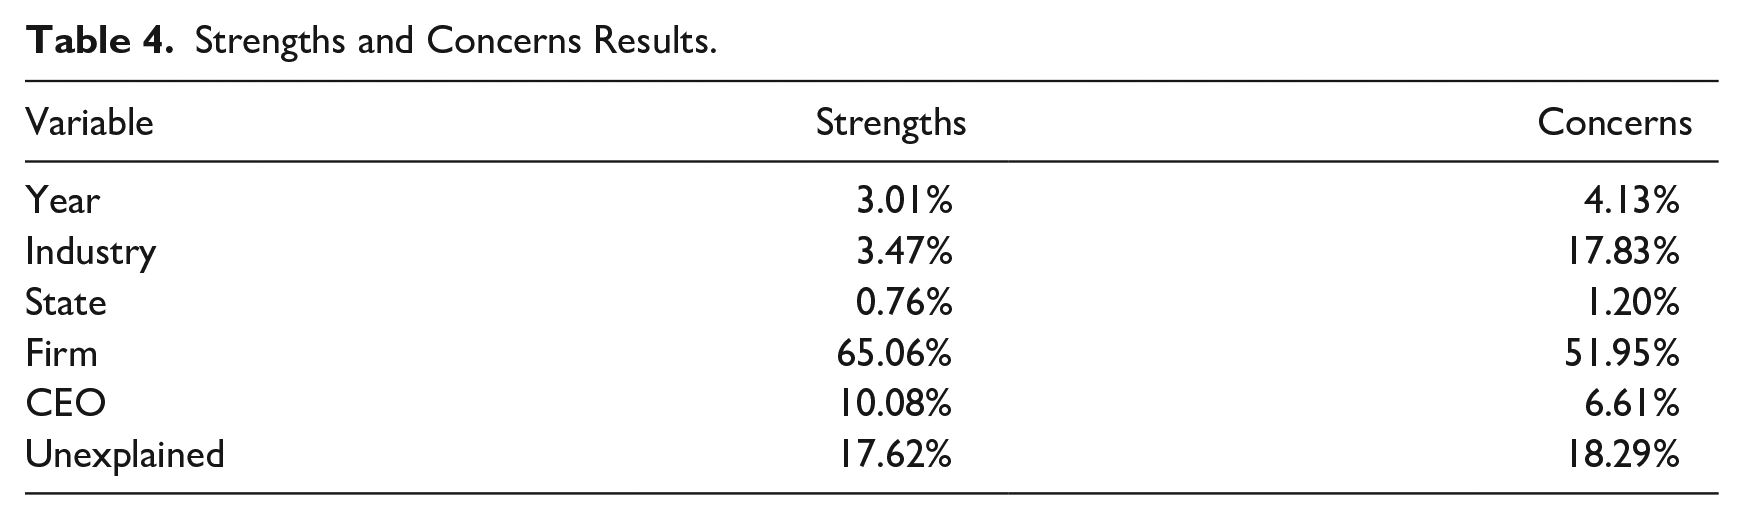
Table 5 reports the results of the third set of models which delineate between the different dimensions of ESG performance rather than positive or negative as measured by the net environment, social, and governance performance. Similar to the results in Table 2, the results of this analysis reveal key differences between the different dimensions of ESG. First, for performance in the environment dimension, the external locus appears to be quite strong with a year effect of 7.49% and an industry effect of 16.71% although the state effect remains weak at just 0.83%. However, for social and governance performance, the external effects are relatively weak. The firm effect remains the single largest effect, and this is particularly true of social performance in which the firm effect is 56.48%, which is almost 20 percentage points above the next lowest firm effect. Finally, the CEO effect explains a moderate amount of variation but does not vary substantially between dimensions of ESG performance.
Disaggregated ESG Results.
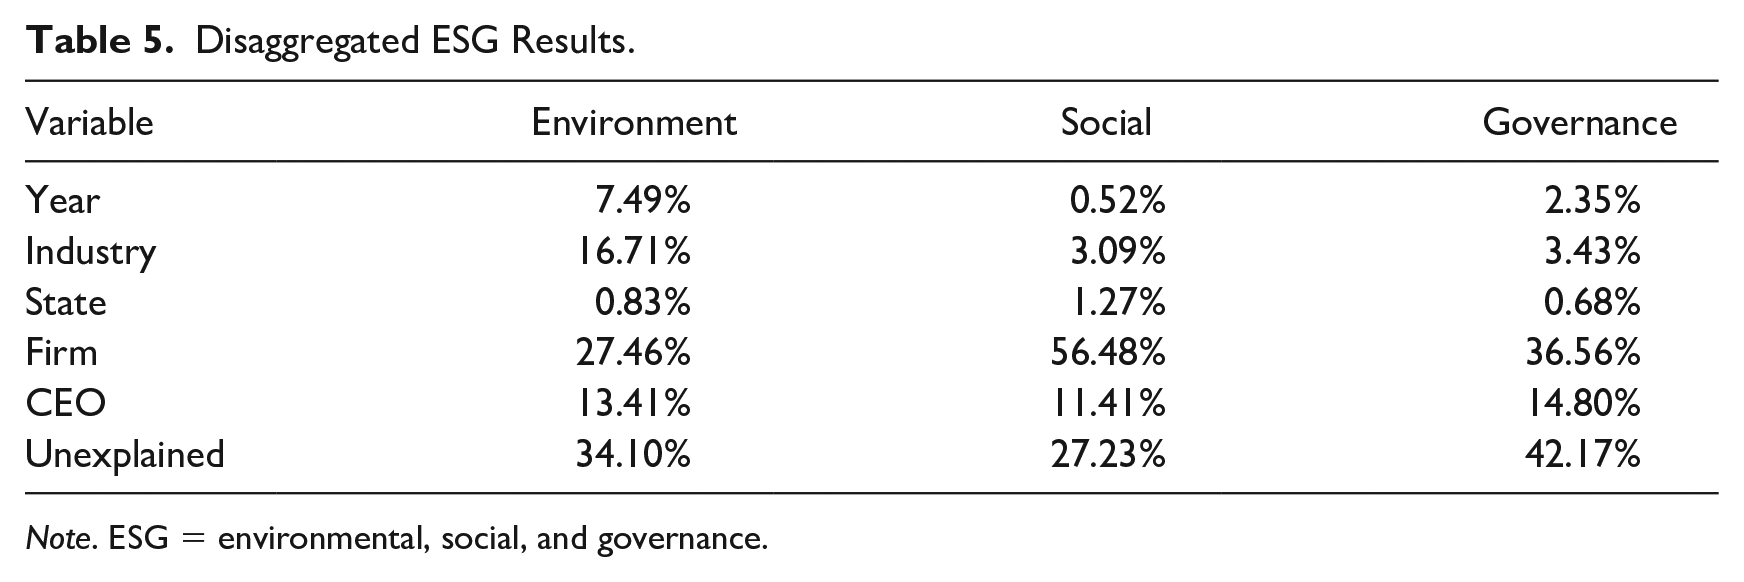
Note. ESG = environmental, social, and governance.
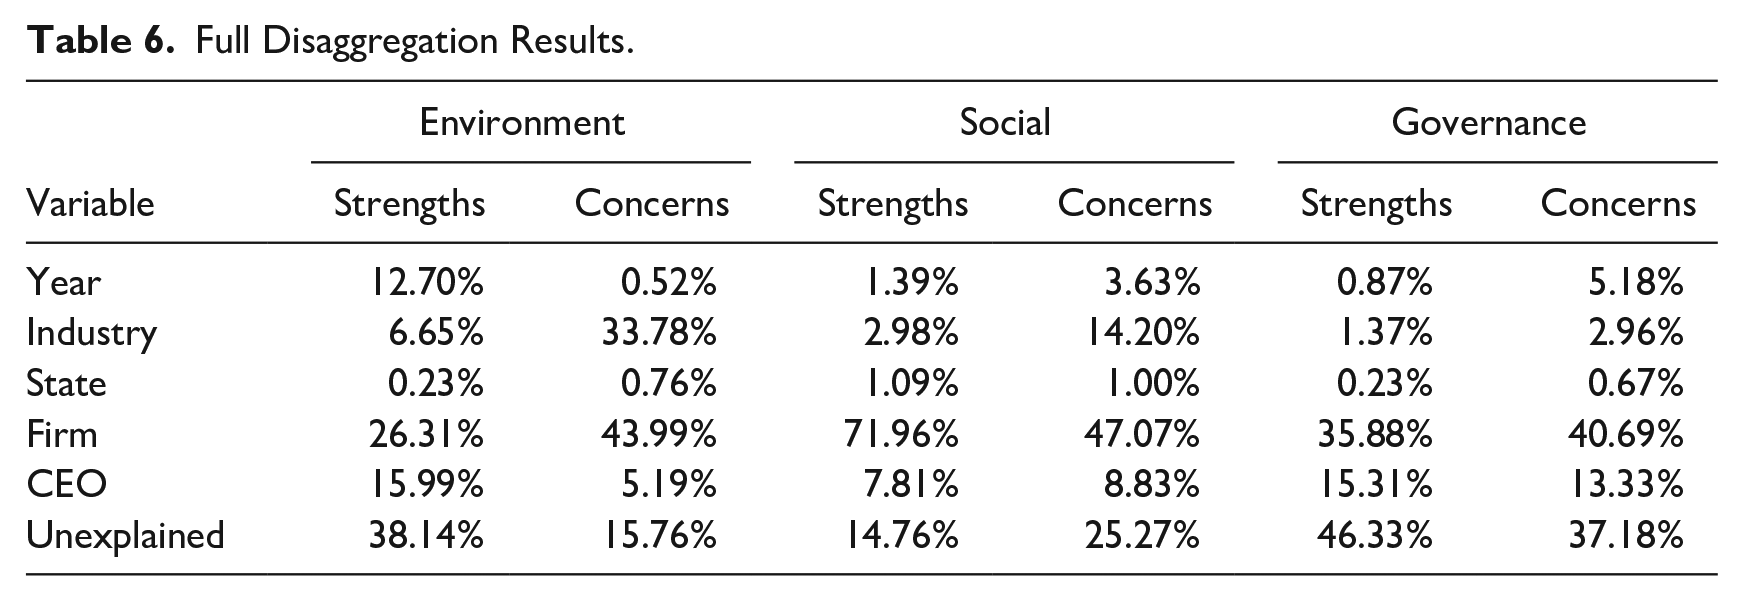
Table 6 presents the last set of results in the primary sample for which we fully disaggregate the models into total strengths and total concerns within each dimension. These results show how the salience of the factors may have been concealed by the combination of strengths and concerns even within a particular dimension of ESG performance. For example, in the previous results, the industry effect for social performance was a mere 3.09%, but in our social concerns model, it rises to 14.20%. Similarly, the year effect and industry effect seemed moderately important to environmental performance in aggregate, but upon deeper analysis, the year effect is a negligible 0.52% in the concerns model, and likewise, the industry effect explains only 6.65% of the variance in the strengths model but a substantial 33.78% in the concerns model. Thus, through disaggregation, we obtain a more accurate depiction of what matters in explaining the variation in distinctive positive and negative indicators of ESG performance across divergent dimensions of ESG. We also see support for previous findings with the external effects being stronger in the concerns results than in their strength counterparts with the exception of the year effect in the environment strengths model. The firm effect remains the largest effect in all cases and as in the previous results, it is substantially more important for social performance where it is an extremely large 71.96% in the strengths model and 47.07% in the concerns model which are the two largest firm effects of any of the models.
Full Disaggregation Results.
In Table 7, we display two sets of results utilizing the secondary sample. In the first, we rerun the original 2003–2010 time period but constrain the sample to include only the subset of firms utilized in our secondary sample. This allows us to test whether the primary and secondary samples materially resemble each other. The results of this set of models are rather similar to the primary sample with a few minor differences. First, the industry effect is generally slightly elevated, while the firm effect is generally slightly diminished. Empirically, this outcome is unsurprising as reducing the observations in the panel results in fewer firms per industry. The other categories are within a small percentage difference except for the year effect which seems to have increased substantially in the environmental strengths model. This may indicate that environmental strengths for the 1,010 firms in both samples were more rapidly fluctuating between years than for firms covered only by the primary sample.
Secondary Sample Results.
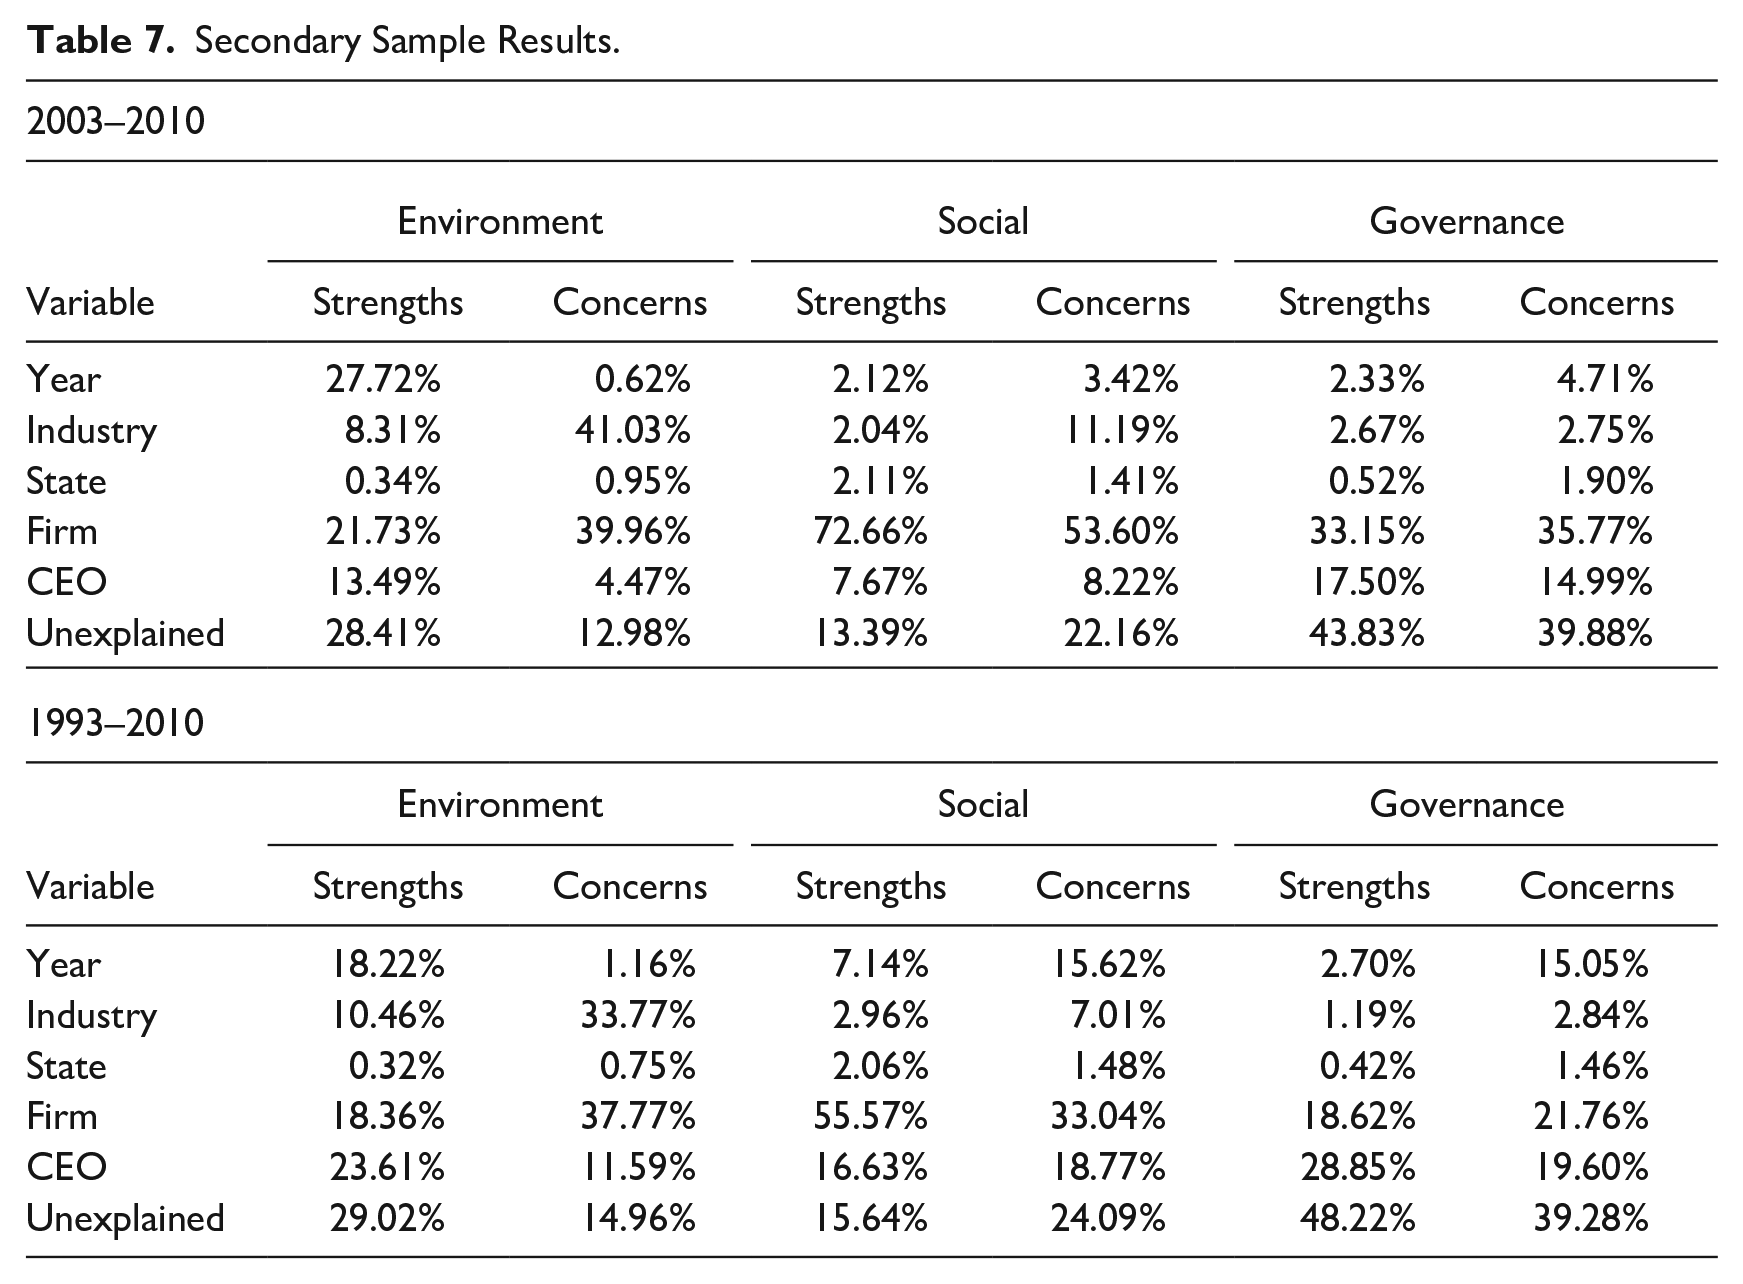
In the second set of results in Table 7, we run the analysis on the entire 18-year period of the secondary sample. Comparing these results to the 2003–2010 period, we can see that for the majority of the effects the results are relatively similar. One interesting deviation is that the year effects in a few of the models are quite different. For example, the year effect for social concerns was only 3.42% in the 2003–2010 time frame, but increased to 15.62% in the 1993–2010 time frame. However, the most intriguing difference is with regard to the internal effects. After extending the panel to 1993, the CEO effect increases in all models, from an average of 11.06% (Table 7, 2003–2010) to 19.84% (Table 7, 1993–2010); conversely, the firm effect decreases in all models, from an average of 42.81% to 30.85% (Table 7, 2003–2010 vs. Table 7, 1993–2010). This is an empirically reasonable outcome because the original 8-year panel is more limited in its ability to capture differences in CEO tenure. Extending the length of the panel allows for more CEO changes to be captured for the same set of firms. For example, in the primary sample, there are 1.43 CEOs per firm on average whereas in the secondary sample there are 2.01 CEOs per firm on average. Despite our previous models having lower CEO effects, the results of our secondary sample suggest that this is an empirical limitation and that, as a practical matter, the CEO effect is actually larger than reported.
Discussion
In this article, we sought to contribute to answering a vital question: What factors explain variation in ESG performance between firms? Broadly speaking, we distinguished between internal and external drivers and theorized the potential effects of five different categories of effects (i.e., firm, CEO, industry, year, and state). Utilizing MSCI STATS and Execucomp data together with variance partitioning methods pioneered in earlier studies of firm financial performance, we analyzed how much of the variation in ESG performance these factors explained. Our findings suggest that firm and CEO effects are salient determinants across all ESG dimensions. Furthermore, the final set of disaggregated results shows that the other factors are highly dependent on which dimension is being modeled. In this section, we revisit some of the more surprising aspects of our results with an eye to identifying the article’s key contributions. We close by articulating notable avenues for future research.
Extending the Locus of Performance to the Triple Bottom Line
Our study contributes to the locus of performance literature, one of the most fundamental and classic literature in the field of strategic management, by extending it in an entirely new direction. Moving beyond the narrow question of firm financial performance (Hoskisson et al., 1999; Rumelt, 1991; Schmalensee, 1985), our article investigates the more modern perspective of a triple bottom line comprising profit, people, and planet (Elkington, 1998). Specifically, by modeling ESG performance as the dependent variable, we are able to identify the extent to which internal and external factors explain heterogeneity in such performance. We find that internal factors are the most significant determinants of heterogeneity in firm ESG performance regardless of which bottom line is being modeled.
In addition, we ran our models on progressively more disaggregated dimensions of ESG performance which reveals the extent to which consolidated ESG measures may produce misleading conclusions. Amalgamating the different ESG dimensions into a single score obscures the complex multidimensional nature of ESG performance. Instead, our results highlight the need to distinguish between positive and negative indicators of ESG performance and differentiate between the dimensions of ESG; both are imperative to fully understanding the drivers of heterogeneity in corporate ESG performance.
The importance of these differences is further evident in comparison with the traditional locus of performance results. For instance, in Table 8, we compare our secondary sample results with those of ROA from Quigley and Hambrick (2015) whose research is the closest approximation of our own as it uses multilevel modeling and covers a similar sample. Specifically, we reproduce their 1990–2009 sample results that cover largely the same time frame and contains 1,355 CEOs as compared with our 2,035. Such a comparison of the results allows us to understand the similarities and differences between the salience of the different factors to profitability versus the other components of the triple bottom line.
Variance in the Triple Bottom Line.
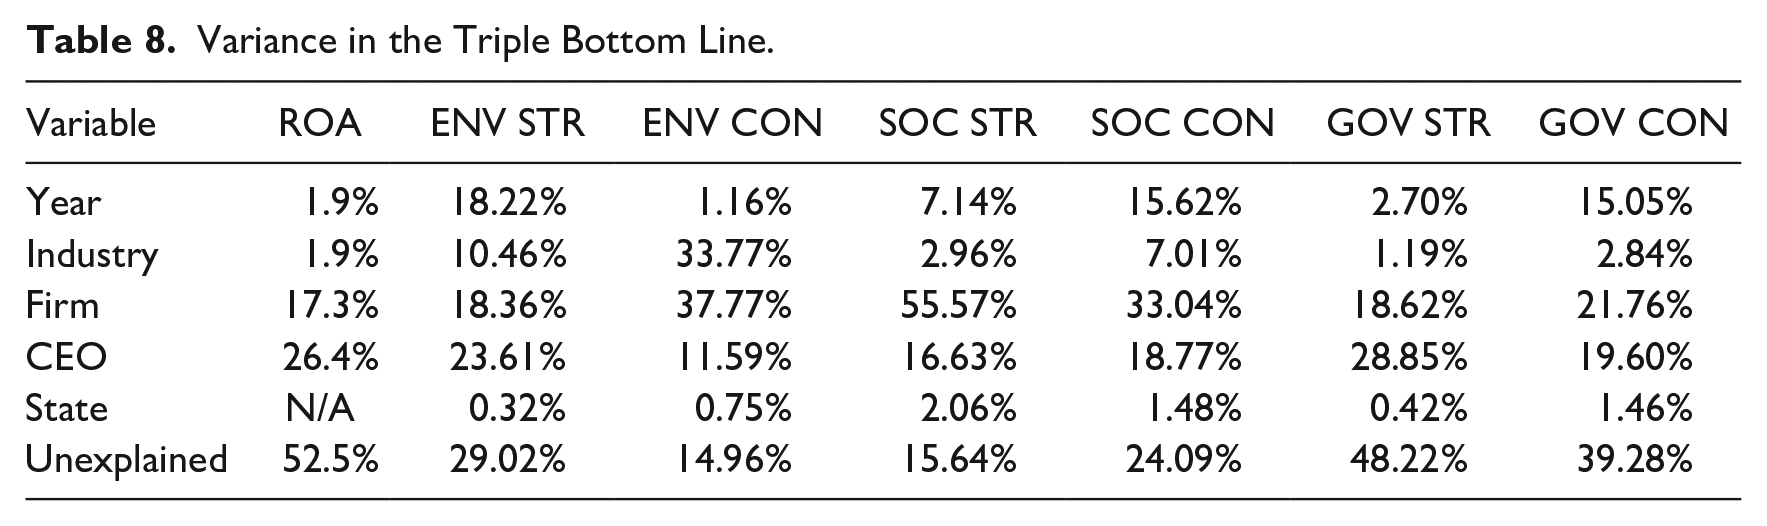
As an adherent of the industrial organization paradigm, Schmalensee (1985) initiated the comparative analysis of the locus of performance in an effort to argue for the superiority of the industry as the most significant factor in determining the profitability of firms. Subsequent scholars rejected this thesis and instead demonstrated that intra-industry heterogeneity among firms was significantly more important. Our findings contribute to this line of inquiry by corroborating the relative importance of the firm effect in explaining the heterogeneity in ESG performance. Yet, we also find that the factors that matter most depend on the particular bottom line in question. Put differently, to the extent that researchers are interested in a single bottom line of economic rents and accounting returns, external factors may be relatively unimportant, but to the extent that researchers are interested in other outcomes, in some circumstances external factors such as the year and industry effects are critical.
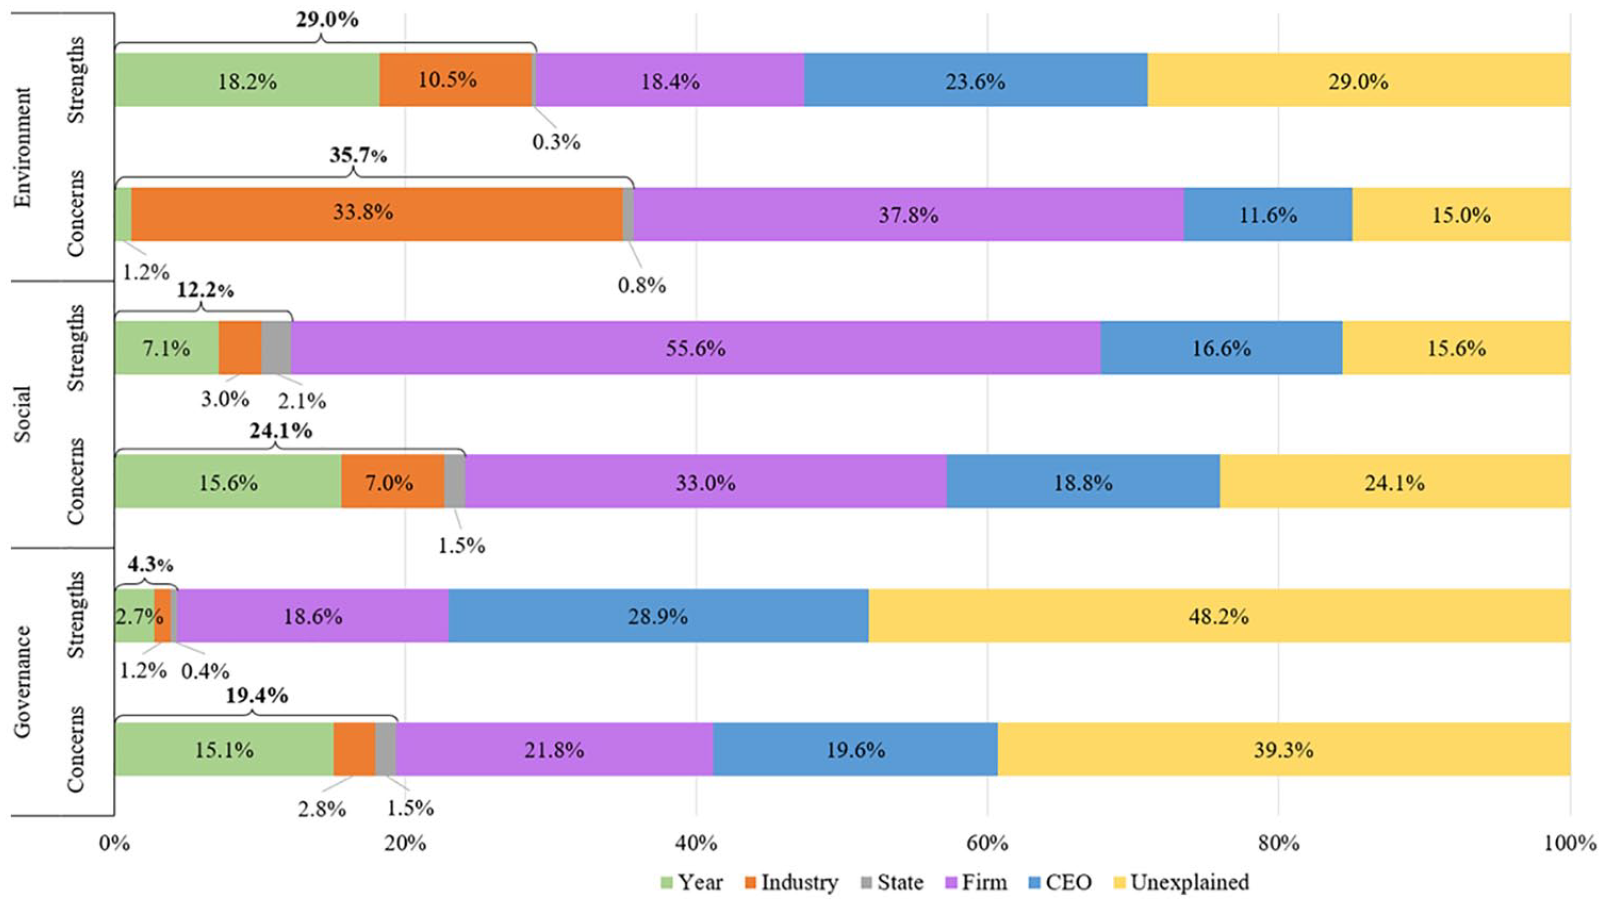
One of the core findings of this research is the confirmation of our initial thesis that negative ESG performance is generally attributable to external factors, whereas positive ESG performance has more to do with internal factors. This becomes especially evident when our results are visualized in graphical form. Figure 1 provides a visualization of the 1993–2010 results with the cumulative percentage of external factors demarcated above each model’s results. As can be seen from the figure, concerns indicators are substantially better explained by external factors than are their strengths counterparts in the same dimensions. In the concerns models, 35.7% of the variance with regard to environmental concerns is explained by external factors, followed by 24.1% for social concerns and 19.4% for governance concerns. Conversely, for the strengths models, internal factors explain 72.2% of the variance with regard to social strengths, followed by 47.5% for governance strengths and 42.0% for environmental strengths. Setting aside these particulars, as a more general observation: a significant portion of the variance in all dimensions is explained by internal factors, whereas external factors are most germane when explaining difference in ESG concerns.
Comparison of Effect Sizes Across ESG Dimensions.
The weak influence from external factors in explaining the variance in strengths is an interesting outcome of our analysis. For example, the weak industry effect in the social strengths model (i.e., 3.0%) suggests that industry membership is basically irrelevant in explaining this dimension of ESG performance. In other words, differences in positive social performance are a strategic endeavor whereby firms differentiate themselves from others in their environment. One exception to this overall pattern is the environmental strengths dimension which shows a rather high external locus, particularly with regard to the year effect. This suggests that external factors may be especially salient to the “planet” bottom line for both positive and negative indicators of ESG performance. Nevertheless, this effect size remains lower than that of the environmental concerns model. Similarly, the strong external factors in the concerns models indicate that negative ESG performance is to a larger extent shaped by the external environment.
These findings are pivotal to understanding the sustainability of corporations “on the ground.” As we theorized earlier, underpinning ESG ratings are a set of sustainability practices that are assessable, salient, and worthy of the resources required to assess them. Thus, ESG is akin to an epistemological project intended to derive insights for stakeholders about which firms are sustainable and which are not. Our findings around multidimensionality suggest important implications for the relationship between these two. Aggregation of the indicators into a “net” score actually reduces their utility in generating knowledge about the very sustainability practices they are meant to measure. Even within the same dimension, positive and negative indicators may be the result of markedly different sources (Chatterji et al., 2009).
Our results likewise indicate that not only do different indicators measure fundamentally distinct practices, but there are important differences between the factors that explain variation in performance and by extension variation on disparate elements of sustainability. Some ESG rating agencies are moving to increasingly large sets of indicators to determine performance, including artificial intelligence and big data approaches (Cort & Esty, 2020). While there is nothing inherently wrong with more indicators, indeed our analysis would suggest the importance of more specific measures; to the extent such proliferating measures are haphazardly combined, much of the nuanced complexity of real firm sustainability may be missed. Eccles and colleagues (2020), for example, note how simply not aggregating indicators has the effect of requiring investors to actually engage more reflexively with the practices themselves when informing their decisions.
Our contribution then highlights that different dimensions of corporate sustainability are not readily “additive” and suggests that an emphasis on specific sustainability practices may be more informative. This also may help scholars reach more nuanced understandings of “greenwashing” (e.g., Delmas & Burbano, 2011; Lyon & Montgomery, 2015). For instance, one might conjecture that it is harder to mislead performance on an individual indicator than it is to do so for aggregate scores wherein performance on positive indicators can make up for a performance on negative indicators even if they measure vastly different sustainability practices. It also allows different stakeholders to use ESG ratings for different reasons. For example, policymakers might utilize ESG ratings to identify opportunities for regulation rather than to invest in individual firms. Such insights likely require knowledge of the specific kind of performance rather than a consolidated score.
What Really Explains ESG Performance?
Our study contributes to the literature on ESG by simultaneously investigating different levels of analysis which enables a direct comparison of the influence of each of the sources of variation relative to one another. Given that ESG ratings are used to capture salient corporate sustainability practices, scholars and practitioners can leverage our results to further the ESG performance of corporations in ways that foster real sustainable change. Our analysis reveals the relative importance of different factors, and thus, the resulting effects represent what we would characterize as points of intervention (cf. Meadows, 1999). Strong effects delineate the levels of analysis at which intervention efforts are likely to be most effective in realizing change, whereas intervention efforts in areas with weak effects are likely to achieve relatively less impact. For example, we found that the state effect was negligible. Although it could be that novel interventions at the state-level may have an impact in the future, intervention efforts at other levels appear more promising in the short term.
The vast majority of heterogeneity in ESG performance across all models is explained by internal factors. This suggests that both the CEO and the firm are important points of intervention for fostering improved ESG performance among corporations. Recently, Blackrock executive Larry Fink has been highlighting the ESG imperative in his annual letters to CEOs (BlackRock, 2017, 2021). For practitioners, our results provided further evidence that leadership truly does matter, and executives are able to serve a key role in driving their firms toward achieving ESG performance, or in thwarting such results (Wernicke et al., 2021). For scholars, our results highlight the importance of research on both the firm and the top management team in increasing the ESG performance of corporations. In our view, an important area for future research relates to better disaggregation of the different ESG dimensions as well as more detailed examinations of specific mechanisms at both the firm and the CEO-level.
Indeed, although our analyses distinguish which levels of analysis are salient, they do not specify underlying causal mechanisms. While we clearly see that internal effects are important in multiple dimensions, numerous theoretical questions emerge with regard to the complexities of the ESG construct. It is unclear whether the different levels and dimensions of variation explained in the models are the result of a small number of key variables, or a wider and more diverse set of factors. For example, might CEO narcissism lead to higher levels of one type of ESG performance and lower levels of another? Are there executive characteristics that lead to ESG performance in all dimensions? The recent literature emphasizing CEO political ideology has utilized an aggregate score (Chin et al., 2013), but most scholars argue for the need to differentiate between strengths and concerns (Manner, 2010; Strike et al., 2006). Manner (2010) found that both female CEOs and an educational background in the humanities were positively associated with MSCI strengths, whereas an educational background in economics was negatively associated with MSCI strengths. However, in the MSCI concerns model all of these variables become insignificant (Manner, 2010). Our findings suggest that CEOs matter for both strengths and concerns in all dimensions. Yet, we still possess limited knowledge of which specific variables are associated with which specific dimensions and the extent to which different predictors can be reconciled. We hope our findings can serve as a call to action for scholars to reflexively consider and further unpack the multidimensional nature of ESG within the internal dimensions of the firm and the top management team.
In the environmental concerns model and to a lesser extent the environmental strengths and social concerns models, the industrial environment played an important role. Future researchers interested in examining factors that impact the degradation of the natural environment such as climate change (Ferraro et al., 2015; Howard-Grenville et al., 2014; Wright & Nyberg, 2017) would be well-served by studying the industry level of analysis. Recent work suggests that formal industry regulation is one effective way of reducing environmental impacts as opposed to industry self-regulation which often proves unsuccessful (Aragòn-Correa et al., 2019). Alternatively, sustainable innovation can also serve as an important facilitator of improving industry environmental performance. For example, green concrete is an emergent technology that could transform the construction industry to eliminate or reduce the currently high level of emissions (Suhendro, 2014). Such sustainable innovation is especially intriguing because it rewards firms with patents that prevent imitation and create competitive advantage (Barney, 1991). This paradoxically encourages innovation yet also delays the diffusion of such sustainable innovations across the industry for decades. In the context of the Alberta oil sands industry, Bowen and colleagues (2018) find that firms were able to successfully collaborate on sustainable technology, but only for localized issues in which the technology could not be profitably sold elsewhere. Similarly, green concrete suffers from institutional barriers to adoption (Suhendro, 2014). To further add to this complexity, it is unclear whether all industries actually can be incorporated into an ESG paradigm or whether certain industry business models will become obsolete. The evidence suggests that those that do not align with a new paradigm will use their power to contest their displacement by any means necessary (Brulle et al., 2020; MacKay & Munro, 2012).
One felicitous and related area of inquiry is the literature on sustainability transitions (Crifo et al., 2019; Delmas et al., 2019; Markard et al., 2012), a burgeoning body of literature (Köhler et al., 2019) that seeks to understand shifts toward sustainable socio-technical systems (Geels, 2004, 2010). Sustainability transitions of socio-technical systems are particularly pertinent to our results because they involve the transition of industries into an ESG paradigm, but yet take into account a complex set of institutional arrangements including technological developments, powerful incumbents that resist or facilitate adoption, and policymakers that support or hinder transition. For example, scholars have studied how the electric utility industry is transitioning toward socio-technical systems based on renewable energy and have demonstrated a complex set of arrangements including incumbents, policy, customers, and other important actors in shaping the transitions (Geels et al., 2016; Weigelt et al., 2021). Our findings clearly show that the industrial environment is a critical point of intervention in reducing environmental degradation, and thus, sustainability transitions are a ripe context for understanding how this can feasibly be accomplished. There are many interesting avenues for scholars to utilize single industry empirical studies in industrial contexts as diverse as electricity generation, construction, agriculture, and others to further explore mechanisms by which sustainability transitions occur and to elucidate the dynamics by which we can transform the dirty industries that we have shown are responsible for severe ESG concerns. This will enable us to understand not just real sustainable change within organizations, but also whether and to what extent real sustainable change is occurring within the systems in which they are embedded.
Finally, it is worth concluding by noting the presence of a fair amount of unexplained variance. Some is always expected, but notably other scholars have conceptualized the unexplained variance as potentially representing change over time (Misangyi et al., 2006; Rumelt, 1991). This leads to some possibly compelling implications for future researchers. On the one hand, the large firm effect we found suggests that, in line with organizational inertia arguments (e.g., Dahlmann & Brammer, 2011), firm-level ESG performance is quite sticky. On the contrary, the sizable unexplained variance may be indicative of shifts that cannot be explained simply by a change in CEO. This change may derive from factors that are not conducive to measurement via dummy variables like employees within the firm. For instance, internal social movements (e.g., Briscoe & Gupta, 2016) may be one explanation for why firms become more sustainable. Collins (2011) wrote an influential book that emphasized how firms go from “good to great” and we might charge future scholars with likewise exploring how firms that previously had subpar ESG performance were able to change despite the stickiness of the firm effect. In addition, we might ask if there are cases of firms who had high ESG performance and then subsequently fell from grace. For example, Wright and Nyberg (2017) demonstrated how corporate environmental initiatives were only short-lived, ultimately deteriorating after initial support for them waned. Thus, the unexplained variance itself raises interesting theoretical questions for future researchers to tackle about how real sustainable change is fostered within corporations.
Limitations and Future Research
In closing, we acknowledge a few key limitations of this paper. First, the selection procedures of the samples in this paper result in only firms successful enough to be present in both the MSCI STATS and Execucomp databases. This means that the study is limited to explaining the determinants of ESG performance for large(r) publicly traded companies. That said, the primary sample included 2,171 unique firms suggesting sufficient coverage of firms beyond the S&P 500. Furthermore, large firms are responsible for a sizable portion of commerce and thus the impacts of ESG performance from these companies are significant and worthy of understanding in their own right (Grant et al., 2020).
Second, this study focuses on a single country. However, in doing so it allows for analysis without limitations imposed by differences between countries on the actual practice of ESG measurement (e.g., consider national differences in corporate governance). Also, a single country study allows the use of Execucomp data which enables an investigation of the CEO effect. This task would otherwise be challenging across national contexts in which similar and comparable data are not readily available. Future researchers could try to overcome this limitation by using a different country ESG data set such as the China Listed Firm Corporate Social Responsibility Research Database as done by recent researchers (Wang & Qian, 2011; Zhang et al., 2019) or by using universal metrics that are able to transcend national borders. Doing so would require locating CEO data from each country and ensuring materiality concerns were accounted for. However, successfully accomplishing this would allow for the extension and comparison of our analysis and results across various national contexts. For example, it is possible that industry effects and regional effects would operate differently in societies with dominant and powerful governments such as China.
In conclusion, our study sheds light on the determinants of heterogeneity in ESG performance at multiple levels by analyzing the relative importance of the sources of variation. It elucidates the importance of both the organizational-level of analysis and the effects of leadership on ESG performance and further shows the increased salience of external factors in explaining negative indicators of ESG performance. Finally, it demonstrates the importance of disentangling the complex dimensions of ESG in explaining the heterogeneity in ESG performance of publicly traded corporations.
Footnotes
Appendix A. Robustness Checks
We have conducted several robustness checks of the models which are displayed in the tables below. First, as the MCMC estimation uses a manually specified length of the Markov Chain to generate mean variance, we ran the net ESG analysis again with 3 different levels of chains and burn-in values. The burn-in and chain length in the reported models was set to 10,000 and 100,000 respectively, and included in Table A1 is the same analysis using a burn-in and chain length of 5,000 and 50,000 as well as 15,000 and 150,000. The percentage of variance explained experiences some change with increases in the specified burn-in and Markov Chain but is relatively stable suggesting an adequate ability to estimate the variance components appropriately.
Second, to test the overall effectiveness of the MCMC estimation method with cross-classification, we constructed a similar but more traditional multilevel model in R using the “lme4” package (Bates et al., 2015). Two of the reported models were unable to converge in R but experienced no convergence issues in MLwiN. In Table A2, the fully disaggregated models are estimated using MCMC with cross-classification as reported in the results and the fully disaggregated models are also estimated using lme4. The model specified with lme4 returns remarkably similar results to MCMC estimation with cross-classification. The largest difference is seen in the year effect where the MCMC estimation method assigns higher values. Throughout the article, we report the MCMC method results of the full sample because MCMC takes into account the complex structure of the data. However, the objective of the analysis is to compare the partitioned variances and so the marginal difference between estimation techniques is largely unproblematic in interpreting the results.
Acknowledgements
We are grateful to our wonderful editor Carmen Weigelt and our anonymous reviewers for insightful suggestions that resulted in many improvements to our article. We also extend our appreciation to Dev Jennings, Mike Toffel, Julia Gergek, Nathan Barrymore, William Diebel, Kevin Chuah, Maggie Cascadden, and Farzaneh Sepehr for feedback on earlier drafts of this article. We are especially thankful to Caroline Flammer whose astute guidance pushed us to develop the relevance of our findings. Finally, we acknowledge the Alliance for Research on Corporate Sustainability, the Academy of Management, and the Alberta School of Business for providing platforms to share and enhance our work.
Declaration of Conflicting Interests
The author(s) declared no potential conflicts of interest with respect to the research, authorship, and/or publication of this article.
Funding
The author(s) received no financial support for the research, authorship, and/or publication of this article.