
Abstract
Cochlear Implant (CI) users typically perform poorly on musical tasks, especially those based on pitch ranking and melody recognition. It was hypothesized that CI users would demonstrate deterioration in performance for a pitch ranking and a melody recognition task presented with iterated rippled noise (IRN) in comparison to pure tones (PT). In Addition, it was hypothesized that normal hearing (NH) listeners would show fewer differences in performance between IRN and PT for these two tasks.
In this study, the ability of CI users and NH subjects to rank pitches and to identify melodies created with IRN and PT was assessed in free field in a sound-isolated room. CI subjects scored significantly above chance level with PT stimuli in both tasks. With IRN stimuli their performance was around chance level. NH subjects scored significantly above chance level in both tasks and with all stimuli. NH subjects performed significantly better than CI subjects in both tasks. These results illustrate the difficulties of CI subjects to rank pitches and to identify melodies.
Introduction
Cochlear implant (CI) users often have difficulties with music perception (Nimmons et al., 2008), despite relative overall success with speech perception. These difficulties in music perception are largely attributable to poor perception of pitch, the psychoacoustic correlate of stimulus frequency. In the human auditory system, pitch can be processed in two ways. In the cochlea, the basilar membrane acts as a frequency analyzer and activates the hair cells and auditory nerve fibers that are specifically tuned to the frequency of the incoming pitch and located spatially along the tonotopic gradient of the cochlea. This type of processing is referred to as “place pitch” (Goldstein, 1973; Terhardt, 1974; Wightman, 1973), and is presumably critical for processing of a pure tone (PT). It has also been shown that the firing of auditory nerve fibers can “phase lock” to the frequency of the incoming pitch signal up to around 5,000 Hz (Rose, Brugge, Anderson, & Hind, 1967), and pitch information can be encoded by the rate of auditory nerve firing. This is referred to as “rate pitch” (McKay, McDermott, & Clark, 1994; Pijl & Schwarz, 1995). It is controversial whether pitch is processed primarily using place or rate pitch because the place and temporal codes usually covary with stimulus frequency in acoustic hearing (Chatterjee & Zwislocki, 1997; Moller, 1999; Zeng, 2002).
Iterated rippled noise (IRN) is created by a cascade of add and delay cycles (Yost, 1996). The pitch of the IRN is shown by performing an autocorrelation with the signal (Figure 1A). The delay of the first peak of the autocorrelation that is not at delay zero (highlighted) is the reciprocal of the pitch frequency. The strength of the pitch is determined by the relative height of this highlighted peak (Yost, Patterson, & Sheft, 1996) and it increases with stimulus duration (Yost, 2009).

Figure 1A shows the autocorrelation and the spectrogram of a 523.25 Hz iterated rippled noise (IRN) stimulus. The pitch of the IRN is indicated by the location of the first peak of the autocorrelation next to lag zero. It occurs at lag 1.91 ms. The reciprocal of the lag is the pitch frequency. Figure 1B shows the spectrogram of the same stimulus. The IRN has linear spacing of the spectral peaks in the frequency domain.
The spectrogram of IRN has equal amplitude peaks at integer multiples of the fundamental frequency of the pitch (Figure 1B). The spectrogram of PT sinusoids has peaks at the fundamental frequency of the pitch only. NH listeners can discriminate between two IRN stimuli up to around 5 kHz (Yost, Patterson, & Sheft, 1998). Most current CI speech processing strategies only process the envelope of the input signal, whereas temporal fine structure is the basis for IRN pitch processing (Yost et al., 1998). Although there has been considerable data published on spectral ripple discrimination with CI users, there has been no publication using IRN. This differs from spectral ripple discrimination in that IRN has a distinctive temporal property that is absent in the spectral ripple stimuli used in previous studies (Henry, Turner, & Behrens, 2005; Litvak, Spahr, Saoji, & Fridman, 2007; Won, Jones, Drennan, Jameyson, & Rubinstein, 2011).
In this study, IRN and PT were used to investigate the differences in place and rate pitch perception for CI and NH users in a pitch ranking and a melody recognition task. It was hypothesized that CI subjects would demonstrate deterioration in performance for pitch ranking and melody recognition with IRN compared to PT. It was further hypothesized that normal hearing (NH) users would perform better than CI users and would show fewer differences in performance between IRN and PT in the two tasks.
Method
Ten NH subjects and 10 CI subjects participated in the study. The age range was 36 to 75 years (mean = 53, SD = 11). The biographical information of all CI subjects in this study is shown in Table 1. All persons enrolled were native English speakers. This research was approved by the Institutional Review Board of the Johns Hopkins University School of Medicine. Written consent was obtained from each participant. Each participant underwent pitch ranking and melody recognition tasks as described below.
Subject Demographics.

Stimulus Generation
IRN was generated by delaying and adding white noise to itself. The IRN tones were created with eight iterations and with gain of one (see Figure 2). The output waveform of one delay and add stage served as the input to the next stage (“add original” configuration) and for noise-delays (d) between 2 and 30 ms, IRN stimuli have a pitch corresponding to 1/d kHz (Yost, 1996).
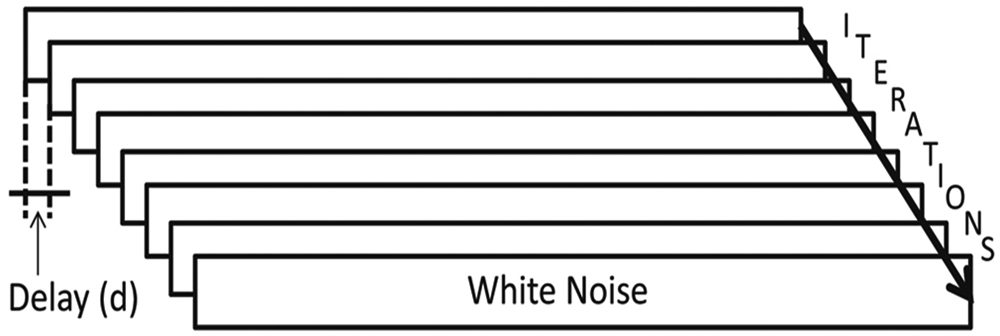
The process of making iterated rippled noise (IRN). IRN was generated by delaying white noise by a certain amount of ms and adding it to itself. The perceived pitch was 1/delay. This process was repeated eight times (eight iterations).
All pitches (IRN and PT) were generated using Audacity 1.2.5 (Dominic Mazzoni, open source) at a sampling rate of 44.1 kHz. The IRNs were then filtered using fourth-order Butterworth filters between 150 Hz and 4.5 kHz to minimize any spectral cues. Stimuli were randomly presented in a soundproof booth through a single calibrated loudspeaker (Sony SS-MB150H) at a presentation level of 75 dB sound pressure level through an OB822 clinical audiometer (Madsen Electronics). The speaker was positioned directly in front of the listener. For CI subjects, the contralateral ear (which was profoundly impaired in all individuals) was occluded with an earplug to diminish the effects of any minimal residual hearing, and no hearing aids were used. Each pitch was constructed such that an eighth note was exactly 250 ms in duration. They were presented at a tempo of 120 beats per minute. Each note was given linear rise/decay ramps of 50 ms to reduce onset clicks and to minimize transients in the filter bank outputs.
Pitch Ranking
The pitch ranking task was implemented using a two-interval, two-alternative, forced-choice (2I2AFC) test. On each presentation, two pitches were played sequentially. The listener was asked to identify which of the two pitches was higher in frequency. The minimum tested interval was one semitone, and the maximum was 12 semitones. The pitch pairs used consisted of semitone steps within an octave ranging from 261.63Hz to 523.25 Hz. Each interval was tested six times per subject using either PT or IRN in a randomized fashion. PT and IRN stimuli were run in intermixed blocks with randomized intervals.
Melody Recognition
In this test, the listeners were asked to identify the recordings of 12 common melodies from a closed set. Individual pitches were combined to create isochronous, eighth notes melodies in order to reduce potential rhythm cues that might be used for melody identification. The accumulated semitone range (ASR) of all notes of each melody was calculated. ASR ranged from 26 to 73 semitones. The following melodies were selected for their general familiarity. In parenthesis is the corresponding ASR. “Auld Lang Syne” (47), “Deck the Halls” (53), “Frère Jaques” (58), “Frosty the Snow Man” (54), “London Bridges” (32), “Mary Had a Little Lamb” (26), “Ode of Joy” (26), “Somewhere Over the Rainbow” (73), the opening theme of “The Sound of Music” (29), “Swing Low Sweet Chariot” (51), “Twinkle, Twinkle Little Star” (30), and “Yankee Doodle” (46). All melodies were presented for 12 s to prevent the use of melody length as a cue. Prior to testing, all listeners were given a list of the 12 melodies and were asked to indicate their familiarity with each melody. Unfamiliar melodies were included in the test but were removed from the final analysis. Each melody was presented three times using PTs and IRNs in a randomized fashion. PT and IRN stimuli were run in intermixed blocks with randomized intervals.
Results
Results from both experiments were found to be not normally distributed. The Kolmogorov–Smirnov test was used to check the data distribution. Both of the experiments in this study used forced-choice procedures, therefore the results can be analyzed with the binomial probability distribution. A binomial experiment consists of repeated trials where the outcome of each trial is labeled either success or failure. The probability of success remains constant from trial to trial. In evaluating the result of a forced-choice experiment, the first question is whether the subjects were merely guessing. For the pitch ranking procedure it was considered that the null hypothesis of the probability of success on each trial was 50%. For the melody recognition task there were 12 melodies to select meaning that the probability of success in each trial was 8.33% (1/12). If the resulting probability (p) is less than the criterion value α = 0.05 that is generally accepted for statistical significance. It was then concluded that it was unlikely that the null hypothesis is true, that is the subjects were most likely using some cue in the stimuli to obtain a good score. The second question is whether the subjects performed better with IRN or PT stimuli. Simon (1997) advocated the unorthodox approach of simulating the experiment on a computer, sometimes known as the Monte Carlo method (Simon, 1997). It is based on pseudorandom numbers with a binomial distribution. In the present study 100,000 runs were stimulated in the Monte Carlo simulation to check if the subjects performed better in one of the two condition (IRN or PT).
Pitch Ranking
Averaged across all pitches, NH users scored 89.58% ± 6.28% correct (mean ± SD) for the IRN stimuli. For the PT stimuli they scored 93.19% ± 5.55% correct. Performance with both listening conditions was significantly above chance level (both p = 0.00 (p_PT = 6.16e-141 and p_IRN = 3.03e-114)). Figure 3A shows details about the performance of NH subjects.

Performance of both listeners in the pitch ranking task. The error bars represent the 95% confidence interval of the mean. The dotted lines that are at 50% in both graphs show chance performance level. Linear regression was used on both graphs to fit a line to show the increase in performance with increasing semitone distance.
CI subjects scored on average 57.08% ± 7.76% for the IRN stimuli and 80.00% ± 11.90% for the PT stimuli. Performance was not significantly above chance level for IRN stimuli (p = .31) but significantly above chance level for PT stimuli (p < .01). Figure 3B shows details about the performance of the CI subjects.
For NH subjects no significant difference in performance was observed between both listening conditions (p = .31). CI subjects performed significantly better with PTs compared to IRN stimuli (p < .01). The performance of the NH subjects was significantly better than the performance of the CI subjects in both listening conditions (p < .01).
Linear regression was used to fit a line to the results using the equation y(t) = k × t + d. The factor “k” is the inclination and the summand “d” is the offset of the fitted line. The inclination “k” helps to determine if there is a performance increase with increasing semitone distance. Inclination and offset lie with a probability of 95% within their corresponding interval range. For NH subjects inclination and offset (each ± intervals) are [kNH PT = 1.3% ± 0.6% and dNH PT = 84.8% ± 4.9%] for the PT stimuli and [kNH IRN = 1.7% ± 0.5% and dNH IRN = 78.9% ± 3.9%] for the IRN stimuli. Both inclinations are positive meaning that the performance increased on average 1.3% per semitone for the PT and with 1.7% per semitone for the IRN stimuli (Figure 3A). For CI subjects, performance of pitch ranking also increased as semitone distance increased. Inclination and offset were [kCI IRN = 2.0% ± 0.7% and dCI IRN = 44.0% ± 5.3] for IRN stimuli and [kCI PT = 3.0% ± 1.1% and dCI PT = 60.2% ± 8.4%] for the PT stimuli. Both inclinations are positive, meaning that performance increased on average with 2.0% per semitone for the IRN and with 3.0% per semitone for the PT stimuli (Figure 3B).
NH listeners perform equally well regardless of listening condition. This is due to a ceiling effect in the results. CI users perform significantly better with PT stimuli.
Melody Recognition
Averaged across all melodies, NH users scored 87.78% ± 11.00% correct for the IRN stimuli. For the PT stimuli NH subject scored 92.50% ± 8.29% correct. Performance for both listening conditions was significantly above chance level (p < .01).
CI subjects scored on average 15.56% ± 4.78% for the IRN stimuli and 19.17% ± 7.47% for the PT stimuli. Performance was not significantly above chance level for the IRN (p = .09) but only just significantly above chance level for the PT stimuli (p = .03).
No significant difference in performance between both listening conditions was observed for NH subjects (p = .26). The performance of the NH subjects was significantly better than the performance of the CI subjects in both listening conditions (p < .01). Figure 4 shows the performance in the melody recognition task for both groups of listeners. Linear regression was used again to test if increasing accumulated semitone range (ASR) improves performance. For NH subjects, inclinations of the performance graph for IRN and PT were kNH IRN = 0.19% ± 0.36% and kNH PT = 0.08% ± 0.30%. The corresponding offsets were dNH IRN = 80.3% ± 15.3% and dNH PT = 89.4% ± 12.21%. For CI subjects, IRN stimuli inclination and offset were kCI IRN = 0% ± 0.16% and dCI IRN = 16.6% ± 7.1%. For the PT stimuli, inclination was kCI PT = 0% ± 0.26% and offset was dCI PT = 18.9% ± 11.2%. For NH subjects, performance increased with 0.19% per ASRs for the IRN and with 0.08% per ASRs for the PT. For CI subjects inclinations averaged around 0% per ASR for both conditions.

Performance both listeners in the melody recognition task. The error bars represent the 95% of confidence intervals. The dotted lines that are at 8.3% in both graphs show chance performance level.
Discussion
NH subjects showed no difference in performance between IRN and PT stimuli in the pitch ranking and in the melody recognition task. The reason could be a ceiling effect in both tasks that might have washed out the differences in performance. It could however be that pitch ranking and melody discrimination performance for IRN and PT is the same for NH subjects. Further studies would be needed to investigate this.
CI subjects performed significantly above chance level with the PT stimuli in the pitch ranking and the melody recognition task. With IRN stimuli performance was around chance level in both tasks. For both listening conditions and tasks, the NH subjects performed significantly better than the CI users. Pitch perception for PT and IRN differs from one another in several ways that are particularly relevant for CI mediated listening.
TFS and Envelope
Speech is a temporally complex signal, containing both slow amplitude modulations of the temporal envelope and fast frequency oscillations of the temporal fine structure (TFS) within each frequency band (Fogerty & Humes, 2012). The envelope information that is transmitted primarily by most current CI processing strategies is sufficient for understanding speech in quiet conditions (Wilson et al., 1991; Wilson, Lawson, Zerbi, Finley, & Wolford, 1995). TFS also plays an important role in pitch and speech perception and it enhances pitch and sound quality. Behavioral studies in humans show that sensorineural hearing loss (SNHL) decreases sensitivity to TFS of sound (Lorenzi, Debruille, Garnier, Fleuriot, & Moore, 2009; Lorenzi, Gilbert, Carn, Garnier, & Moore, 2006; Moore, Glasberg, & Hopkins, 2006). Henry and Heinz found that SNHL reduces the strength of temporal coding in noise at the most peripheral level of auditory processing (Henry & Heinz, 2012). TSF is not transmitted well by any CI system. Attempts to deliver TFS information have been made in some current sound processing strategies (Hochmair et al., 2006; Laneau, Wouters, & Moonen, 2006).
Amplitude Modulation Detection Problem Due to Signal Processing
In the process of vocoding, the stimuli is filtered and TFS is effectively tossed out and replaced with a constant rate pulse train in each channel. TFS can be expressed by frequency modulation and as the frequency modulations move in and out of the CI filters the process created amplitude modulations. TFS cues may also be perceived as a within-channel pitch cue if a broadband, flat envelope stimulus is supplied as input for the speech processor (Gilbert & Lorenzi, 2006; Imennov, Won, Drennan, Jameyson, & Rubinstein, 2013). Modulations can also occur as a response to a complex tone: If more than one harmonic falls within the bandwidth of a filter, the envelope modulation frequency will be the fundamental frequency of the input sound (Swanson, 2008). No matter how the TFS cues are created, the CI subjects seem to have a temporal pitch limit around 300 Hz (Zeng, 2002). The maximum rate per channel is, for example, 900 Hz for implants from Cochlear Ltd. and it could serve as a carrier of the amplitude modulation frequency. There is a factor of around 3 to 4 between the highest modulation frequency and the carrier rate (McKay et al., 1994). Due to this low-carrier rate the maximum modulation frequency is around 300 Hz, which is lower than most pitches that were used in the present study.
Amplitude Modulation Detection Problem Due to Background Noise
The periodic peaks in the time domain of an IRN signal are accompanied by the presence of a high background noise. This background noise overlaps with the signal and decreases the modulation depth of the periodic peaks. It severely impedes CI users because they generally have a small dynamic range (DR). Normal acoustic hearing can process sounds over a range of 120 dB, and instantaneous amplitudes in normal speech cover a 30 to 60 dB range (Boothroyd, Erickson, & Medwetsky, 1994). Implant listeners typically have DRs of only 6 to 15 dB in electric current, requiring the larger acoustic range to be compressed into the smaller electrical range (Fu & Shannon, 1999). This DR compression might be another explanation for the poor performance of CI subjects in ranking IRN stimuli. While certain stimulus manipulations such as increasing the duration of the stimulus may strengthen the pitch percept induced by IRN (Yost, 2009), the present study found that NH controls could rank IRN pitches with only 250 ms duration well. CI users demonstrated great difficulty in these tasks. DR, along with other factors, was also found to significantly affect spectral-ripple discrimination for CI users (Won, Jones, Drennan, Jameyson, & Rubinstein, 2011Reducing DR also lowers phoneme recognition significantly, particularly in noise and for vowels (Zeng & Galvin, 1999).
Comparison Spectral Ripples and IRN
Won, Drennan, & Rubinstein (2007) performed a study with spectral-ripple discrimination for CI users. Their spectral ripples were logarithmically spaced in the frequency domain with an amplitude envelope determined by a sinusoid in a decibel scale. They found that spectral-ripple resolution correlates with speech reception in noise for CI users and could serve as a tool to evaluate CI performance with different speech processing strategies. In another study Won, Drennan, Nie, Jameyson, & Rubinstein (2011) found that temporal modulation detection measured with the sound processor can serve as a useful measure of the ability of clinical sound processing strategies to deliver clinically pertinent temporal information). Without TFS present, IRN and spectral ripples might look much more alike in their spectral properties. CI subjects have great difficulty with TFS perception therefore results should be similar for both stimulations. As noted in the introduction (Figure 1), IRN have linear spacing of the peaks in the frequency spectrum whereas summed sinusoid spectral ripples are usually done with logarithmical spacing of the peaks in the frequency spectrum(Won et al., 2007). The reason for using logarithmic ripples is that logarithmic amplitude is closer to the perceptual scale of loudness. Others, however do use ripples with a sinusoidal shape on a linear amplitude axis (Henry et al., 2005).
TFS Discrimination of the Hearing Impaired
Several studies have been conducted to analyze TFS discrimination for hearing impaired subject groups. Drennan, Won, Dasika, & Rubinstein (2007) investigated the effect of randomized TFS presented with vocoded speech on NH subjects. They found that improved delivery of TFS improves speech understanding in noise for implant recipients and that bilateral implant recipients might benefit from temporal envelope interaural time differences. Henry et al. (2005) found a relationship between the spectral-ripple threshold and vowel and consonant recognition in quiet in NH, hearing impaired and CI subjects. More recently, Imennov et al. (2013) investigated the perception of acoustic TFS with single channel and multiple channel strategies. Although both strategies were capable of delivering acoustic TFS cues, a single channel analog signal performed better under challenging discrimination condition. Without TFS cues the spectral properties of IRN and spectral ripples look very similar. Therefore improving transmission of IRN stimuli could as well be beneficial for speech understanding in noise.
Place Pitch
An illustration of the difference in processing between IRN and PT-pitch is provided by plotting the output current on each electrode of a CI speech processor over time. The tones in this example were processed by the ACE strategy and at pulse rate of 500 pps per channel, implemented in Nucleus MATLAB Toolbox (NMT) from Cochlear Ltd. Both electrodograms in Figure 5 show the output current of two proceeding tones with 250 ms in duration (separated by a 250 ms pause). For PT frequency 261.63 Hz, the majority of the current is on electrode 21 and 22, the most apical electrodes. A little bit of current is also applied to electrode 20. For PT frequency 523.25 Hz the peak of the stimulation current is shifted toward electrodes 19-21 with a bit of current on electrodes 18 and 22 (Figure 5A). The higher the pitch, the more the stimulation current shifts toward the middle of the cochlea. The lower the fundamental frequency, the more apical are the groups of electrodes that get stimulated. In this example the semitone distance between the two tones is 12 (one octave). These two tones had the maximum semitone distance played in the pitch ranking experiment. It best illustrates the difference in processing in the electrodogram for two tones. A certain distance in fundamental frequencies is required to activate different channels. Therefore, greater semitone distance leads to better performance in CI users. The good pitch ranking and melody recognition results with PT seem to be based mainly on a place pitch cue.

Figure 5 shows the change of current level over time on each electrode processed with Advanced Combination Encoders, or ACE, in a speech processor by Cochlear Ltd. (Cochlear Corp., Sydney, Australia). The output of two sequential tones with 261.63 and 523.25 Hz. PT (left), IRN (right) for the ACE processing scheme in a Nucleus implant is plotted. Each tone in the pair has a length of 250ms with linear rise/decay ramps of 50ms and they are interrupted by a silence pause with 250ms length.
IRN stimuli lead to stimulation of all active electrodes of the CI. Just by looking at the electrodogram in Figure 5B it is hard to tell which of the two tones is higher in pitch. Any place pitch cue is eliminated completely. The sound files that served as input for these two stimuli were directly forwarded to NMT with 100% input–output dynamic range. This eliminates any potential background noise that could appear in the free field sound-isolated room and gives the best possible output of the sound processor.
These findings suggest that several factors account for the bad performance of CI subjects with IRN stimuli: (a) The lack of accurate TFS, (b) the background noise which obscures the dips in the amplitude modulations, and (c) the lack of a place pitch cue in the IRN stimuli. The lack of place pitch is probably the most important difference between the processing of IRN and PT stimuli for CI subjects. Although pitch ranking performance increases with increasing semitone distance, there was no effect of increasing ASD on performance for CI subjects. CI subjects are able to rank IRN pitch significantly above chance level, but melody recognition makes the task too complex for them. For NH users, there is still a small increase in performance with increasing ASR for the PT and almost no effect for the IRN stimuli. Improving the processing for IRN stimuli could not only help to improve music perception, it could also help to improve speech perception in noise.
Conclusion
CI subjects are able to rank pitch and to identify melodies only with PT. IRN pitches and IRN melodies are impossible to be ranked or identified by CI subjects mainly due to the lack of a place pitch cue. Furthermore, the input is smeared with a high background noise. The limited DR and the lack of accurate TFS seems to impede CI users further in filtering out the high background noise of the IRN stimuli. CI users are severely impaired compared to NH subjects in perceiving IRN pitches and melodies. Improving the processing of IRN stimuli could not only help to improve music perception—which was the primary goal of the present study—it could also to improve language perception in noisy environments.
Footnotes
Acknowledgements
The authors would like to thank all participants of the study.
Declaration of Conflicting Interests
The authors declared no potential conflicts of interest with respect to the research, authorship, and/or publication of this article.
Funding
The authors disclosed receipt of the following financial support for the research, authorship, and/or publication of this article: The research leading to these results has received funding from the European Community’s Seventh Framework Program under the EBRAMUS project-grant agreement number 238157.
References
Supplementary Material
Please find the following supplemental material available below.
For Open Access articles published under a Creative Commons License, all supplemental material carries the same license as the article it is associated with.
For non-Open Access articles published, all supplemental material carries a non-exclusive license, and permission requests for re-use of supplemental material or any part of supplemental material shall be sent directly to the copyright owner as specified in the copyright notice associated with the article.