
Abstract
Hearing assistive technologies include listening, alerting, and/or signaling devices that use auditory, visual, and/or tactile modalities to augment communication and/or facilitate awareness of environmental sounds. The importance of hearing assistive technologies in the management of adults with hearing loss was recently acknowledged in an evidence-based clinical practice guideline developed by the American Academy of Audiology. Most currently available evidence for hearing assistive technology use by adults focuses on frequency-modulated (FM) technology. Previous research is reviewed that demonstrates the efficacy of FM devices for adults in terms of laboratory measures of speech understanding in noise. Also reviewed are the outcomes from field trials of FM use by community-dwelling adults, which, to date, have been disappointing. Few to no individuals, in previous studies, elected to use FM devices at the end of the trial periods. Data are presented from a 1-group pretest-posttest study examining the role of extensive counseling, coaching, and instruction on FM use by adults. In addition, the potential influence of the cost of devices to the individual was eliminated by conducting the study with veterans who were eligible to receive FM systems through the Veterans Affairs National Hearing Aid Program. Positive outcomes were obtained at the end of a 6-week trial period and were found to remain 1 year after study completion. Implications for increasing the evidence base for the use of FM devices by adults are discussed.
Recently, the American Academy of Audiology (AAA) developed an evidence-based clinical practice guideline to address the audiological management of individuals with adult-onset hearing loss. 1 Although the guideline focuses on the use of hearing aids as the primary treatment option for adults, consideration of the use of hearing assistive technology (HAT) was thought to be critical for successful intervention outcomes. Hearing assistive technologies include listening, alerting, and/or signaling devices. They may use auditory, visual, and/or tactile information to augment communication and/or facilitate awareness of environmental sounds. A HAT is selected for a particular individual based on his or her communication needs related to (1) face-to-face communication, (2) electronic media, (3) telephone use, and (4) environmental alerting needs. Although many types of assistive technologies are available for use by adults, the majority of studies used in developing the AAA guideline's recommendations regarding HAT focused on the use of FM technology.
In an FM system, the speaker's voice is picked up via a microphone located near the speaker's mouth. The acoustic signal is then converted to an electrical waveform, which is transmitted via an FM signal to a receiver worn by the listener. By acquiring the signal at or near the source, the negative effects of ambient noise, as well as those of distance and reverberation, are reduced, allowing the listener to receive a clearer speech signal. This benefit can be attributed to an FM system's ability to produce a favorable signal-to-noise ratio (SNR), ranging from 15 to 25 dB.2,3
Initial Study of FM Efficacy
The efficacy of FM technology use by adults, in terms of laboratory measures of speech understanding in noise, was demonstrated in several previous studies. One of the first studies, reported by Jerger et al, 4 used a randomized crossover design to compare outcomes of conventional amplification and FM device use in a group of elderly persons, 100 of whom were previous hearing aid users and 80 of whom were new hearing aid users. Outcomes were obtained in an unaided baseline condition and in 3 treatment conditions for all participants: (1) hearing aid (HA) alone, (2) FM device alone, and (3) HA + FM combined. In addition, outcomes were measured for the new hearing aid users as a function of a “no-amplification” treatment condition. At baseline and after 6 weeks in each of the 3 treatment conditions, speech recognition performance in noise was measured using the Speech Perception in Noise (SPIN) test. 5 Percentage correct SPIN test scores for all aided conditions were statistically significantly better than unaided scores. For both experienced and new hearing aid users, the highest scores were obtained when the FM system was used, either alone or in combination with hearing aids. There was no difference, however, between scores obtained in the FM + HA and FM conditions.
In addition to measuring speech recognition in noise outcomes, Jerger and colleagues 4 administered several generic outcome measures and 1 disease-specific outcome measure, the Hearing Handicap Inventory for the Elderly (HHIE) 6 at the end of each 6-week trial period. During these trial periods, participants had been instructed to use the amplification configuration assigned (ie, HA, FM, HA + FM) as much as possible. Although no statistically significant differences were found for any of the generic outcome measures as a function of the use of amplification compared to the no-amplification conditions, the HHIE results indicated statistically significant benefit for all 3 of the amplification conditions (ie, HA, FM, and HA + FM). Although differences in HHIE scores between the 3 amplification conditions were not statistically significant, informal responses from both new and experienced hearing aid users indicated a preference for the sound quality of the FM system. Many individuals reported they preferred the FM system's sound quality because it improved their ability to understand a talker in the presence of background noise. Despite this preference for sound quality and the demonstration of better objective speech recognition in noise performance from the use of an FM system, an overwhelming majority of individuals, 175 of the 180 study participants, indicated they would chose to use conventional amplification alone in their daily lives. The researchers attributed the low rate of preference for FM use in daily life to difficulties associated with using the available devices. The devices consisted of relatively large transmitters and receivers, wired microphones, and ear-level transducers connected to receivers by a wire. The researchers suggested that the full benefits of FM technology would only be realized by adults if less awkward FM systems became available.
Recent Studies of FM Efficacy
In the past several years, personal FM systems have become available that do not use as many wires or the large box-like transmitters and receivers that were part of the system used in the study by Jerger and colleagues. 4 Some commercially available systems allow a user's behind-the-ear (BTE) hearing aid to be coupled directly to an FM system via an audio boot (eg, Phonak's Microlink), whereas other systems integrate the FM receiver into the hearing aid itself (eg, Phonic Ear's Free Ear). Three experimental studies examining outcomes with these newer, less cumbersome FM systems were recently reported in the literature.7,9,11
Phonak Microlink
Significant benefits of coupling the Phonak Microlink personal FM system to a hearing aid, in terms of improvements of speech recognition in noise relative to an unaided condition and aided conditions, with either omni- or directional microphones, were reported by Lewis and colleagues. 7 Using a randomized crossover design, the investigators measured the SNR needed for 50% correct speech recognition performance on the Hearing in Noise Test (HINT) 8 in 45 adults, with mild to severe hearing losses, recruited from 2 clinic sites. The age range of the participants was 24 to 84 years old from site 1 and 34 to 81 years old from site 2, with the median age at both sites equal to 73 years old. Although hearing aid experience was not specifically reported, one of the inclusion criteria for participants was that they be motivated to try amplification, suggesting that the participants may have been new hearing aid users. Performance was measured as a function of 5 listening conditions: (1) binaural unaided, (2) binaural aided in omnidirectional mode, (3) binaural aided in directional mode, (4) binaural aided with 1 aid in FM-only mode and the other aid in omnidirectional mode, and (5) binaural aided with both aids in FM-only mode. Although performance was statistically significantly better in all aided conditions as compared to the unaided condition, better results were obtained with the FM system than in either of the 2 hearing aid–only conditions. The use of an FM system in 1 ear resulted in improvements in the SNR relative to the omnidirectional hearing aids alone of 15.4 dB and 20.3 dB, dependent on the clinic site; relative to the directional hearing aids, SNR improvements of 14.2 dB and 16.9 dB were observed. Even greater benefits were obtained in the binaural FM condition, with reported SNR advantages relative to omnidirectional hearing aids of 18.1 dB and 22.7 dB, as well as relative to directional hearing aids of 16.9 dB and 19.3 dB, dependent on site. These results confirm that with currently available hearing aid and FM technology, adult listeners with hearing loss are likely to obtain the best speech recognition in noise performance, measured in laboratory conditions, with the use of a personal FM device.
In addition to assessing laboratory performance, Lewis and colleagues 9 compared the self-perceived benefits of hearing aid use alone and hearing aid plus FM use in a subset of participants (n = 23). Using a randomized, crossover design, with experimenter blinding, participants completed 3-month trial periods with binaural hearing aid use alone (HA) and binaural hearing aid plus FM device use (HA + FM). Self-perception of benefit was measured using the Communication Profile for the Hearing Impaired (CPHI). 10 The CPHI is a 145-item questionnaire yielding 22 subscales divided into 4 major areas: (1) Communication Performance, (2) Communication Environment, (3) Communication Strategies, and (4) Personal Adjustment. In addition, the CPHI provides 3 communication importance rating scores for home, work, and social situations. Although results for several of the subscales and communication importance ratings demonstrated significant benefit from the use of amplification (either HA or HA + FM), a significant difference between the 2 amplification conditions was only found for communication importance in work-related situations. In discussing this finding, Lewis et al 9 pointed out that it was not clear why this rating scale would show a significant difference between aided conditions. The researchers had not obtained information from participants about their work-related activities, and because the median age was 73 years old, a majority of the participants were likely to be retired. Because no other statistically significant differences were found, perhaps it is not surprising that none of the participants elected to purchase FM devices at the end of the experimental protocol, even though the devices were being offered at a significant discount (30%). The investigators pointed out that despite the cosmetic advantages of the newer personal FM devices relative to those used by Jerger and colleagues, 4 their study participants still reported several difficulties with the FM devices, including (1) expense, (2) inconvenience (eg, charging the transmitter each night), and (3) cosmetic issues (eg, need to point the transmitter near the mouth of the talker). Although the results of the study may be attributable to these factors, Lewis and colleagues 9 also pointed out that participants were given only minimum training in use of the FM devices, and more extensive training might result in improved outcomes. Finally, the investigators suggested outcomes also might be improved if a focus was placed on the use of the FM to address an adult's individual-specific problems.
Phonic Ear's Free Ear
In addition to the studies by Lewis and colleagues7,9 examining the use of the Phonak MicroLink FM system, Boothroyd 11 examined the use of Phonic Ear's Free Ear–integrated BTE/FM device by adults with hearing loss. Both laboratory measures of speech understanding and self-perceived “real-world” benefits of FM use in daily life during a 2-week trial period were assessed. Participants were 12 adults, aged 52 to 85 years old, with mild to severe hearing losses. Eleven of the 12 participants were experienced hearing aid users. Speech recognition performance was examined by generating performance versus intensity functions in quiet and noise. When comparisons were made between aided performance in quiet, aided performance in noise, and FM performance in noise, the poorest results were obtained for listening through hearing aids alone in noise. Statistically significantly better performance was found for both the aided quiet and the FM-in-noise conditions. An important finding was the demonstration that performance in the FM-in-noise condition was not statistically significantly different from performance in the aided quiet condition. Although these results demonstrate a laboratory advantage of FM systems for listening in noise, Boothroyd 11 pointed out that they also demonstrate that the benefits obtained will be no greater than the individual's optimal aided performance in quiet.
The lack of a difference between aided performance in quiet and FM performance in noise reported by Boothroyd 11 may account for some of the perceived benefits of FM use in daily life that were experienced by the study participants during the trial period. For example, half of the 12 participants reported the FM device was of “no help” when listening to 1 person in quiet at a close distance. This finding is logical given the laboratory results. All of the participants reported that the FM system was of “some” or “a lot” of help when listening to 1 person at a distance. Similarly, the majority of participants reported that the FM system was some or a lot of help in the following listening situations: (1) 1 person in noise at a distance, (2) 1 person in noise close, and (3) in the car. Although not all participants used the FM system while watching TV, listening to the radio, or in meetings (including church) or restaurants, in each situation, the majority of those that did, reported that the FM was some or a lot of help. When asked to rate perceived overall benefit, 7 of the 12 participants reported that the FM system was a lot of help, with the remaining 5 reporting that it was of some help. Despite these positive findings and the expression of several very positive comments about their experiences with FM use, none of the participants indicated interest in purchasing an FM system. Although Boothroyd 11 reported expecting that cost would influence enthusiasm for the FM systems, none of the participants asked about the price. Rather, Boothroyd 11 reported that the comments made by the participants in the final session demonstrated that the initial explanation, demonstration, and instruction (both verbal and written) for FM device use appeared inadequate for many of the participants to fully understand and optimally use the system. On the basis of these observations, Boothroyd11(p32) concluded that for FM systems to become widely accepted by adults with hearing loss, “considerable counseling, instruction and coaching, extended over several sessions” would be needed. Indeed, data obtained from studies conducted in long-term care facilities indicate that adults will be successful with FM use when training and support are provided.12,13
Summary of Previous Work
The studies4,7,9,11 reviewed provide strong evidence that the use of FM devices by adults with hearing loss results in better speech understanding in noise performance than does the use of hearing aids alone. Despite these positive findings, the results of field trials of FM use4,9,11 in community-dwelling adults have been disappointing. Results obtained with standardized outcome measures (eg, HHIE, CPHI) failed to demonstrate significantly greater benefit from the use of a hearing aid coupled to an FM device as compared to hearing aid use alone. Although Boothroyd11(p32) found that the results for many questions designed to assess self-perceived “real-world” benefit supported the use of FM devices, the “ultimate test of perceived benefit—the intent to acquire one—was failed.”
Purpose
The present study was designed to explore some of the postulated reasons for lack of use of FM devices by community-dwelling adults after the end of study trial periods. Specifically, a 1-group pretest-posttest design was used to explore real-world outcomes of FM use by experienced adult users of hearing aids who were provided with considerable counseling, instruction, and coaching regarding FM use throughout an extended 6-week trial period and for whom cost was not a factor, as all participants were veterans who were eligible to receive FM systems through the Veterans Affairs (VA) National Hearing Aid Program at no cost.
Methods
Participants
Prior to recruitment of veterans to participate in this study, 5 audiologists, including 3 researchers (TC, CN, and HA) who were experienced with fitting FM devices to adults, identified patient characteristics that their clinical experiences suggested would result in a person being a good candidate for an FM trial period. These characteristics determined participant inclusion criteria and were as follows: (1) at least a moderate, adult-onset hearing loss with no evidence of retrocochlear pathology, (2) dissatisfaction with current hearing aids in at least 1 listening environment in which an FM system would be beneficial, (3) current user of BTE hearing aids or an expressed willingness to use BTE hearing aids, and (4) no known neurological, psychiatric, or comorbid diseases that might preclude successful FM use. In addition, participants needed to exhibit appropriate reading and cognitive skills to be able to participate in the study, as determined through informal clinical assessment.
Participant recruitment procedures, as well as all procedures used in this study, were approved by the local institutional review boards at the VA facilities in Bay Pines, Florida, and Mountain Home, Tennessee. To identify potential participants, the records of community-dwelling veterans who were dispensed hearing aids within the past 5 years were reviewed. If record review indicated that a veteran met the first and fourth inclusion criteria, a research assistant contacted the person by telephone. The research assistant explained to the veteran that he was being contacted to determine if he would be willing to participate in a research project examining the benefits of devices that might help veterans make better use of their hearing aids. Several questions were then posed about the person's current health state and satisfaction with hearing aids in a variety of listening situations where an FM system was likely to be helpful (eg, conversations in noise, watching television, riding in the car, etc). As soon as a participant indicated that he was dissatisfied with hearing aids in any one listening situation, he was asked if he would be willing to participate in a study that could involve up to 5 trips to the clinic over a 2-month period of time. Potential participants were contacted over a 4-month period of time, from May to August 2003.
Initially, 44 participants were enrolled in the study from the 2 sites. Eight participants withdrew from the study, however, leaving 36 participants who completed the protocol. Four participants, who entered the study using in-the-ear hearing aids, were never fit with the FM system. Recall that participants needed to use or be willing to use BTE hearing aids. When 2 of these 4 participants were fit with BTE hearing aids with directional microphones and were given a 4-week trial period, they no longer indicated a lack of satisfaction with hearing aid use. Despite verbally agreeing to the use of BTE devices during telephone contact, 2 potential participants rejected the use of BTE instruments when they were shown the devices. Three individuals were fit with FM systems but withdrew from the protocol during the trial period because of health and family problems, and 1 veteran simply said he did not like the FM system and returned the system after the first week.
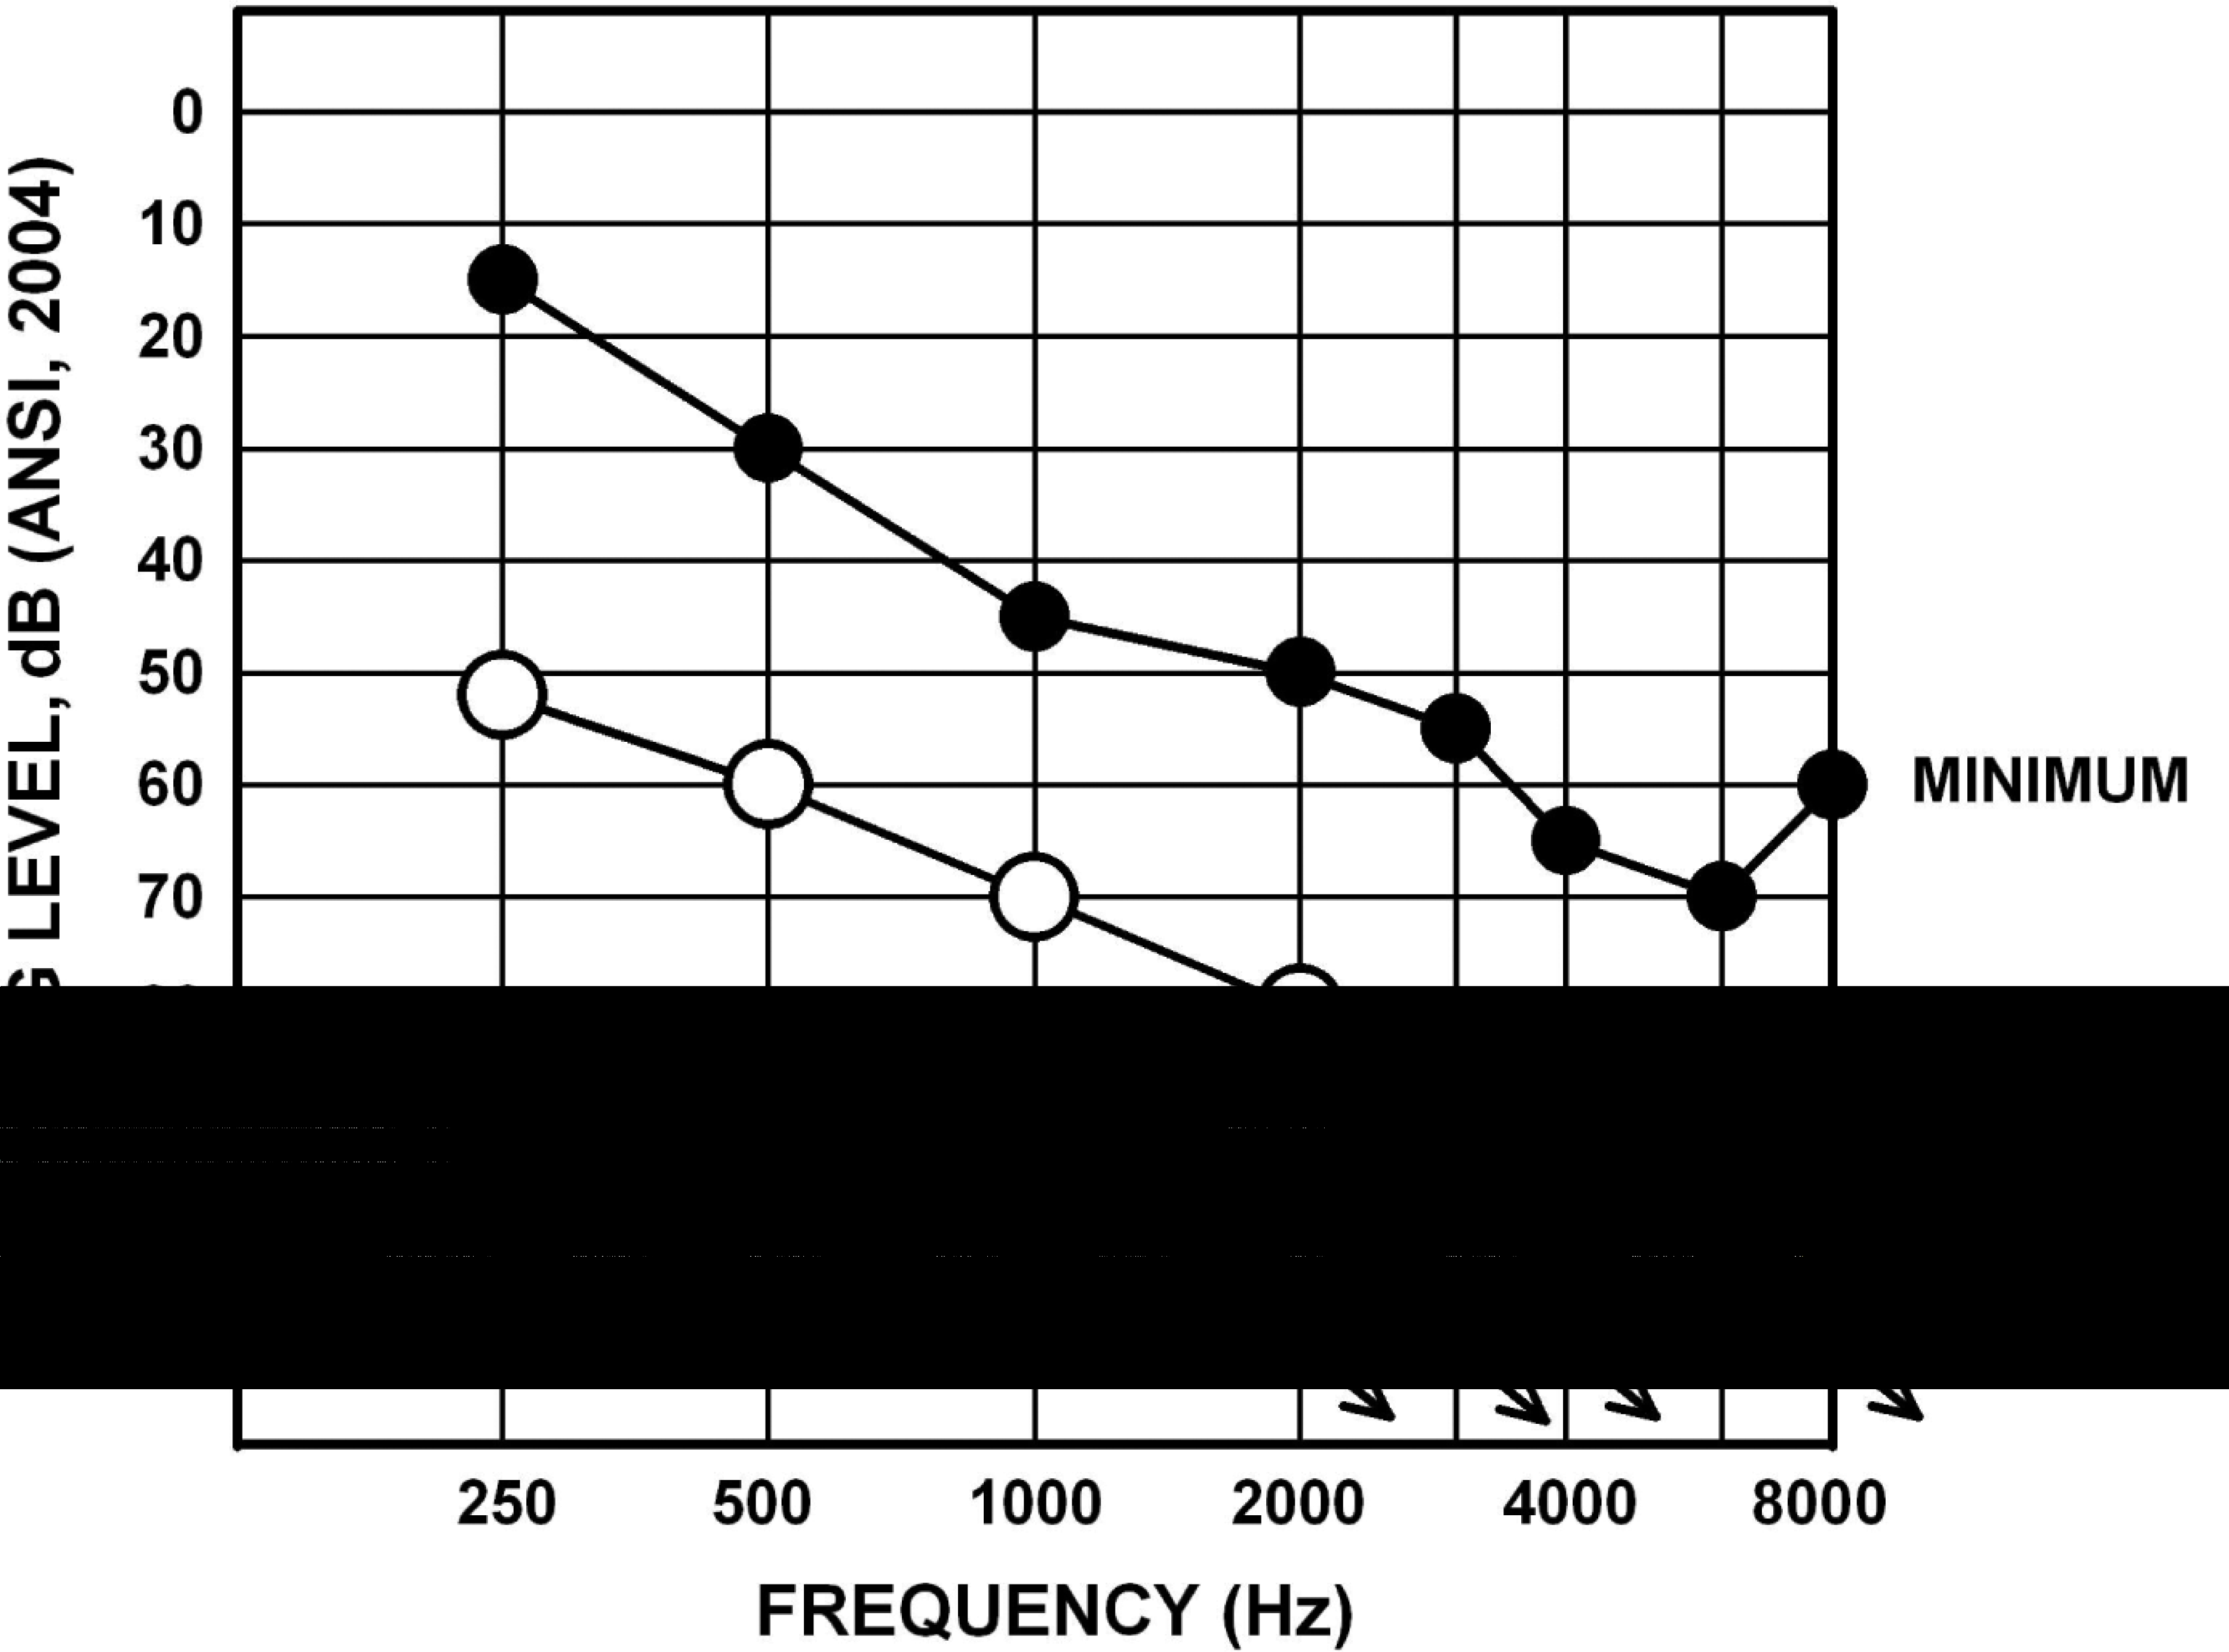
The 36 participants who completed the study protocol were all male and ranged in age from 58 to 85 years old with a mean age of 75 years old. The mean 3-frequency pure tone averages (PTAs; 500, 1000, and 2000 Hz) were 69.7 dB HL (SD, 13.2) and 70.8 dB HL (SD, 11.1) for the right and left ears, respectively. Figure 1 displays the average audiogram (open circles) as well as the minimum and maximum hearing threshold levels for the 36 subjects. Because related-measures t tests revealed no statistically significant differences for the thresholds at any frequency between ears, only the mean data collapsed across ears are displayed.

Mean audiogram and lower and upper ranges of hearing thresholds, collapsed across ears, for the 36 study participants.
At the end of the study protocol, participants were given the option of continuing to use the FM systems. All 36 participants elected to do so. Of these 36, 30 were found to be using FM devices 12 to 18 months after the end of the study protocol. (For simplicity, these long-term data are referred to as being obtained at “1 year.”) For the other 6 participants, 2 had returned the FM system, 1 received a cochlear implant, and 3 did not respond when an attempt was made to contact them by both telephone and mail. The age range for the subgroup of n = 30 participants was somewhat more restricted than that of the larger group, equaling 68 to 80 years old. The mean age was 79 years old. The mean PTAs and standard deviations for n = 30 participants were very similar to those obtained for all participants (n = 36), equaling 69.7 dB HL (SD, 13.6) in the right ear and 69.5 dB HL (SD, 11.0) in the left ear.
Hearing Aids and FM Systems
Hearing aids used during the study included both analog (ie, Phonak Piconet 2P3, Phonak Sonoforte 2P2, Phonak PowerZoom, Oticon Personic Oticon 380P) and digital (ie, Phonak Claro 311, Unitron Unison 2) behind-the-ear instruments fit binaurally. In addition, all participants were fitted bilaterally with the Phonak Microlink FM system. The transmitters used included the following: (1) the TX2 MicroVox transmitter, which is worn on the body and uses a lavaliere microphone; (2) the TX3 HandyMic transmitter, which uses multimicrophone technology, allowing for omnidirectional, directional, or super-directional input into the transmitter; and (3) the TX4 Telcom device, which is a stationary FM transmitter that allows optimized television, telephone, and audio system usage. Based on the communication needs expressed by the participant, 1 transmitter or a combination of transmitters was used. Participants were fitted bilaterally with 1 of 2 types of receivers, the Phonak MLx or the Phonak ML8, as determined by the make and model of the hearing aids being used.
The FM system fittings were verified using real ear insertion gain measures. First, the hearing aid response was compared to the NAL-R insertion gain target. 14 Because the participants were experienced hearing aid users, some variations from target were seen due to patient preference. Next, the FM transmitter was placed 15 cm from the speaker, and the hearing aid and FM receivers were set to the FM-only mode. A 65-dB sound pressure level (SPL) composite signal was presented, and the real ear insertion gain (REIG) was compared to the REIG of the hearing aid. The purpose of the verification was to ensure that the FM system was providing a smooth and appropriate frequency response when coupled to the hearing aid. In addition, by placing the FM receiver 15 cm from the speaker, the 65-dB SPL composite signal reached the receiver at a higher input level of approximately 80 dB SPL. As recommended by the American Speech-Language-Hearing Association (ASHA) Ad Hoc Committee on FM Systems, 15 the gain of the FM system was then adjusted so that the higher input into the FM receiver resulted in a REIG approximately 10 dB higher than that of the hearing aid REIG. The Frye 6500 and MedRex Otowizard real ear insertion measure instruments were used to verify the response of the FM systems.
Outcome Measures
Outcomes were measured using the Communication Performance subscales from the CPHI 10 and selected items from the MarkeTrak survey instrument. 16 These measures were administered in a paper-and-pencil format, and order of administration was counterbalanced across participants and 2 study visits, 1 at the beginning of the FM trial period and the other at the end of the FM trial period. In addition, individualized goals for FM use and the outcomes for individualized goals were obtained using the Client Oriented Scale of Improvement (COSI). 17
As noted earlier, the CPHI is a 145-item questionnaire assessing self-perception of communication performance, communication importance, communication environment, communication strategies, and personal adjustment. For the purposes of the present study, participants were asked to respond to the 18 items related to self-perception of communication performance. These items provide 5 subscale scores, 3 of which assess communication effectiveness in different types of situations (social, work, and home), with the other 2 assessing communication effectiveness as a function of type of listening condition (average and adverse). Scores are reported on a scale of 1 to 5, with higher scores indicating better performance.
The MarkeTrak survey has been used in the hearing aid industry since 1989 to assess customer satisfaction and needs. For the present study, only survey items that appeared relevant to FM systems, as well as hearing aids, were administered to participants. Selected items assessed overall satisfaction; overall quality of life; negative feelings of embarrassment, ridicule, or rejection resulting from device use; satisfaction with device use in a variety of listening situations; and satisfaction with device characteristics.
As noted, the COSI was used to develop individualized goals for FM use. Briefly, in the COSI procedure, patients can nominate up to 5 listening situations they would like to improve with amplification. The resultant goals can be classified into 1 of 16 categories for comparison across groups of patients. These categories are as follows: conversation with 1 or 2 persons in quiet, conversation with 1 or 2 persons in noise, conversation with a group of people in quiet, conversation with a group of people in noise, listening to the television and/or radio at a normal volume, talking to a familiar speaker on the telephone, talking to an unfamiliar speaker on the telephone, hearing the telephone ring from another room, hearing the front doorbell or a knock on the door, hearing traffic, increased social contact, feeling embarrassed or stupid, feeling left out, feeling upset or angry, listening at a church or meeting, and other situations. 17 For the purposes of the present study, participants were asked to nominate from 1 to 3 situations for which their current hearing aids were not effective in improving communication. In addition, participants were asked to prioritize the goals from most (1) to least (3) important. After 6 weeks of FM system use, patients were asked to note their degree of change from use of hearing aids alone as “worse,” “no change,” “slightly better,” “better,” or “much better.”
Procedures
The study protocol consisted of 5 visits. Participants were encouraged to bring a significant communication partner to all study visits if possible. Twenty-five of the 36 participants were accompanied by a significant other.
Visit 1
During the initial visit, which was 90 minutes in length, a consent form was reviewed and signed by the potential participant. Once consent was obtained, the participant and clinician established a minimum of 1 to a maximum of 3 communication goals using the COSI. The goals were established as listening situations where the participants indicated that their hearing aids were not providing adequate benefit. The hearing aids worn by each participant were examined and, if determined to be incompatible with the FM system, a new set of BTE hearing aids was ordered. If new hearing aids were ordered, the patient was given a 30-day trial period to address any possible acclimatization effects prior to determining whether the veteran was still experiencing difficulty in listening situations where an FM system could be helpful.
Based on the established goals and the type of hearing aids worn by the participant, the appropriate MicroLink FM system was ordered. A TX4 Telcom device was also ordered for individuals experiencing difficulty communicating effectively on the telephone. For all participants except those who were being fit with new hearing aids, baseline measures were obtained for CPHI Communication Performance items and the selected MarkeTrak survey items. For those individuals who were fitted with new BTE hearing aids, participation in the protocol, including administration of baseline outcomes, was postponed until after a 30-day period of hearing aid use.
Visit 2
The second study visit, which lasted 60 to 75 minutes, was scheduled 1 week after the initial visit or at the end of the 30-day trial period for veterans fit with new BTE hearing aids. For this latter group, baseline outcomes data were obtained at the beginning of the second study visit. All participants were fit with FM system receivers and at least 1 remote microphone. Verification of the FM response was obtained using REIG measures as previously discussed. After the FM system was fit, the participant was given detailed instructions regarding the proper care and use of the FM system components. These instructions were accompanied by a hands-on demonstration and a packet of written instructions. The participant's first goal for FM use was then addressed. To demonstrate how to use the FM system to achieve the goal, the clinician would role-play scenarios with the veteran and, if a significant communication partner attended the session, he or she also participated in the role-playing scenarios. Specific written instructions and reminders for how to position the microphone, which settings to use with the TX3 HandyMic or TX4 Telcom transmitters, and whether to use the receiver in the FM-only mode or FM and hearing aid mode were provided. In addition to page-length written instructions, participants were given pocket-sized laminated cards with pictures of the transmitters and receivers, their various settings, and the purpose of the various settings, to carry with them at all times. After it appeared that the veteran and, if available, his communication partner understood how to use the FM system to achieve the selected communication goal, the participant was scheduled for a third study visit 2 weeks later.
Visit 3
On the third visit, the participant's experiences from the prior 2 weeks of FM system use were reviewed, and any difficulties or questions were addressed. The participant's second goal was then discussed. Demonstrations and role-playing were used to facilitate the use of the FM system in situations pertaining to the participant's second goal. Again, written instructions were provided. If a participant did not have a second goal, the demonstrations and role-playing were focused on reinforcing appropriate use of the FM system to achieve the first goal. All participants were scheduled to return for a fourth visit 2 weeks later. This visit was approximately 45 minutes in length.
Visit 4
Visit 4 was 45 minutes in length and similar to visit 3, except the focus of instruction and coaching was on the last identified goal. If there was not a third goal, activities and discussion focused on the first and/or second goals. Participants were then scheduled to return in 2 weeks for the final study visit.
Visit 5
The last study visit lasted approximately 60 minutes. During this visit, the participant's experiences with the FM system were again reviewed, and any remaining questions were addressed. The CPHI Communication Performance questions and the MarkeTrak survey items were then administered in the opposite order to that used during baseline assessment for each participant. After completion of these measures, participants were asked to rate their final ability relative to each of the individually identified goals as per the COSI procedure. In addition, each participant was asked whether he wanted to continue using the FM system now that the trial was completed.
Long-Term Follow-up
One year after completion of the study protocol, all participants who elected to continue use of the FM system beyond the trial period were contacted via telephone, if possible, to tell them that they would be receiving a mailing that included questionnaires. The questionnaires were the CPHI Communication Performance items and the selected MarkeTrak items. Participants were asked to complete the questionnaires and return them via mail in a preaddressed, stamped envelope. Mailings were sent to the last address on file for all participants using FM systems, regardless of whether or not they were reached via telephone.
Results and Preliminary Discussion
Goals of FM Use
The data for the number and category of the COSI goals are summarized in Figure 2. The black bars in Figure 2 show the total number of goals the 36 participants had in each of the COSI categories, and the gray bars show the number of goals in each category for the subset of 30 participants who were using FM devices at 1 year. If a category is not shown on the x-axis in the figure, then none of the participants had a goal for FM use in that category. Examination of Figure 2 reveals the most common goals were related to the categories of conversations with 1 or 2 people in noise, conversations with a group in noise, understanding a familiar speaker on the telephone, and understanding at a church or meeting. A large number of goals also were observed for listening to TV and/or the radio at a normal volume. The least common goals related to conversing with a group or with 1 or 2 others in quiet. In all, the 36 participants generated a total of 104 goals, for an average of 2.88 goals per participant. The 30 participants who were continuing to use FM devices at 1 year generated a total of 86 goals, for an average of 2.87 goals per participant.

The number of Client Oriented Scale of Improvement (COSI) goals in each COSI category for all participants (n = 36) and the subgroup of participants who used FM devices for 1 year (conv = conversation).
Figure 3 summarizes the results obtained for each of the COSI goals after 6 weeks of FM use for both n = 36 and n = 30. Prior to examination of the figure, it is relevant to note that none of the participants indicated that their functioning for any goal was worse as a result of FM use. Thus, Figure 3 shows the percentage of goals for which functioning was reported to be no different or only slightly better as a result of FM use on the left side of the vertical line on the x-axis, as well as the percentage of goals for which the use of an FM device resulted in functioning that was better or much better on the right side of the vertical line. For each goal category, the top stacked bars show the data for n = 36, and the bottom stacked bars show the data for n = 30. It can be seen that a greater percentage of goals in each category was rated as better or much better than as no different or only slightly better for both n = 36 and n = 30, with 1 exception. This was for the category of “conversation with a group in quiet.” There were only 2 goals in this category. For 1 of these goals, use of an FM system made engaging in this activity much better, whereas for the other goal, no difference was found. Indeed, at the end of 1 year, the participant who had reported no difference was no longer using an FM system. As a whole, these data may be interpreted to support that FM systems can be used by adults to meet a majority of individualized listening goals.
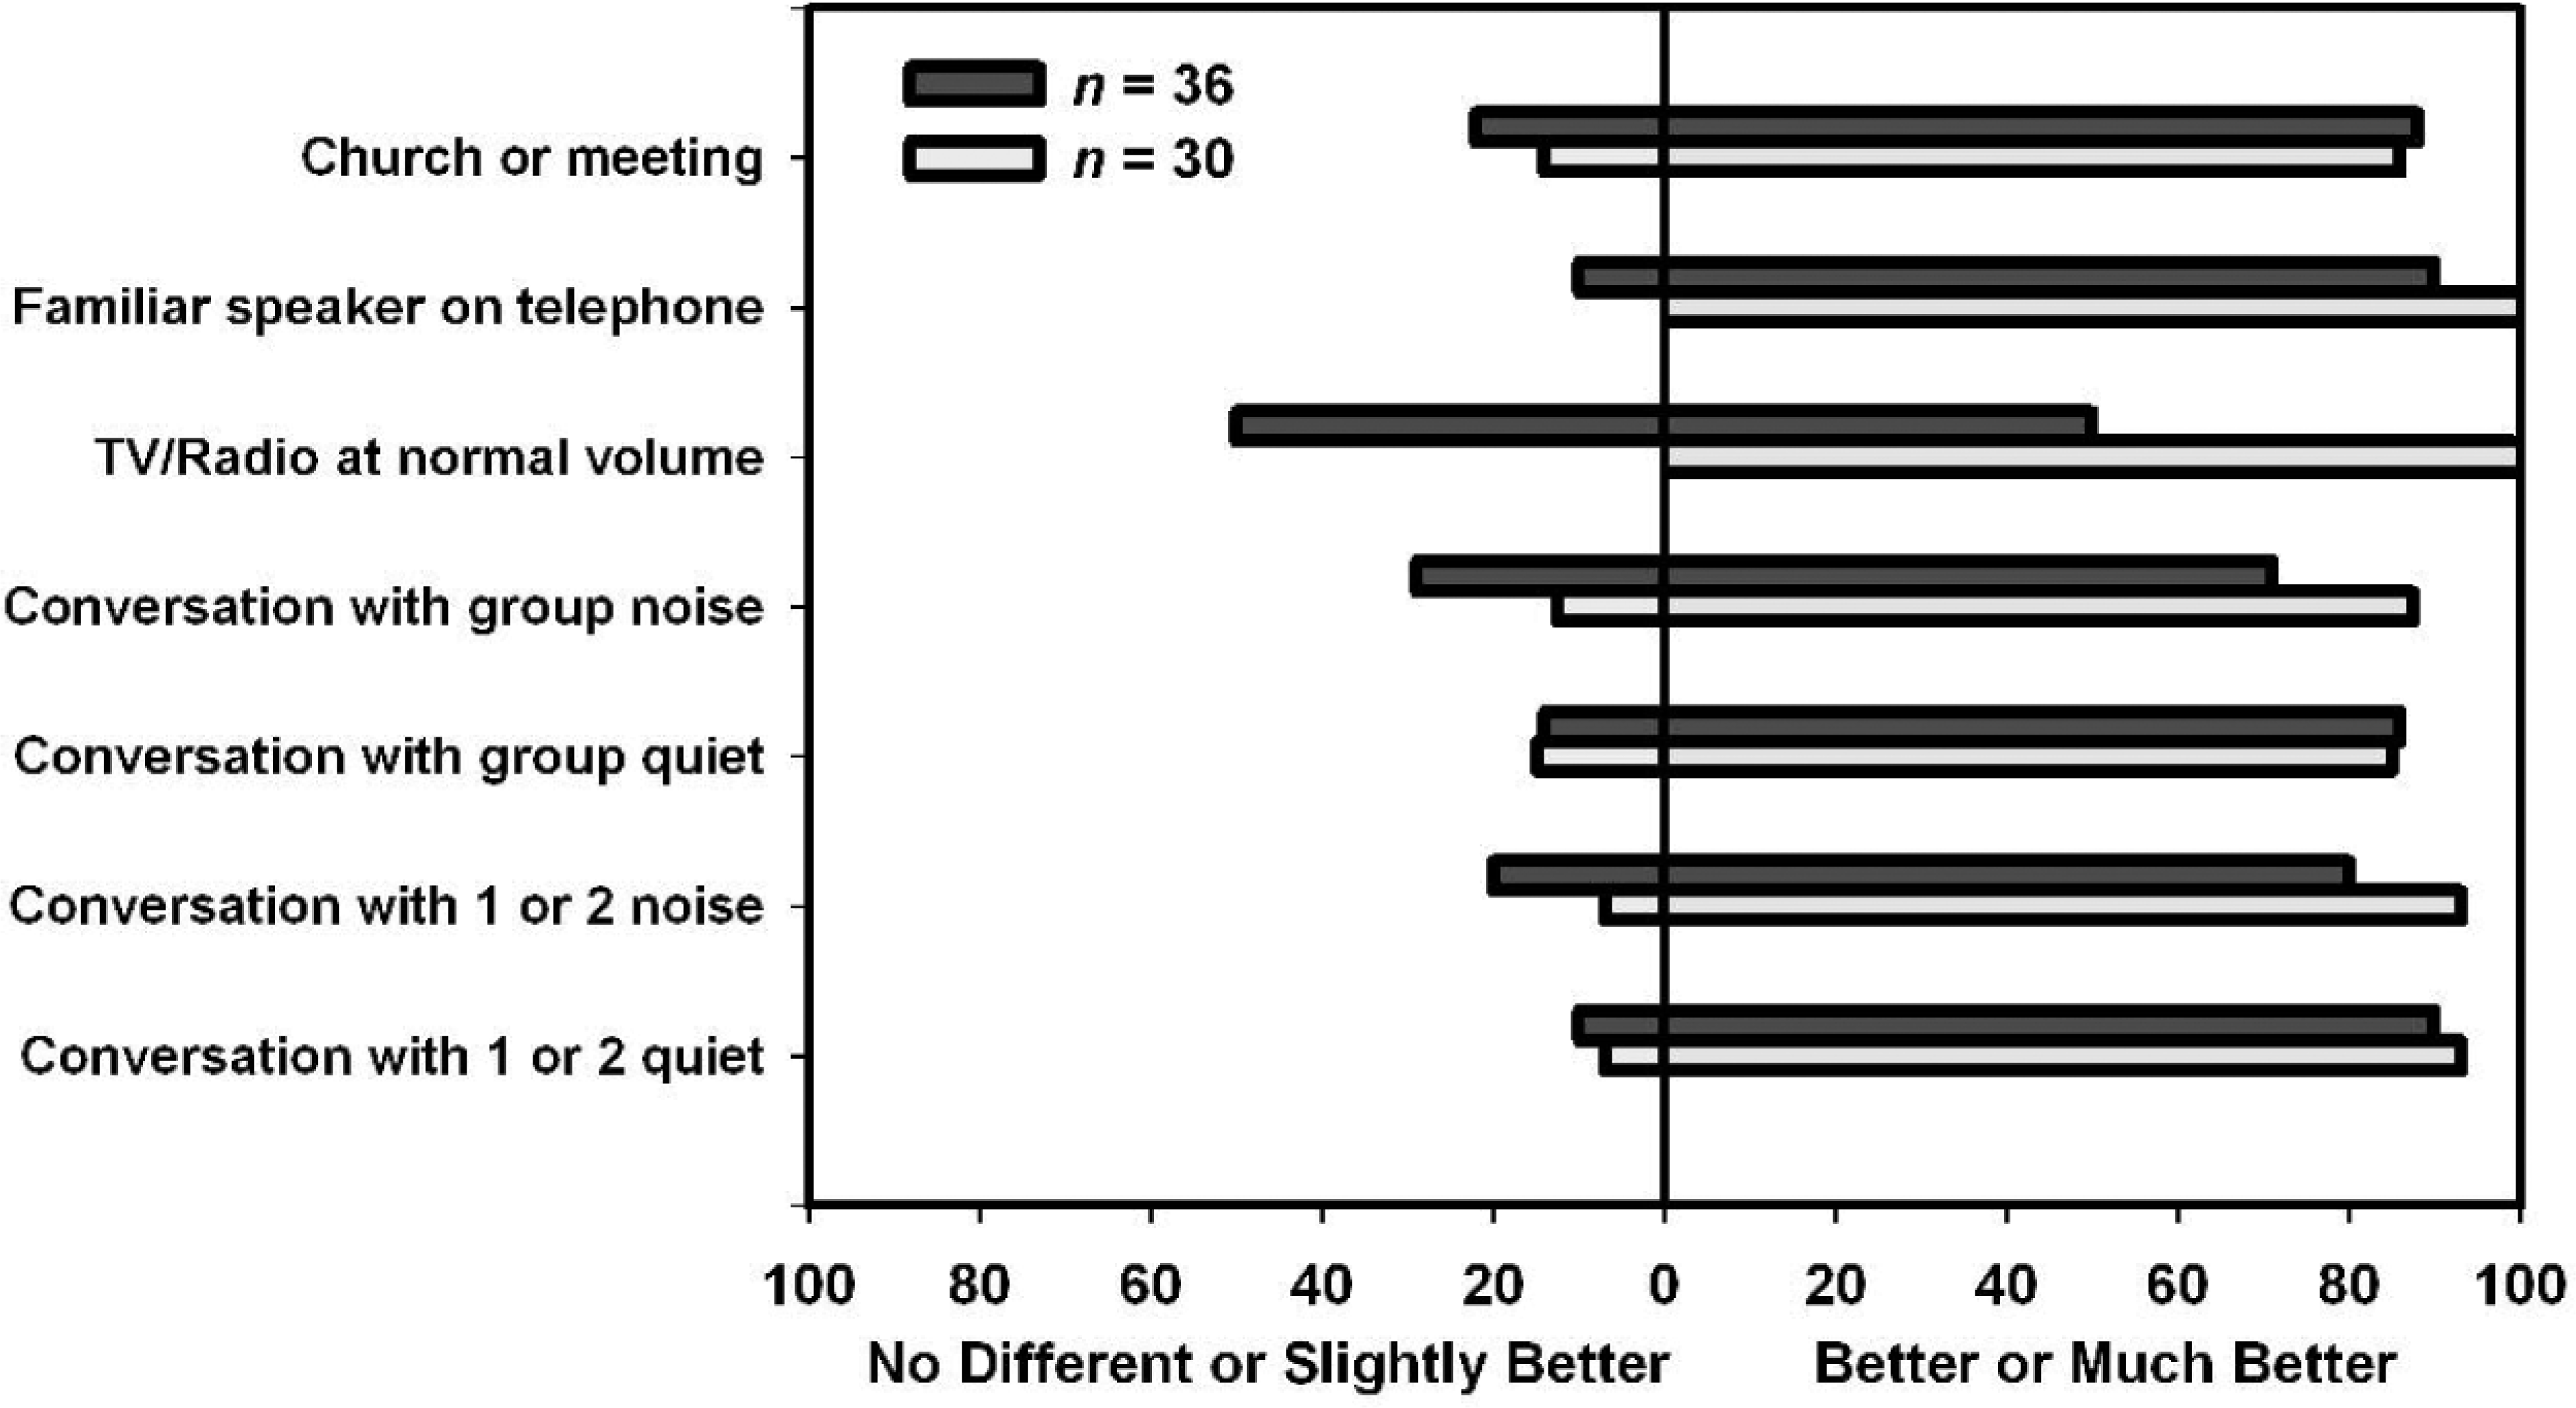
Percentages of participants who reported Final Ability on the Client Oriented Scale of Improvement (COSI) as no different and slightly better versus better or much better as a result of 6 weeks of FM use.
Communication Profile for the Hearing Impaired
Figure 4 shows the mean CPHI scores and standard errors. The left panel in Figure 4 shows the data for n = 36 for hearing aids alone (T1) and with 6 weeks of FM use (T2), and the right panel in Figure 4 shows these data for n = 30, as well as the data obtained after 1 year of FM use (T3). For both data sets, all scale scores were higher after 6 weeks of FM use than with hearing aid use alone. Although scores decreased from 6 weeks to 1 year of FM use, the 1-year scores were still higher than those obtained for hearing aid use alone.

Mean scores and standard errors for the Communication Profile for the Hearing Impaired (CPHI) subscales for hearing aid use alone (HA) and after 6 weeks and 1 year of FM use.
To examine the short-term results (n = 36), a separate paired sample t test between data obtained at T1 and T2 was conducted for each scale score. To examine the long-term results (n = 30), a 1-way repeated-measures version of the general linear model (GLM) analysis of variance (ANOVA) was used to analyze the data for each scale score. Significant main effects were followed by Bonferroni-adjusted paired sample t tests. The significance level for all t tests, GLM analyses, and post hoc analyses was P < .01.
Table 1 summarizes the results for the paired sample t tests and reveals that all of the increases in mean CPHI communication performance scale scores from hearing aid alone to FM 6 weeks were statistically significant. As pointed out recently by Cox, 18 in describing what researchers can do to help support evidence-based practice in hearing health care, the reporting of effect sizes is critical. Thus, the last column in Table 1 shows effect sizes that were calculated as Cohen's d, a ratio reflecting the difference between means divided by the pooled standard deviation. 19 The values shown represent large effects from the use of an FM device for improving self-perception of communication performance.
Results of the Paired Sample t Tests and Effect Size Calculations for the 5 Communication Performance Scales of the Communication Profile for the Hearing Impaired

P < .01.
The results for n = 30 for the GLM ANOVAs on the CPHI data are shown in Table 2. Significant main effects of measurement interval were found for all CPHI scale scores. In addition, post hoc comparisons revealed that both the FM 6-week and FM 1-year scores were significantly higher than the scores obtained with hearing aid use alone for all scales. The 1-year FM scores were significantly less than 6-week FM scores, however, for all scales with 1 exception. The difference between 6-week and 1-year FM scores for the Average scale was not statistically significant.
Summary of General Linear Model Analyses for the Effects of Measurement Interval on Each of the Communication Performance Scales From the Communication Profile for the Hearing Impaired (n = 30)
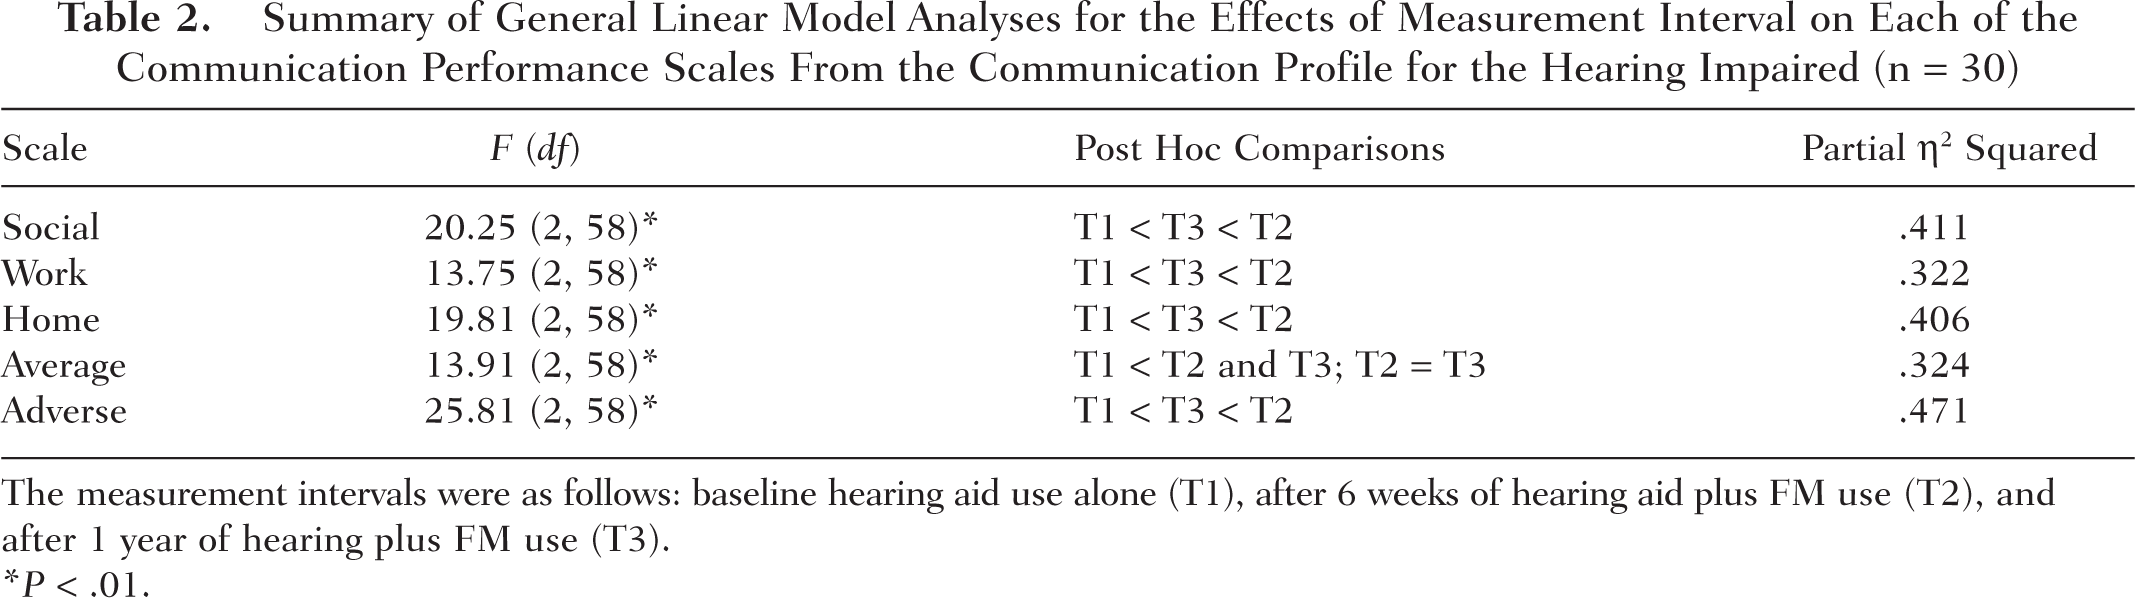
The measurement intervals were as follows: baseline hearing aid use alone (T1), after 6 weeks of hearing aid plus FM use (T2), and after 1 year of hearing plus FM use (T3).
P < .01.
The last column in Table 2 shows the effect sizes calculated in each analysis. Effect sizes were computed as partial eta squared (η 2 ) values. Effect size measures in analysis of variance are measures of the degree of association between a main effect or interaction and the dependent variable. They can be thought of as the correlation between the effect and the dependent variable. When squared, they are interpreted as the proportion of variance that is attributable to each main effect or interaction. Partial η 2 is a commonly used measure of effect size in analysis of variance. 20 It can be seen that in these analyses, the effect of measurement intervals accounted for relatively large portions of the variance for each subscale, ranging from 32% and 47%. Taken as a whole, the CPHI scale score data support a conclusion that the use of FM devices in conjunction with hearing aids by the participants resulted in substantial improvements in self-perception of communication performance over that which occurred with hearing aid use alone. Furthermore, this benefit over hearing aid use alone was maintained after 1 year of FM use.
MarkeTrak
The responses of the participants to the MarkeTrak survey questions were examined in several ways. First, the data for hearing aids alone for all 36 participants were compared to the published data from the MarkeTrak VI survey. 21 This comparison, conducted using χ2 analysis, sought to determine similarities and differences in the responses obtained from the study participants to those obtained from a larger group of hearing aid users, many of whom had lesser degrees of hearing loss than the participants in this study. Data obtained for hearing aids alone (T1) and after 6 weeks of FM use (T2) were examined for both n = 36 and n = 30, using the Wilcoxon matched-pairs signed ranks test, a nonparametric alternative to the related t test, which provides a Z statistic. Then to examine long-term outcomes, the data obtained after 1 year of FM use (T3) were compared to T2 and T1 data for n = 30, using the Wilcoxon matched-pairs signed ranks test.
Overall Satisfaction With Hearing Instruments
The first MarkeTrak question posed to participants was as follows: “Overall how satisfied are with you with your hearing aid?” The percentage of participants in the present study whose responses indicated they were very satisfied or satisfied with hearing aid use was 64%. This figure is slightly higher than the 59% of respondents to the MarkeTrak VI survey, 21 who reported satisfaction with hearing aids. Although 15% of the MarkeTrak VI respondents reported dissatisfaction with their hearing aids, only 8% of the participants in this study indicated that they were dissatisfied or very dissatisfied. χ2 analysis, however, revealed that the difference in the proportion of satisfied to dissatisfied responses in the 2 data sets was not statistically significant, χ2(1) = 1.22, P = .390. This finding suggests that despite severe hearing losses, when asked about device satisfaction in a general way, the participants in the present study appeared to be no less satisfied than any other hearing aid users with amplification.
After 6 weeks and 1 year of FM use, participants were asked to rate overall satisfaction with the FM system. Figure 5 shows the percentage of participants who rated satisfaction as very satisfied or satisfied on the right of the vertical line on the x-axis, as well as the percentage who rated satisfaction as dissatisfied or very dissatisfied on the left. Examination of Figure 5 reveals that after 6 weeks of FM use, the percentage of participants who were satisfied increased dramatically. Statistically significant differences were found for the T1 to T2 comparisons for n = 36 (Wilcoxon matched-pairs signed ranks, Z = 3.4, P = .001) and n = 30 (Wilcoxon matched-pairs signed ranks, Z = 3.3, P = .001). From T2 to T3, the proportion of satisfied to dissatisfied participants changed significantly (Wilcoxon matched-pairs signed ranks, Z = 2.3, P = .023), leading to a lack of a statistically significant difference between T1 and T3 for n = 30 (Wilcoxon matched-pairs signed ranks, Z = 1.39, P = .164).
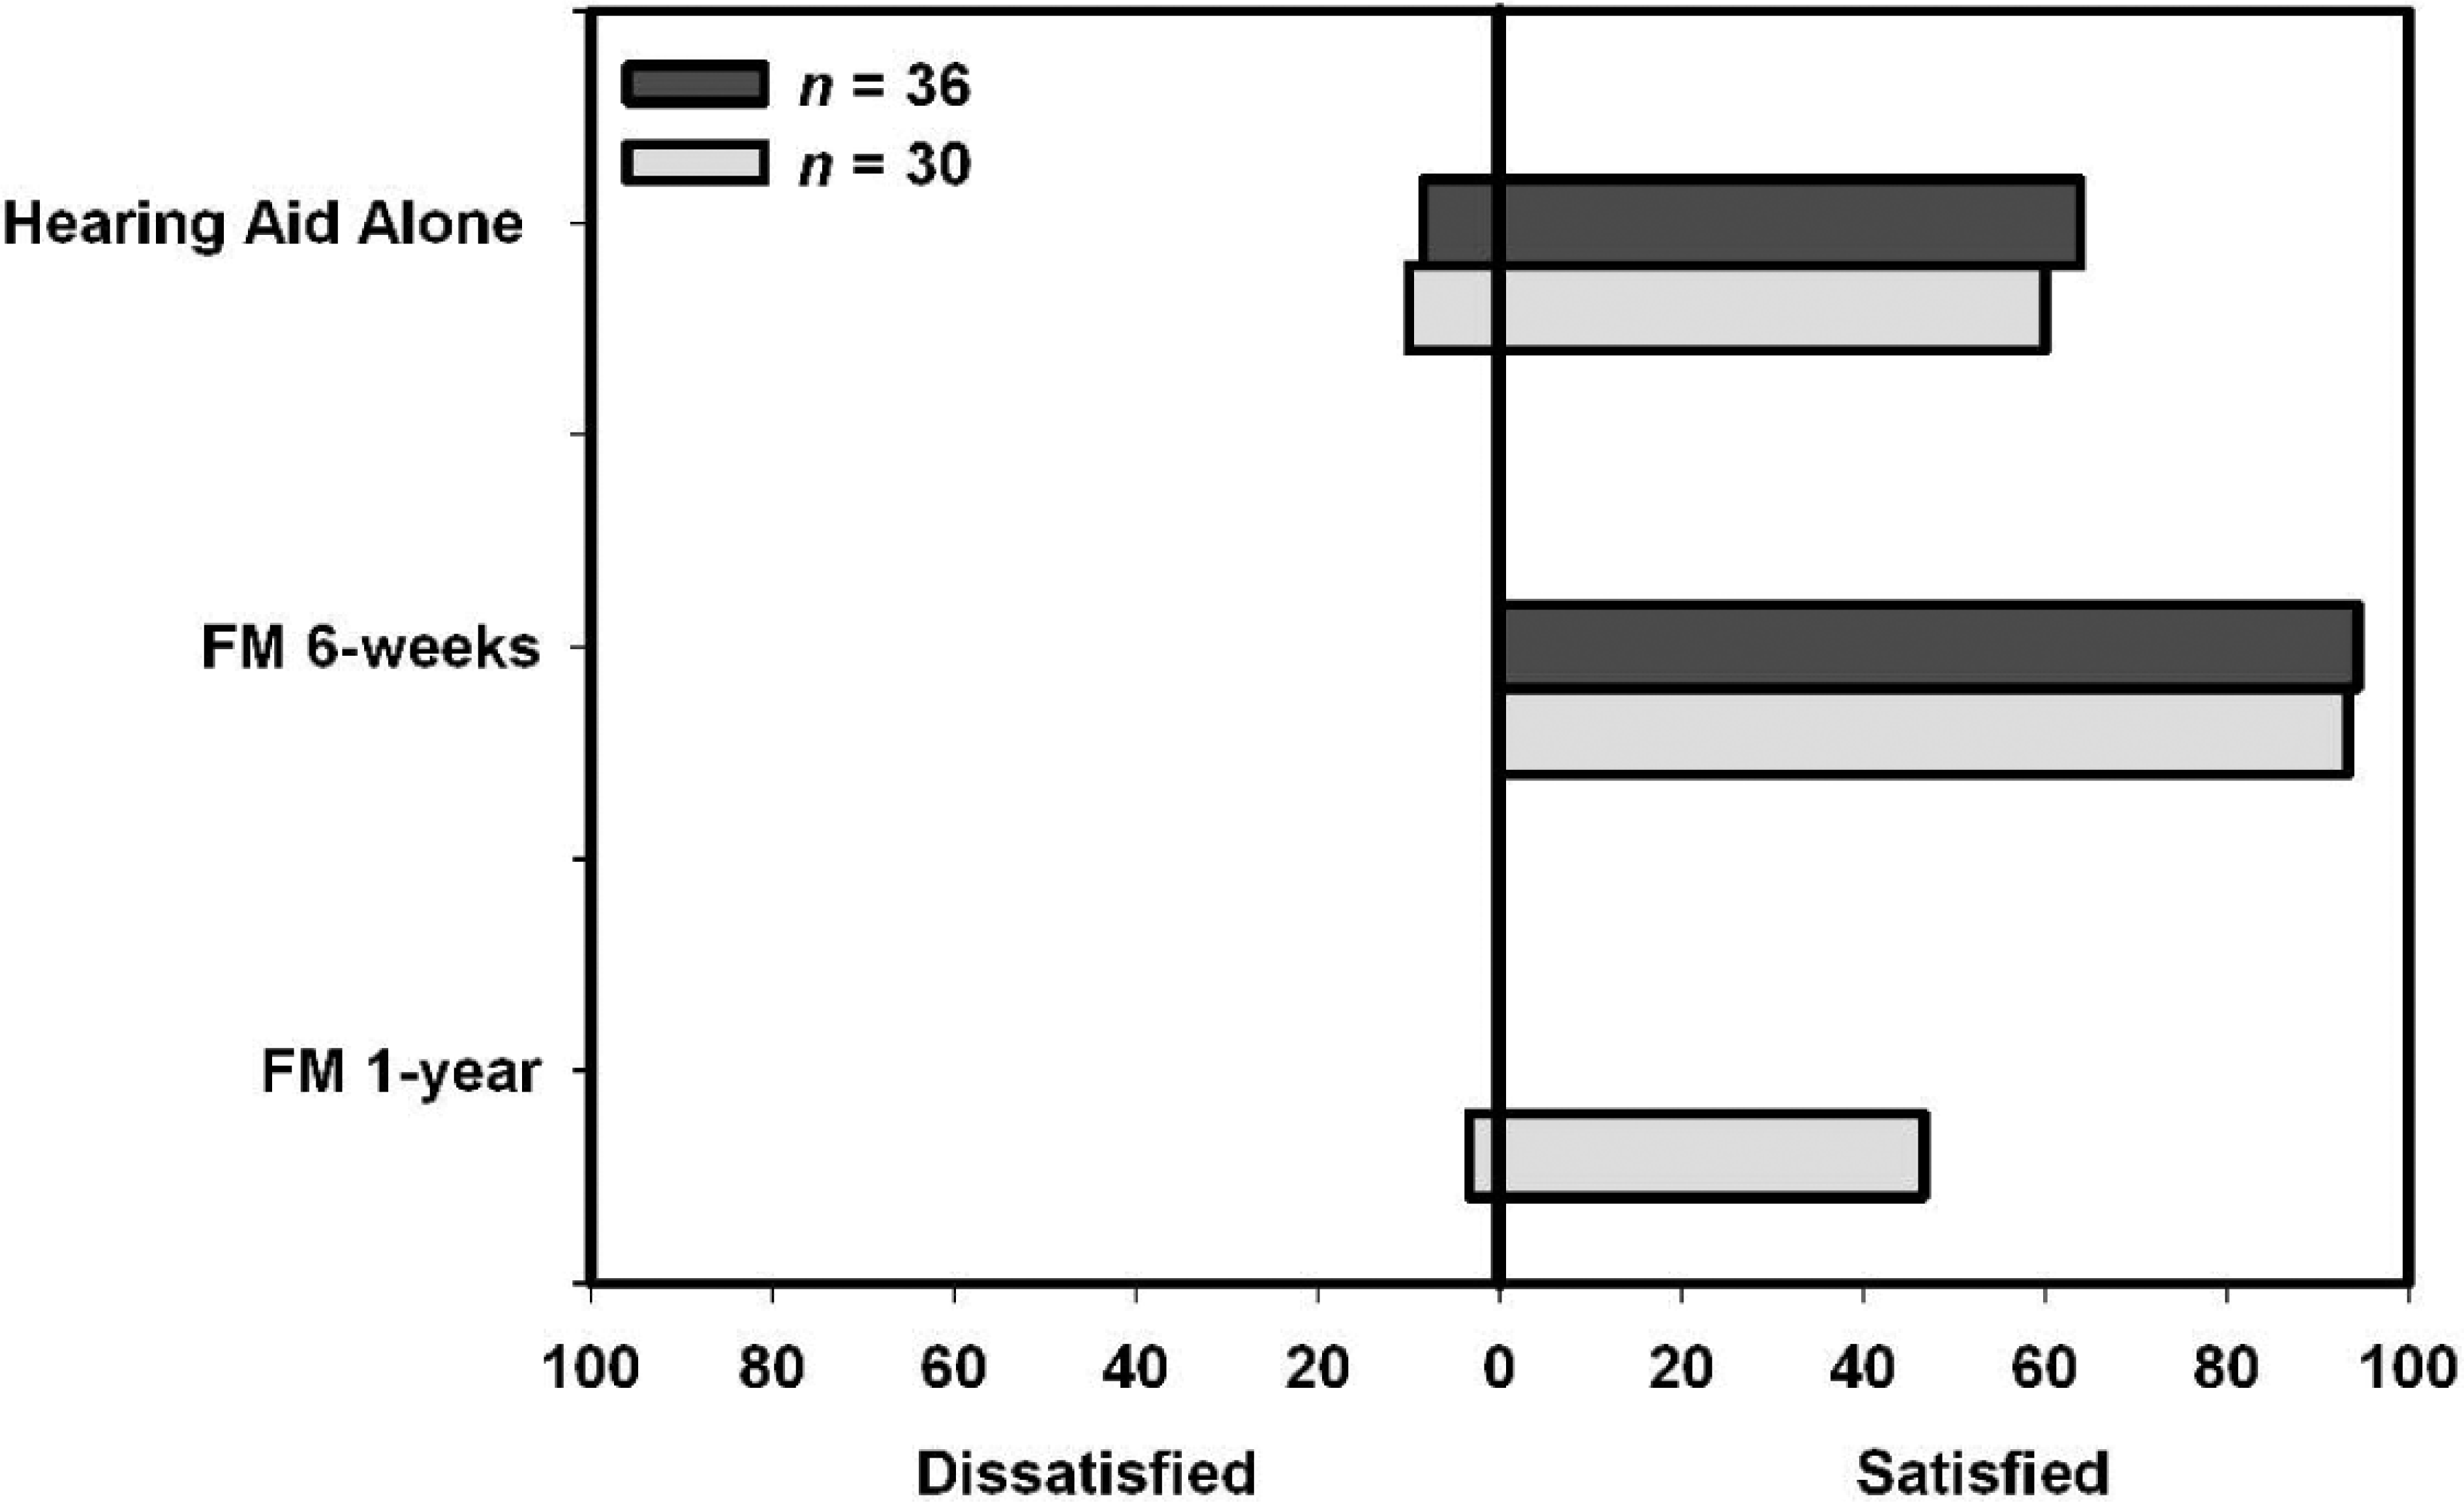
Percentages of participants who indicated overall dissatisfaction or satisfaction with hearing aids alone and FM devices after 6 weeks and 1 year.
The pattern of results indicates that when asked about device satisfaction, in a general way, higher levels of satisfaction were initially found for FM devices than for hearing aids. With long-term FM use, however, a difference in satisfaction between hearing aids and FM devices is no longer apparent. Thus, it is possible that the 6-week results may have been inflated due to the attention being given to the participants. It might also be the case that with continued experience, participants became more aware of the fact that they still had difficulty in some listening situations, even with the use of an FM device. Indeed, in reviewing factors that might influence satisfaction with amplification, Wong et al 22 noted that patient satisfaction can change over time, with the attribute weights determining overall satisfaction changing as a result of product experience. Furthermore, there is at least 1 study in the literature 23 demonstrating that satisfaction with amplification was poorer after 1 year of use than it was after 2 weeks of use.
Quality of Life
When asked how often the use of hearing aids improved quality of life, 17 of the participants indicated always, 14 responded most of the time, 5 responded sometimes, and none indicated never. In describing these data from the MarkeTrak VI survey, Kochkin 21 reported the percentage of respondents indicating always or sometimes as being satisfied (66%) and the percentage indicating never as being dissatisfied (6%). When comparing the data from the present study to the MarkeTrak VI data, χ2 analysis revealed that the difference in the proportion of satisfied to dissatisfied responses in the 2 data sets was not statistically significantly different, χ2(1) = 0.54, P = .463.
Figure 6 shows the percentage of participants who provided always or most of the time responses, as well as the percentage indicating that device use improved overall quality of life only sometimes. As with the hearing aid alone data, none of the participants indicated that the FM devices never improved overall quality of life. It can be seen that the percentage of participants indicating the more positive response (ie, always or most of the time) was higher for hearing aid alone use (T1) than after 6 weeks (T2) of FM use. Thus, it was not surprising that the results of statistical analyses failed to find significant differences in self-perception of quality of life as a result of coupling an FM device to a hearing aid for both the n = 36 (Wilcoxon matched-pairs signed ranks, Z = 0.68, P = .499) and n = 30 (Wilcoxon matched-pairs signed ranks, Z = 0.71, P = .489) T1 to T2 comparison. One likely reason that FM use did not result in statistically significant changes in self-perception of quality of life was that 86% of the participants believed that hearing aid use alone improved quality of life always or most of the time. Thus, there was little room for positive change to occur.

Percentages of participants indicating that hearing aid and FM devices, at 6 weeks and 1 year, improved overall quality of life.
With regard to long-term outcomes, the difference between T2 and T3 failed to reach statistical significance (Wilcoxon matched-pairs signed ranks, Z = 1.44, P = .150). However, Figure 6 shows that after 1 year, there was a relatively large decrease in the percentage of participants providing responses indicating that the FM device always improved quality of life. Furthermore, the difference in response patterns between T1 and T3 was statistically significant (Wilcoxon matched-pairs signed ranks, Z = 2.95, P = .044). One possible explanation for this finding relates to the fact that FM systems are composed of several different components, involving the coupling of receivers to hearing aids, daily charging of components, and a need to ask others to use a microphone. Thus, it may be the case that, despite improvements in communication provided through FM use (as shown by the CPHI results), the continued need to couple receivers, charge units, and request others to use microphones resulted in a decrease in perceived benefits, relative to that obtained through hearing aid use alone, in terms of overall quality of life. Further investigation examining this issue is warranted.
Negative Feelings Associated With Device Use
Participants were asked how often they found themselves embarrassed, ridiculed, or rejected because they used hearing aids (T1) and because they used FM devices (T2 and T3). Data for this question were not provided in the MarkeTrak VI survey, 21 and thus a comparison could not be made. The percentages of participants providing always, most of the time, or sometimes responses, as compared to the percentage providing never responses, at T1, T2, and T3, are shown in Figure 7. It can be seen that the percentage of participants reporting never feeling embarrassed, ridiculed, or rejected when their hearing aids were coupled to an FM device was less than the percentage who indicated the same response when using hearing aids alone, both at 6 weeks and 1 year of FM use. Thus, it was not surprising that statistical analyses indicated significant differences in the patterns of responses for n = 36 for T1 versus T2 (Wilcoxon matched-pairs signed ranks, Z = 2.94, P = .003). Similarly, for n = 30, the T1 versus T2 (Wilcoxon matched-pairs signed ranks, Z = 2.65, P = .008) and T1 versus T3 (Wilcoxon matched-pairs signed ranks, Z = 2.50, P = .013) comparisons were statistically significantly different, but the T2 versus T3 comparison was not (Wilcoxon matched-pairs signed ranks, Z = 1.13, P = .251). One possible explanation for these findings is that when FM use leads to improved communication performance, as shown in the previously presented CPHI results, there is a lessening of feelings of embarrassment, ridicule, and rejection.

Percentages of participants indicating that use of hearing aid and FM devices, at 6 weeks and 1 year, made them feel embarrassed, ridiculed, or rejected.
Satisfaction With Product Features/Value
Participants were asked to rate their satisfaction with 5 device features/values. The percentage of participants who were very satisfied or satisfied, as well as the percentage who were dissatisfied or very dissatisfied, with these features/values of their hearing aids is shown in Figure 8, along with the data from MarkeTrak VI. 21 There was only 1 statistically significant difference between the responses of the 2 groups. This was for the ability to hear soft sounds, with a relatively higher percentage of the MarkeTrak VI respondents being satisfied, χ2(1) = 12.47, P < .001. This finding may be related to the fact that the MarkeTrak VI respondents had a wide range of hearing losses, whereas the participants in the present study exhibited moderate to severe hearing losses.

Percentages of MarkeTrak VI respondents and current study participants indicating dissatisfaction versus satisfaction with hearing aid features and options.
Figure 9 shows the percentage of participants whose responses indicated that they were very dissatisfied or dissatisfied versus satisfied or very satisfied with each of the product features/values, in each data set, across the measurement intervals. When comparing responses obtained for hearing aids (T1) versus FMs after 6 weeks of use (T2), for both n = 36 and n = 30, as well as FMs after 1 year (T3) for n = 30, no statistically significant changes in response patterns were found for 3 features/values: (1) visibility to others, with χ2 values equal to 1.30 (T1 vs T2, n = 36), 1.10 (T1 vs T2, n = 30), and 0.42 (T1 vs T2, n = 30); (2) reliability, with χ2 values equal to 0.54 (T1 vs T2, n = 36), 0.35 (T1 vs T2, n = 30), and 1.04 (T1 vs T2, n = 30); and (3) improving hearing, with χ2 values equal to 1.93 (T1 vs T2, n = 36), 1.90 (T1 vs T2, n = 30), and 0.42 (T1 vs T2, n = 30). The first 2 findings are interpreted positively. That is, a lack of a decrease in satisfaction related to the visibility of FMs as compared to satisfaction with the visibility of hearing aids suggests that FM devices did not make participants feel more self-conscious. This finding is logical given that fewer participants reported feeling “embarrassed, ridiculed, or rejected” from FM use than from hearing aid alone use. In addition, although FM use might be considered more cumbersome, the reliability of FM devices and accessories was at least as reliable as hearing aids alone. In contrast, the lack of finding a statistically reliable increase in satisfaction over that obtained from hearing aid use alone with the use of an FM device for “improvements to hearing” was somewhat disappointing. Examination of the data in Figure 9, however, suggests that this finding might be due to a high percentage of participants reporting satisfaction with how hearing aids improved hearing, leaving little room for positive change.

Percentages of participants indicating dissatisfaction versus satisfaction with hearing aid and FM system (at 6 weeks and 1 year) features and options.
Statistically significant changes in response patterns were found for satisfaction in “noisy situations” after 6 weeks of FM use for n = 36 (Wilcoxon matched-pairs signed ranks, Z = 3.10, P = .002) and n = 30 (Wilcoxon matched-pairs signed ranks, Z = 3.55, P < .000) and after 1 year of FM use (Wilcoxon matched-pairs signed ranks, Z = 2.71, P = .007). As shown in Figure 9, the percentage of participants who were satisfied increased with the use of the FM devices as compared to hearing aid use alone. Improved satisfaction in noisy situations is not surprising, as a major purpose for use of an FM system would be to improve hearing in noise. Indeed, as previously discussed, the results of several investigations provide performance data demonstrating improved speech understanding in noise as a result of FM use by adults.4,7,9,11
Statistically significant changes in response patterns were also found for satisfaction with the use of devices to improve the “ability to hear soft sounds” after 6 weeks of FM use for both n = 36 (Wilcoxon matched-pairs signed ranks, Z = 3.31, P = .001) and n = 30 (Wilcoxon matched-pairs signed ranks, Z = 3.82, P < .000) and after 1 year of FM use for n = 30 (Wilcoxon matched-pairs signed ranks, Z = 3.25, P = .001). As can be seen in Figure 9, a greater percentage of participants were satisfied with their ability to hear soft sounds when using the FM system as compared to when using hearing aids alone. Improvements in the ability to hear soft sounds would be expected when the FM system microphone is placed near the source of those soft sounds.
Satisfaction With Device Use in Specific Listening Environments
Participants were asked to rate their satisfaction with the use of their devices in the specific listening situations shown on the vertical axis of Figure 10. This figure also shows the percentage of participants who were very satisfied or satisfied, as well as the percentage who were dissatisfied or very dissatisfied, with hearing aid use, along with the data from MarkeTrak VI. 21 Given the fact that MarkeTrak VI participants had a wide range of hearing losses, whereas the participants in the present study had moderate to severe hearing losses, it was not surprising to find that statistical analyses revealed significant differences in satisfaction/dissatisfaction ratios for all but 1 listening situation: one-on-one conversations. As shown in Figure 10, in all listening situations, the percentage of participants who were dissatisfied with hearing aids in the specific listening situations was higher for the participants in the present study than the MarkeTrak VI respondents.
Percentages of MarkeTrak VI respondents and current study participants indicating dissatisfaction versus satisfaction with hearing aids in specific listening situations.
Figure 11 shows the percentage of participants who provided very dissatisfied or dissatisfied responses and the percentage who provided satisfied or very satisfied responses for satisfaction with HA, FM at 6 weeks (T2), and FM at 1 year (T3). The pattern of results that would most support the use of an FM device to improve outcomes would be one in which satisfaction with FM use at 6 weeks (T2) and 1 year (T3) was significantly higher than satisfaction with hearing aid use alone, with FM use at 6 weeks remaining essentially stable at 1 year, as demonstrated through a lack of a statistically significant difference between T2 and T3. There were 3 specific listening situations for which this pattern was exhibited: listening in large groups, listening in a restaurant, and listening while riding in a car. A pattern of results, in which significant differences are found for all comparisons, would also be supportive of the use of FM systems to improve satisfaction in a specific listening situation. However, if satisfaction lessens from FM 6 weeks to FM 1 year, the results would suggest that short-term results were either inflated or, conversely, with continued use of FM devices, satisfaction decreased. This pattern of results was noted for 3 listening situations: listening in a small group, watching TV, and listening on the telephone. Because many of the specific COSI goals for FM use by the individuals in the present study involved improving communication in these situations, these findings were encouraging, and given the positive outcomes for individualized goals, the findings were not surprising. It should be noted that the results related to listening on the telephone were likely due to the use of the Phonak Telcom device, which is designed to allow for optimization of telephone listening, as well as listening to television and audio recordings. The Telcom was given to 26 participants who expressed difficulty with hearing on the telephone, which is the same number of participants who reported being satisfied or very satisfied with listening on the telephone with the FM device.

Percentages of participants indicating dissatisfaction versus satisfaction with hearing aid and FM systems (at 6 weeks and 1 year) in specific listening situations.
Although there were a few statistically significant comparisons among the remaining specific 5 listening situations (ie, one-on-one conversations, concerts/movies, places of worship, listening to music, leisure activities), none exhibited a pattern that could be interpreted as supportive of the use of an FM system to improve satisfaction. With regard to the lack of finding a difference in satisfaction for listening one-on-one, this finding was likely due to a high percentage of participants satisfied with hearing aid use in this listening situation (78%), leaving little room for improvement. Recall, too, that only 2 participants had individual goals in the category of improving listening in a one-on-one situation. The lack of finding statistically significant differences in the patterns of satisfaction in the remaining 4 listening situations was somewhat disappointing, as FM devices are often promoted as being helpful in these situations. The findings, in part, may be the result of participants’ lack of appropriate use of the FM device in the situations, despite extensive training. For example, for an FM system to be useful in places of worship, the microphone needs to be used by the speaker. Several participants reported taking the FM systems to religious services but not asking the leader of the service to use the microphone.
Summary and Conclusions
The goal of the present study was to determine if providing adults with counseling, coaching, and instruction regarding the use of FM systems, in conjunction with eliminating out-of-pocket expenses for devices, would result in an increase in the uptake rate of FM use from that noted in previous field evaluations.4,9,11 All participants who completed a 6-week trial period, during which training was provided on how to use the device to meet individualized FM goals, elected to continue use of the devices at the end of the trial period. Initially, the decision to continue to use an FM system after the end of the trial period was considered our “gold-standard” outcome, as few to no participants in previous investigations indicated that they would use FM systems after the end of the trial period.4,9,11 Although use of devices is important, Dillon 24 points out that usage might best be considered a means rather than an end. That is, if patients do not use devices, then they cannot receive any benefit. As the results of the COSI, CPHI, and MarkeTrak data indicate, the magnitude of the benefit received by the participants was substantial. The FM system allowed participants to achieve the majority of their individualized goals. Large effect sizes were measured for the CPHI data, and visual inspection of the MarkeTrak data indicated substantial increases in satisfaction rates. Certainly, the data can be interpreted to support the use of an FM trial period for patients who are not satisfied with the outcomes of hearing aid use in situations where an FM device can be of help. A concern, of course, was that the cost of devices was not an issue in the decision to continue use of FM systems at the end of the trial period. Thus, the role of cost versus the role of training cannot be differentiated at this time. Future research should seek to delineate the influence of these 2 factors on the use of FM devices, as well as other HATs, in the adult population.
Although an understanding of the role of cost in the use of FM devices by adults will need to be addressed in future studies, we did ask participants how much they would be “willing to pay” (WTP) for the FM devices at the end of the 6-week trial period. Willingness-to-pay analyses are considered a special type of cost-benefit analysis and are designed to assess the value associated with the benefits obtained from intervention. 25 Participants were told that the hearing aids they were using cost about $4000 a pair. With that knowledge, they were asked to indicate a WTP value for the FM systems. Willingness-to-pay values ranged from $150.00 to $10,000.00, with a mean value equal to $2509.00. This value was less than the manufacturer's suggested retail price for the systems used in this study, which equaled $3250.00, and only 10 of the 36 participants (∼28%) were willing to pay this amount or more. Thus, these data suggest that cost likely will be a barrier to the use of FM systems by a majority of adults.
Prior to drawing conclusions, the limitations of this study need to be considered. The primary limitation results from the use of a veteran population with a limited range of hearing loss. Although the results of the present study likely can be generalized to other veterans with moderate to severe hearing losses, caution must be taken in generalizing to the nonveteran population of adults with hearing loss. In addition, even within the veteran population, the results of this study may not be generalizable to individuals with milder degrees of hearing loss. Although those with milder degrees of hearing loss may benefit from the use of FM systems, outcomes for this group will need to be examined in future research. With these limitations in mind, the data presented here support the following conclusions:
Adults with hearing loss can learn to effectively use FM devices in daily life to address a variety of listening goals.
Communication performance is perceived to be better when an FM device is coupled to a hearing aid than when a hearing aid is used alone.
There is no difference in self-perception of quality of life when hearing aids are coupled to an FM system as compared to when hearing aids are used alone.
The use of hearing aids coupled to an FM system leads to fewer feelings of embarrassment, ridicule, and rejection than does hearing aid use alone. Furthermore, dissatisfaction with the visibility of FM devices is not greater than dissatisfaction with the visibility of hearing aids.
FM devices are perceived to be as reliable as hearing aids.
When asked about “overall satisfaction” with devices, there is no difference between hearing aids coupled to an FM system and hearing aid use alone. However, satisfaction in “noisy situations” and for “listening to soft sounds” is greater when hearing aids are coupled to an FM system than when hearing aids are used alone.
Coupling hearing aids to an FM device results in significant improvements over that obtained with hearing aids alone, in satisfaction with listening in a variety of situations, but not all situations. Part of the lack of improvement in some situations may be related to inappropriate use of devices.
Future research is needed to delineate the roles of training and cost on FM device use, as well as the use of other hearing assistive technologies, by adults who have the potential to benefit from the use of HATs.
Footnotes
Acknowledgments
Amanda Hemard and Jana Wells completed portions of this work in partial fulfillment of the requirements of the Doctor of Audiology degree at the University of South Florida and Kelly Koder at East Tennessee State University. Lauren Rost assisted in data collection. Portions of this work were supported by Phonak Hearing Systems Inc with additional support from the Rehabilitation Research and Development Service, Department of Veterans Affairs through a Research Career Development award to the third author, and a Research Enhancement Award Program (REAP) to Mountain Home. Preliminary results from this study were presented at ACCESS: Achieving Clear Communication Employing Sound Solutions (November 2003, Chicago, Ill) and the State of the Science Conference on Hearing Enhancement (September 2006, Washington, DC).