
Abstract
Clinicians have long been aware of the range of performance variability with hearing aids. Despite improvements in technology, there remain many instances of well-selected and appropriately fitted hearing aids whereby the user reports minimal improvement in speech understanding. This review presents a multistage framework for understanding how a hearing aid affects performance. Six stages are considered: (1) acoustic content of the signal, (2) modification of the signal by the hearing aid, (3) interaction between sound at the output of the hearing aid and the listener's ear, (4) integrity of the auditory system, (5) coding of available acoustic cues by the listener's auditory system, and (6) correct identification of the speech sound. Within this framework, this review describes methodology and research on 2 new assessment techniques: acoustic analysis of speech measured at the output of the hearing aid and auditory evoked potentials recorded while the listener wears hearing aids. Acoustic analysis topics include the relationship between conventional probe microphone tests and probe microphone measurements using speech, appropriate procedures for such tests, and assessment of signal-processing effects on speech acoustics and recognition. Auditory evoked potential topics include an overview of physiologic measures of speech processing and the effect of hearing loss and hearing aids on cortical auditory evoked potential measurements in response to speech. Finally, the clinical utility of these procedures is discussed.
The perceived effect of a hearing aid varies, sometimes dramatically, across individuals. In a recent survey, 71% of users reported satisfaction, 19% reported dissatisfaction, and 10% reported that they had a neutral response to their hearing aid. 1 Some of this variability may be influenced by the attitudes or expectations of the wearer. 2 Other variability might be accounted for by differences in signal processing or type of amplification or by fitting parameters that are not suitable for the wearer (as when a listener adjusts volume control to suboptimal levels). Nonetheless, there remain many instances of well-selected and appropriately fitted hearing aids whereby the user continues to report minimal improvement in speech understanding. Even when speech recognition testing is performed under optimal listening conditions in a quiet sound booth, there is still a wide range of performance variability. 3 How, then, can we determine whether poor speech recognition is due to the hearing aid (eg, inadequate audibility, alteration of critical cues, or signal-processing parameters not optimal for the individual) versus the individual's ability to make use of the amplified sound?
The contribution of a hearing aid to speech recognition can be viewed as a series of linked stages (Figure 1):

Schematic of the effect of the hearing aid and auditory system.
Representation of the acoustic content of the incoming signal
Modification of the signal by the processing parameters of the hearing aid
Interaction between sound at the output of the hearing aid and the listener's ear
The integrity of the peripheral and central auditory system
Coding of available acoustic cues by the listener's auditory system
Correct identification of the speech sound by the listener
Most previous studies of hearing aid effects relied on the end points of this process—a standardized specification of the hearing aid's processing characteristics and speech recognition. Within that framework, performance differences among individuals with similar audiograms fitted with similar amplification schemes have been assumed to represent differences in the extent to which these listeners can use available auditory information. In other words, it has been difficult to determine whether inconsistent benefit was a failure of the hearing aid to preserve acoustic information or the listener's inability to process available information.
From a rehabilitation perspective, this is an important distinction. If the deficit is at the level of the hearing aid, our attention should be on improving signal processing. On the other hand, if essential speech cues are preserved and audible to the listener, we may want to focus on other strategies such as auditory training or speech reading to maximize use of available information.
How can we distinguish between effects of the hearing aid itself versus processing by an impaired auditory system? Recently, several new techniques have been developed that may help to address these questions. Within the context of the 6 linked stages listed above, this review will describe methodology and research on 2 of these techniques: acoustic analysis of speech measured at the output of the hearing aid and auditory evoked potentials (AEPs) recorded while the listener wears hearing aids.
Stage 1: Representing the Acoustic Content of the Signal
With respect to hearing aid selection and fitting, we tend to think of speech in terms of a single level at each frequency, measured over several seconds or minutes. There are numerous estimates of this long-term average speech spectrum and of the variability of speech spectra across male, female, or child speakers or from whispered to shouted vocal effort.4–8 It is important to remember that speech is not static but rather is a complex signal that varies in frequency and intensity over time. This complexity is illustrated in the wideband spectrogram shown in Figure 2, which represents an analysis of a brief speech sample (2 different sentences spoken by a male talker). The spectrogram demonstrates the frequency content of the speech as a function of time. Intensity is expressed as the darkness of the striations. As shown in Figure 2, speech intensity varies widely even within a single frequency band. For speech spoken at a constant vocal effort, the short-term average speech spectrum varies by as much as 50 dB.9–13 The exact intensity range depends on the frequency of interest, the measurement interval, and how the range is defined. The full range, from maximum (peak) level to minimum, is rarely referenced. Various investigators have used the 1% to 70% range, 9 the 10% to 90% range, 14 and other estimates. Finally, the range of intensities that is important to speech recognition is not the same for all test materials, 15 nor is it evenly distributed. 16 Taken together, these characteristics emphasize the dynamic nature of the speech signal and the need to consider more than long-term average levels in our amplification decisions.

Spectrogram for 2 sentences spoken by a male talker. The panel shows the variation in frequency and intensity over time. Intensity is shown as the darkness of the striations.
Although it is not a true division, for convenience we can think of speech as a combination of temporal and spectral cues. Temporal cues are important contributors to speech recognition.17,18 Rosen 19 described 3 categories of temporal cues. Fine-structure cues are rapid fluctuations in amplitude (>600 Hz) that provide information about place of articulation. Periodicity cues are either periodic (50–500 Hz) or aperiodic (2–10 kHz) fluctuations that provide information about voicing, manner, stress, and intonation. Amplitude envelope cues refer to the slow fluctuations (<50 Hz) that provide information about sound manner and voicing. Of these, amplitude envelope cues are the most important to speech recognition, with smaller contributions from periodicity and fine structure.20,21
The essential information for identification of a specific sound also depends on the spectral content of the sound. For example, static formant pattern is generally considered the most important cue to vowel identity, although dynamic cues such as vowel duration 22 and formant transition 23 also contribute.
For stop consonants, an important clue to place distinction is the spectrum of the burst.24,25 Fricatives, characterized by an interval of aperiodic noise, are identified by spectral peak location, as well as noise duration and amplitude. 26 The nasal consonants are distinguished by the spectral peaks and valleys of the nasal murmur in conjunction with a vowel transition. 22 Speech is a rich signal with overlapping, sometimes redundant acoustic cues. And, of course, in conversations listeners can access other information, including visual cues or contextual cues to aid in understanding. Yet listeners with hearing loss continue to have difficulty, even with suitable amplification. We next examine the second stage of our model: signal modification by the hearing aid.
Stage 2: Modification of the Signal Through Hearing Aid Processing and Measuring Output of the Hearing Aid
Researchers have long been interested in objective measures to assess the effects of amplification on the speech signal.27–32 Probe microphone recordings are often used because of their clinical efficiency, requiring minimal time and patient cooperation. In this technique, a small-diameter tube is placed into the listener's ear canal so that the proximal tip of the tube is close to the tympanic membrane. The tube is coupled to a microphone, which allows recording and analysis of sound levels at a point close to the listener's tympanic membrane. An external speaker or earphone is used to present sound. Probe microphone recordings can be obtained in the open ear canal; in those cases, the recording reflects the acoustic effects of the pinna and canal. This measure is termed the real ear unaided response. An example is shown by the curve labeled “3” in Figure 3. More commonly, the signal of interest is amplified sound recorded with a hearing aid in the ear. In those cases, the recording reflects the acoustic effects of the pinna and canal plus the electroacoustic effect of the hearing aid.
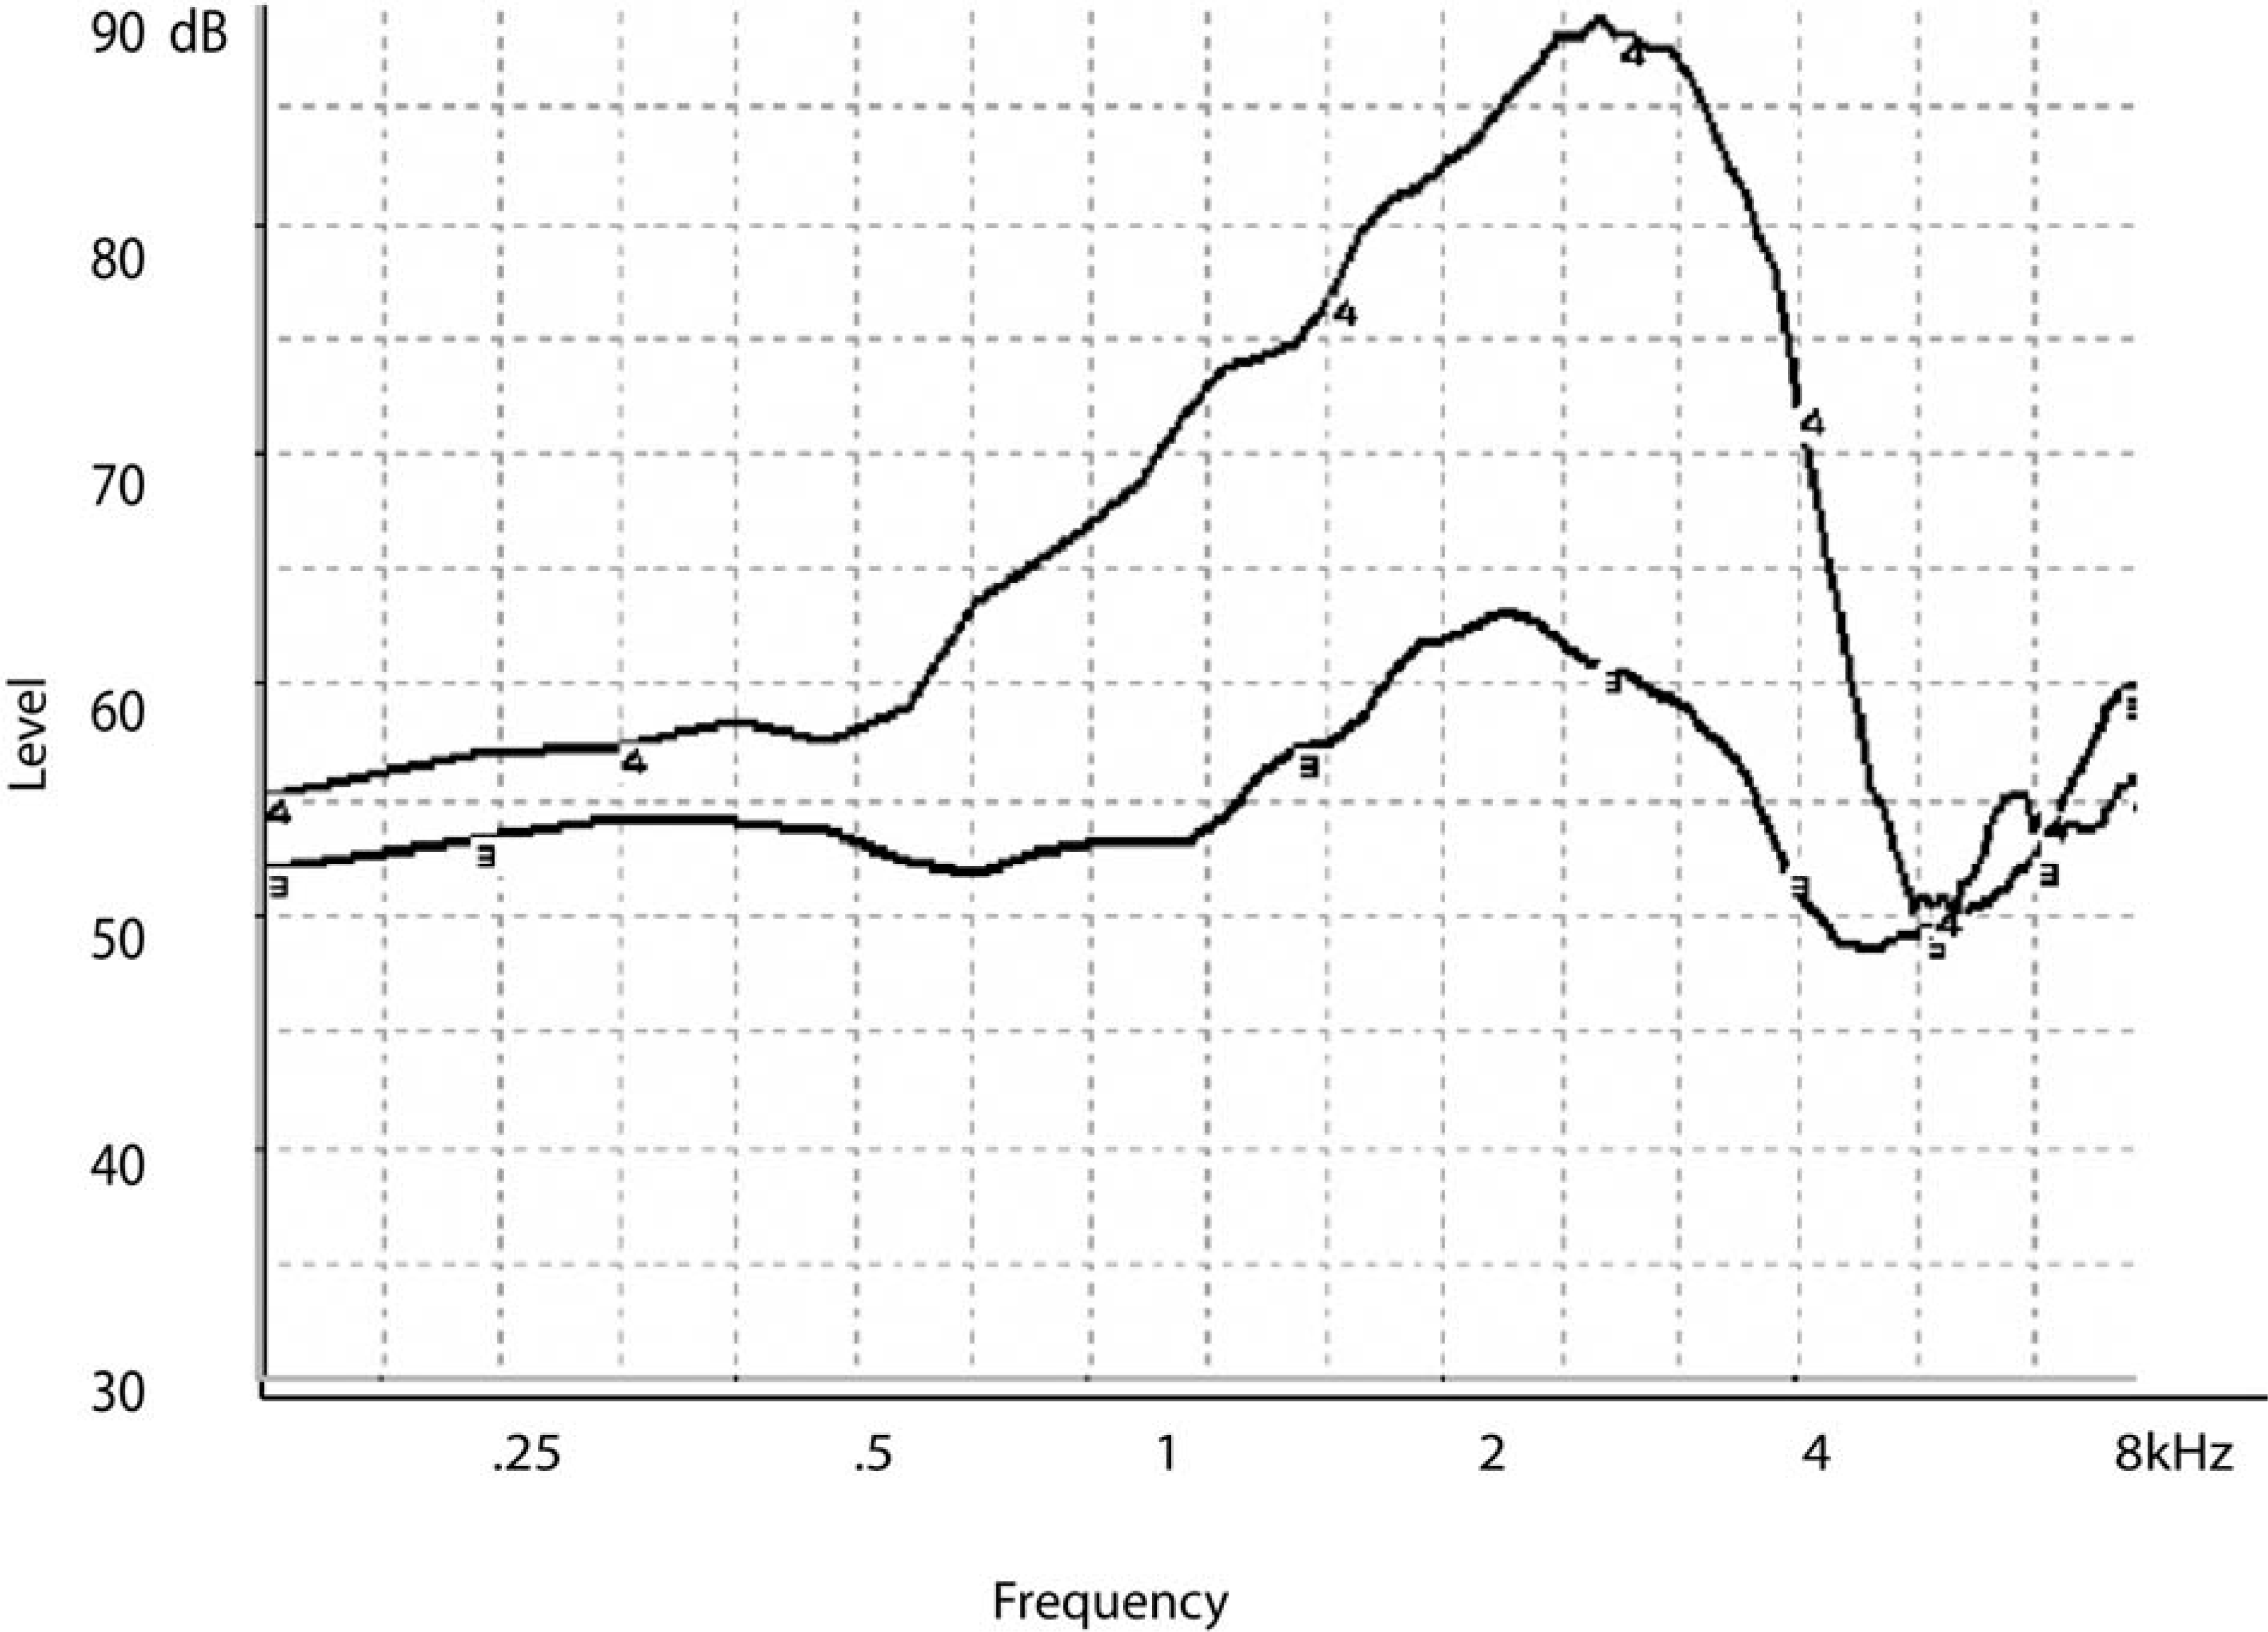
The real ear aided response (REAR) measured with the hearing aid in the ear is shown by the curve labeled “4.” The real ear unaided response (REUR) measured in the unoccluded ear is shown by the curve labeled “3.” Both responses are expressed in decibel sound pressure level (dB SPL) as a function of frequency.
Traditionally, probe microphone measurements are obtained using pure tones or broadband noise. In one approach, the hearing aid output is measured directly and expressed in decibel sound pressure level (dB SPL) as a function of frequency; this is termed the real ear aided response (REAR). An example is shown by the curve labeled “4” in Figure 3. In an alternative approach, the effect of the hearing aid is calculated as the difference between the measured output of the hearing aid and the unaided ear response, or REUR (ie, the acoustic effects of the pinna, concha, and ear canal), at each frequency and is termed the real ear insertion response (REIR) (Figure 4). Although the REIR has a longer history, the REAR is now seen as a potentially more useful measure, particularly when used with nonlinear hearing aids. 33 In either case, the measured response is visually and/or numerically compared to a predetermined target response based on a prescriptive formula applied to the audiometric thresholds.34–37 Although there are no universally accepted criteria for an adequate match to target, it is considered desirable for the measured response to closely approximate the target response. Dillon 38 suggested that deviations of 10 dB or greater are unacceptable and deviations of 3 dB or fewer are acceptable. Whether deviations greater than 3 dB but fewer than 10 dB are acceptable will depend on a number of factors, including the frequency, input level, and hearing aid features such as a manual volume control. For example, a deviation of 8 dB below target might be acceptable at 0.25 kHz but not at 2 kHz. Beamer et al 39 suggested that deviations as large as 15 dB may be acceptable in some listeners with normal hearing through 2 kHz. Mueller 40 suggested that the decision should be based not on the absolute difference in decibels between the target and the measured response but rather on whether the deviation resulted in decreased speech understanding. Alternatively, the deviation might be related to a normative group of similar fittings. In other words, if 80% of the time it was not possible to increase the hearing aid gain to within 5 dB of target at 4 kHz, that would be an unreasonable standard to meet for any specific patient.

The real ear insertion response (REIR) calculated as the difference between the real ear aided response (REAR) and the real ear unaided response (REUR) shown in Figure 3. Values are expressed in decibel sound pressure level (dB SPL) as a function of frequency.
The American Speech-Language-Hearing Association recommends probe microphone testing as the primary means of verifying a hearing aid fitting. 41 Among audiologists, these standards seem well accepted; probe microphone measures were used in 93% of clinic and university settings. 42 Their use by nonaudiologist dispensers was much lower: Only 23% had access to probe microphone equipment, and only about half those dispensers used it routinely. 43 Reasons for not using probe microphone recordings have not been detailed, but we can speculate on some likely reasons. One possibility is the expense of the equipment, which may present an obstacle for small practices. It is also possible that some clinicians are discouraged by unfamiliarity or lack of training in probe microphone testing. Master's level audiologists with 15 or more years’ experience were least likely to use probe microphone testing in their practice. 33 Because probe microphone testing was not readily available until the mid- to late 1980s, those clinicians were probably less likely to receive extensive training during their graduate programs. Third, some clinicians may be concerned about the additional time needed for probe microphone testing. Fourth, there is a recent increased reliance on fitting software to estimate hearing aid responses on the patient. Although hearing aid manufacturers’ predictions of the aided response should not be considered a definitive measure of how the hearing aid will behave in the patient's ear, 44 they may have contributed to less reliance on direct measurement. Dillon and Keidser 45 argue convincingly that specific concerns about probe microphone testing such as the potential for error in probe tube placement or lack of universal acceptance of a single target as the optimal response can be discounted if appropriate procedures and clinical decisions are made. Probe microphone measurements can improve the accuracy and efficiency of the hearing aid fitting process.
But conventional probe microphone measurements also have limitations. Static signals cannot adequately describe the effects of compression on the complex, dynamic speech waveform in individual listeners. Pure-tone sweeps, in particular, are dissimilar to speech: each tone is presented sequentially; each may be of longer duration than brief speech components; and a constant-level pure-tone sweep has a different spectrum, with greater high-frequency input levels, than speech does. Speech-weighted noise signals, such as composite noise, are designed to mimic speech characteristics such as frequency content and crest factor. Such signals more closely estimate aided speech but still contain significant discrepancies, even when only long-term average speech levels are considered. Although multiple levels of composite noise can be used to represent a range of speech presentations, from soft to loud, even speech produced at a constant long-term intensity level varies widely in short-term intensity level over time. 9 The comparison is more complex when multiple vocal efforts from whispering to shouting are considered. The next sections describe differences in measured gain and output for speech versus nonspeech signals.
Using Nonspeech Signals to Predict Real-Speech Hearing Aid Output
How well do probe microphone tests using nonspeech signals precisely predict the speech output of a hearing aid? It turns out that the answer is, not exactly; so we also may want to know under what circumstances there is good agreement and under what circumstances the responses diverge to an extent that could affect the success of the hearing aid fitting.
Stelmachowicz et al 46 measured signal output in a coupler for a large number of wearable hearing aids. Different approaches to processing were represented, ranging from linear amplification to multichannel, wide-dynamic range compression. Test signals included speech-weighted composite noise, swept pure tones, a signal composed of multiple frequency-modulated tones, a speech-weighted warble tone, speech-modulated noise, and continuous discourse. The nonspeech gain and speech gain were similar for linear amplification. However, nonlinear amplification is the most common choice for new fittings. 47 With nonlinear amplification, the gain for speech was usually higher than the gain for nonspeech signals, especially at higher frequencies. The greatest discrepancy occurred for the swept pure tone, followed by the speech-weighted composite noise, with the smallest discrepancy for the other “speechlike” noises. This makes sense if we think of compression as a reduction in gain. A pure-tone sweep has more high-frequency energy, so it may exceed the compression threshold (ie, activate gain reduction) when speech does not. Also, a nonfluctuating (pure-tone) signal will achieve a higher compression ratio and thus greater gain reduction than will a fluctuating (speech) signal. 48 Cox and Flamme 49 concurred that the greatest discrepancy in predicted gain occurred for pure-tone signals and also found that the magnitude of the error increased at higher compression ratios. If measured gain for nonspeech signals is lower than prescribed gain, the clinician might increase the hearing aid gain, not realizing that gain for speech will be higher. Thus, the chief risk of basing fitting decisions on nonspeech signals is overamplification, including greater loudness discomfort (although this might be corrected by later fine-tuning) and poor sound quality because of unnecessarily high gain.
Stelmachowicz and colleagues 46 were skeptical that nonspeech-to-speech correction factors could be devised, given the wide variability among commercial hearing aids. However, Scollie and colleagues50,51 attempted to do so in a later series of experiments. The basic approach was similar to Stelmachowicz, comparing hearing aid outputs measured with continuous discourse and with nonspeech signals—in this case, a swept pure tone, a speech-weighted composite noise, and a speech-weighted noise comprising warble tones. Scollie and colleagues used a larger number of hearing aids and variety of circuit types. They also expanded on the Stelmachowicz findings by adding digital hearing aids, a wider range of hearing aid power up to those suitable for severe-to-profound loss, and by comparing output rather than gain. Similar to Stelmachowicz, Scollie found that the largest speech-to-nonspeech discrepancy occurred for pure tones and in the higher frequencies. From these measurements, Scollie and colleagues 51 developed sets of correction factors that can be applied to nonspeech measurements to estimate hearing aid gain for speech. The most successful of these were derived from a multiple regression analysis, but because of the complexity of those equations and the need to use multiple calculations (eg, each frequency would have its own correction), they are probably of limited clinical use at this time. If such corrections are eventually incorporated into clinical test equipment, their use might become more widespread.
Most recently, Henning and Bentler 52 addressed similar questions. Their specific goal was to expand on previous work by systematically analyzing the effect of compression parameters (release time, compression ratio, and number of channels) on the gain difference for speech and nonspeech inputs. The speech signal was continuous discourse. Nonspeech signals were a swept pure tone, speech-weighted composite noise, and the speech-modulated International Collegium of Rehabilitative Audiology (ICRA) noise. 53 Speech and nonspeech signal output were most similar for lower input levels or at low compression ratios and diverged for higher input levels, higher compression ratios, and multiple compression channels. Changing release time had the largest effect when compression ratio was also high; in those cases, the speech and nonspeech gain was more similar when release time was short. Henning and Bentler recommended that direct speech measurements be used whenever possible.
Using Nonspeech Signals With Digital Hearing Aids
There is one additional concern regarding use of nonspeech signals to predict performance of a hearing aid to speech in everyday listening. Some digital hearing aids contain noise reduction circuitry that attempts to distinguish between “speech” and “noise” based on some characteristic of the signal; usually, the modulation spectrum. 54 When activated, these algorithms will interpret conventional test signals as “noise” and respond by reducing gain (Figure 5). Scollie and Seewald 50 confirmed as much as a 14 dB root-mean square (RMS) difference between the output of speech and output of conventional test signals when processed by a digital, noise-reduction hearing aid. In such cases, the end measurement does not reflect the response of the hearing aid to a speech signal. This may be the source of the mistaken idea that digital hearing aids cannot be accurately evaluated with conventional probe microphone testing.

Example of a real-ear aided response for a composite noise input measured with digital noise reduction engaged (curve “12”) and disengaged (curve “5”). Unwanted reduction of the input signal can also be avoided by using either speech or a speechlike signal (ie, International Collegium of Rehabilitative Audiology noise) as the input.
There are 2 simple solutions to this problem. First, the noise reduction algorithm can sometimes be disabled in the hearing aid software. The obvious drawback is that the hearing aid does not respond during the test session as it would be under realistic listening conditions. 55 Second, most probe microphone measurement systems offer either recorded speech or other signals that mimic the characteristics of speech. Some equipment offers ICRA noise recordings that are modulated at rates similar to conversational speech, whereas other equipment uses swept, modulated sine waves to approximate the dynamic range of speech. 56 Use of speech stimuli to assess hearing aids is discussed in the next section.
Using Real Speech to Measure Hearing Aids in the Clinic
Recently, manufacturers of probe microphone equipment have begun to offer real speech signals as an equipment option. These are appealing both for their face validity and for their closer approximation to the signals encountered in real life. In contrast to a static noise that approximates the long-term average speech level, real speech allows the fitter to assess whether the dynamic range of speech is placed within the listener's dynamic range.
A number of products are available for clinicians who wish to measure speech in the ear canal. The choice depends, in part, on whether speech will be recorded and stored or simply viewed. The examples described here are not meant as an all-inclusive list but are meant to encourage the expansion of clinical techniques to include real speech measurement.
Most of the commercially available probe microphone systems allow the user to use externally generated speech either from a separate playback device or “live” speech from the clinician or family members as an alternative to the standard noise or pure-tone signal. Some systems, such as the Madsen VisibleSpeech or MedRx Live Speech Mapping, market this function as a specific advantage of their systems. The most convenient include speech as an integrated stimulus, such as the Speechmap system used in the Audioscan Verifit.
The original Speechmap was based on data that suggested that hearing aid fitting would be optimized when the output speech was placed within the residual dynamic range.14,57,58 In the Verifit, the listener's auditory threshold is entered in dB hearing level (HL) and converted to dB SPL levels, using either a standard transform or a directly measured real-ear-to-coupler difference (RECD). Loudness discomfort levels can be directly entered or predicted from auditory threshold levels. Signal choices built into the equipment include individual male, female, and child voices at a range of input levels, as well as a male voice filtered to represent the Cox and Moore 5 long-term average speech spectrum. For each input signal, speech is presented and the long-term average (10 seconds) and the short-term speech levels (128 milliseconds) measured at the probe microphone are analyzed within a series of one-third octave bands. The output is then graphed relative to the listener's auditory thresholds (Figure 6). In addition to the long-term average level, the speech peaks (1st percentile) and valleys (70th percentile) calculated from the short-term speech levels also are shown. If maximum audibility and comfort are desired, high-intensity components will fall below the loudness discomfort level, and the low-intensity components will fall above auditory thresholds. The information display can be enriched by presenting multiple input levels and displaying multiple speech ranges. An example is shown in Figure 7. In each panel, the speech range for a different input level is shown relative to the listener's hearing thresholds, predicted uncomfortable loudness levels, and prescribed hearing aid output. This offers a significant advantage over a single, nonspeech signal to assess amplification effects.

Example of the aided speech range recorded at a single input level. The center line within the shaded area is the long-term average speech spectrum; the top and bottom edges of the shaded area indicate the 1st to 70th percentile levels of the short-term speech spectrum. The listener's thresholds are shown by the open circles and predicted uncomfortable loudness levels by the asterisks. The minimum audibility curve for a normal-hearing listener is shown by the light dashed line at the lower edge of each panel. Figure courtesy of Audioscan.

Example of the aided speech range recorded at multiple input levels. The left panel shows a 55 decibel sound pressure level (dB SPL) input and the right panel shows a 70 dB SPL input level. For each input spectra, the top and bottom edges of the shaded area indicate the 1st to 70th percentile levels of the amplified short-term speech spectrum. The listener's thresholds are shown by the “x” symbols in the left panel and the “o” symbols in the right panel, predicted uncomfortable loudness levels by the asterisks, and prescribed output for a conversational-level input by the “+” symbols. For the 55 dB SPL input, approximately the top 50% of the speech range is audible through 3 kHz. For the 70 dB SPL input, the speech range is audible through 4 kHz, and the long-term average speech spectrum is well-matched to prescribed output. The light dashed line at the lower edge of each panel shows the minimum audibility curve for a normal-hearing listener. The solid line at the upper edge of each panel shows the measured real-ear saturation response for a 90 dB SPL input. Figure courtesy of Audioscan.
Another example is shown in Figure 8. This illustrates the effect of slow-acting compression, which does not reduce the speech range, versus fast-acting wide-dynamic range compression amplification, which does. Such information provides an important diagnostic tool to verify hearing aid function and troubleshoot patient complaints. Besides its value to the clinician, this technique also may be useful as a counseling tool, allowing the patient to visualize and understand the effects of amplification on speech. 59

Example of the aided speech range recorded with slow-acting compression (horizontal hatched lines) versus fast-acting compression (vertical hatched lines). In each case, the input signal was 70 decibel sound pressure level (dB SPL). For this speech-weighted noise signal, which did not include any brief, high-intensity components, the slow-acting or “dual” compression had a 900-millisecond attack time and a 1.5-second release time; the fast-acting or “syllabic” compression had a 9-millisecond attack time and 90-millisecond release time. The lower limit of the aided range is similar for both processors. The reduction in speech range for the fast-acting relative to slow-acting processor can be seen as a difference in the upper limit of the aided range. The minimum audibility curve is shown by the light dashed line at the lower edge of the panel. Figure courtesy of Audioscan.
Stage 3: Recording and Analyzing Sound to Understand the Interaction Between Speech at the Output of the Hearing Aid and the Listener's Ear
If there is a limitation to the previously described methods, it is that the measured levels cannot represent audibility of individual sounds. For example, /s/ is a linguistically important phoneme, yet conventional amplification fitting procedures may fail to provide sufficient /s/ audibility for some speakers, including the hearing aid wearer's own voice.60,61 Work by Boothroyd et al 62 demonstrates that the spectra of individual phonemes varies significantly even among different speakers of the same age and gender. To understand how amplification affects specific spectral and temporal properties of the speech signal, a different technique is needed.
Most clinical probe microphone systems can be used to measure individual sound levels if the standard input signal is turned off and an external signal is used. Two examples are presented to assess self-speech vowel loudness and fricative (/s/) audibility using the spectrum analyzer module of the Fonix 6500. Figure 9 shows an example of the phoneme /s/ produced by a female speaker and recorded in the listener's unaided and unoccluded ear canal. Figure 10 shows an example of the phoneme /α/ (“ah”) produced by a female speaker and recorded in the listener's unaided and unoccluded ear canal. In contrast to /s/, /α/ is higher in intensity and dominated by lower-frequency energy. Audibility of each phoneme could also be assessed by comparing the measured dB SPL levels to listener thresholds (in dB SPL, see below for information about threshold conversion). However, analysis features of clinical systems are usually more limited, with less control over windowing or averaging parameters. More detailed analysis of hearing-aid amplified speech can be done by using probe microphone systems that offer speech recording capability. Systems for recording and viewing individual speech components in the ear canal require a probe microphone that can be used in conjunction with a hearing aid. As with conventional probe microphone measurements, the position of the tip of the probe tube relative to the tympanic membrane affects the measured level. 63 An output transducer is necessary to transfer the output signal for storage, viewing, and analysis. The noise floor of the equipment should be sufficiently low to measure even low-intensity speech components. Recording systems intended for otoacoustic emissions typically have much lower noise levels but may not include a probe apparatus adapted for coupling to wearable hearing aids. Finally, the system needs a means of calibration so that recorded speech can be expressed in absolute levels (ie, dB SPL at the tympanic membrane). Often the calibration is in the form of a calibration tone built into the system.

Example of the phoneme /s/ produced by a female speaker and recorded in the ear canal of an unaided listener.

Example of the vowel /a/ produced by a female speaker and recorded in the ear canal of an unaided listener.
Any assessment of aided speech audibility also requires measurement accuracy in hearing thresholds. Like the recorded speech, the listener's thresholds should be expressed as dB SPL at the tympanic membrane. A probe microphone system can be used to directly measure the real ear SPL at threshold. This is seldom done in the clinic, in part because thresholds below the noise floor of the probe microphone system cannot be measured. An alternative approach is to measure individual correction factors, or transforms, and add them to the dB HL audiogram values at each frequency to obtain predicted real ear SPL values. When thresholds are measured using supra-aural headphones, the real-ear-to-dial difference (REDD) is added to the dB HL threshold. When thresholds are measured using insert earphones, the RECD plus the reference equivalent sound pressure level 64 is added to the dB HL threshold. Detailed instructions for obtaining these measures are readily available.65–67 Either transform is accurate and reliable.68,69 Standard REDD and RECD transforms are also available,70,71 but even age-appropriate transforms can under- or overestimate values for a given individual.72,73 Accordingly, individually predicted real ear SPL values are suggested for use with in-ear acoustic analyses of speech.
The concept of relating acoustic analyses to behavioral data is not new. For example, Dubno and Levitt 74 comprehensively described the relationship between consonant confusions and specific acoustic cues, such as spectral peak frequency, consonant duration, or formant transitions. The new techniques and equipment allow for analysis of amplified speech processed through wearable hearing aids. The simplicity and speed of these systems makes it likely that such measures can be implemented in the clinic and used to understand the effects of complex signal-processing strategies.
Linking Acoustic Analysis and Behavioral Data
In one of the first studies to link acoustic analysis to subject's perception of speech sounds, Stelmachowicz et al 75 fitted 3 adolescent listeners with moderate sensorineural hearing loss with a linear and a single-channel wide-dynamic range compression (WDRC) hearing aid. A series of consonant-vowel and vowel-consonant nonsense syllables was recorded at the output of each hearing aid, using a probe microphone system. Acoustic analyses included consonant and vowel audibility as determined by one-third octave band levels and a more qualitative description based on the temporal waveform. The same series of nonsense syllables was used to measure speech recognition.
Results highlight a number of interesting effects, some expected and some unexpected: (1) the high-frequency roll-off of the hearing aid response limited high-frequency consonant cues relative to the unprocessed signals; (2) the low-frequency roll-off of the hearing aid response essentially removed the first formant of the vowel, which contributes to vowel identification and also to voice-onset time; (3) at high input levels, the periodic temporal structure of the vowel was removed because of saturation effects of a linear peak clipping aid; (4) the linear peak clipping aid also obscured the fricative-voicing boundary; (5) with nonlinear (WDRC) amplification, the amplitude difference between the low-intensity consonant burst and high-intensity vowel decreased, although the magnitude was less than dictated by the nominal compression ratio of the hearing aid.
The Stelmachowicz et al 75 study demonstrates that the hearing aid may not adequately preserve key spectral and temporal features of the speech signal. Of course, these need to be considered in combination with the auditory abilities of the listener. Such changes may be irrelevant if they are redundant with other, more accessible cues or if the listener was unable to access even the undistorted sound because of insufficient sensitivity in that area of the cochlea. Nonetheless, the implication of these data is that deficits in intelligibility previously attributed to impaired auditory coding may be due in part to alterations of acoustic cues by the hearing aid.
Souza and Tremblay 3 and Souza et al 76 used a similar acoustic recording technique to relate consonant recognition to acoustic aspects of amplified speech in typical hearing aid wearers (adults with sloping mild-to-moderately severe symmetrical sensorineural hearing loss and 6 months or more of full-time hearing aid experience). Listener thresholds were measured and expressed as dB SPL at the tympanic membrane. Speech materials were 22 consonant-vowel nonsense syllables, presented in sound field at a conversational level (70 dB SPL) and distance (1 m). Each subject was monaurally fitted in the right ear with a programmable (linear with output compression limiting) hearing aid, with hearing aid response adjusted to meet individual National Acoustic Laboratory–Revised (NAL-R) 34 prescriptive targets. In-the-ear recordings of the nonsense syllable tokens were made at the output of each hearing aid using the ER-7C probe microphone system, with the probe tube extended 5 mm beyond the medial tip of each subject's earmold. Subjects were instructed to minimize body movements while the acoustic recordings were made. The amplified stimuli were low-pass filtered (10 kHz cutoff), digitized (44.1 kHz sampling rate), and recorded onto the hard drive of a computer for later analysis. A calibration tone preceded all speech recordings and was used to determine actual dB SPL levels. Three repetitions of each nonsense syllable token were recorded for each subject, totaling 66 recorded /CV/ nonsense syllable tokens per subject. This allowed us to compare the 3 tokens for consistency and also avoid the occasional token recorded with a click or distortion due to unexpected body movement, coughing, etc. Subjects completed a recognition test using the same stimuli. In addition to analysis of speech audibility 76 and overall error patterns, a primary question of interest was whether acoustic modifications by the hearing aid to essential spectral or temporal cues could explain specific errors.
When the presented sound was a stop consonant, listeners primarily made place errors (eg, /p/ for /t/; /g/ for /d/). Recall that for voiceless stops in initial position, the primary code to place distinction is the spectrum of the burst.24,25,77 The consonant-vowel transition is also important but less so for listeners with hearing loss than for those with normal hearing.78,79 Therefore, we might hypothesize that place errors could be introduced if the hearing aid altered the spectral content of the burst. As one example, the top panel of Figure 11 shows the time waveform (inset) and frequency spectrum of a 20-millisecond segment of the burst for the unprocessed syllable /ki/. The most prominent spectral feature is a peak at 3551 Hz. Data for the same sound recorded in the subject's ear at the output of the hearing aid are shown in the center panel. Note the large peak at 5648 Hz. For this listener, /ki/ was consistently misidentified as /ti/. The unprocessed spectrum for /ti/ (lower panel) shows a prominent peak in the same frequency region as seen for the amplified syllable /ki/. That is, the amplified /ki/ looks more like /ti/ with respect to its burst spectrum and was consistently identified as /ti/ by this listener.

Frequency spectra and time waveform (inset) for unprocessed /ki/ (top), amplified, recorded in-ear at the output of the listener's hearing aid /ki/ (center), and unprocessed /ti/. The subject misidentified this as /ti/.
When the input to the hearing aid was a fricative or affricate consonant, listeners made manner errors, confusing fricatives, stops and affricates. Distinguishing fricatives from affricates or affricates from stops is generally considered to be a temporal distinction and related to the rise-time and/or duration of the frication noise. 80 The top panel of Figure 12 shows the unprocessed (input) time waveform for the affricate-vowel syllable /3i/ (zhee). The middle panel shows the same signal, recorded in the subject's ear at the output of the hearing aid. In comparison to the input signal, the amplified version shows a large amplitude spike close to the onset of the consonant (identified by the arrow). The unprocessed /d3i/ (dgee) is shown for comparison in the lower panel. Recall that fricatives and affricates are distinguished in part by the rise-time of the phoneme, with shorter rise-times for affricates. That is, the amplified /3i/ looks more like /d3i/ and is identified as such; this listener consistently misidentified the presented consonant as the affricate /d3i/.

Acoustic recordings of Top: /3i/ (“zhee”), unprocessed (top panel); /3i/ (“zhee”), recorded in the ear canal of a single subject (center panel); and /d3i/ (“dgee”), unprocessed (lower panel). Note the overshoot in the consonant onset of the in-ear fricative recording, which is similar to the abrupt onset of the unprocessed affricate. The subject misidentified this syllable as the affricate /d3i/ (“dgee”).
The examples presented above explain only some of the consonant errors. In some instances, errors could be explained by insufficient audibility. In others, the critical cues appeared to be available at the output of the hearing aid in that the subject's errors were unexplained by acoustic recordings. It is for this reason we must consider additional stages of speech sound processing (eg, peripheral and central physiology) where breakdowns might be occurring. Nonetheless, these examples suggest that we should take into consideration the link between the hearing aid and the listeners’ response by measuring the signal actually received by the listener.
Stage 4: Integrity of the Auditory System
Even if all acoustic cues are preserved by the hearing aid, perception is still dependent on the integrity of the peripheral and central auditory system. The biological and perceptual consequences of peripheral pathology are well documented.81–84 Simply put, damaged hair cells and auditory nerve fibers result in elevated thresholds and broadened tuning curves. Collectively, these physiologic changes affect the way place and timing cues are encoded throughout the auditory system. In addition to hearing aid processing, damaged mechanisms in the peripheral auditory system introduce another source of “distortion” that modifies the signal before it reaches the brain. For this reason, it is important to understand how impaired auditory mechanisms alter the transduction of sound. With this information it is possible to explore physiologic approaches to rehabilitation. For example, Sachs et al 85 describe how physiologic models of sensorineural hearing loss are being used by biomedical engineers to design new hearing aid speech processors. This is certainly a new direction of research that includes physiology as a variable in auditory rehabilitation.
It must be kept in mind, however, that sound transduction does not stop at the auditory nerve. Sound travels along many nerve fibers and through many nuclei before reaching the auditory cortex. Peripheral pathologies not only affect the way sound is coded in the periphery but also consequent auditory deprivation results in modified sensory maps, synaptic changes, and circuit alterations in the central auditory system. 86 This point is important because when a hearing aid is used to compensate for hearing loss, sound is being reintroduced to an altered central system. Therefore, successful rehabilitation of the hearing aid user depends on the manner in which the processed acoustic cues (delivered by the hearing aid) are encoded by the altered central auditory system.
The fact that most hearing aid users are advanced in age 1 introduces another variable into the equation. It is well documented that older adults, with or without hearing loss, experience more difficulty perceiving rapidly changing signals compared to their younger counterparts. Moreover, there is an abundance of evidence in the physiologic literature to suggest that the neural representation of sound is different for younger and older adults.87,88 For example, evoked neural response patterns are often delayed and degraded with increasing levels of stimulus complexity and rate in older individuals.89,90 Higher level functions, important for complex sound perception (especially in competing noise) are also degraded with advancing age.91,92 Collectively, physiologic changes that occur with advancing age likely contribute to performance variability among hearing aid users as well.
Stage 5: Using Physiologic Measures to Assess Coding of Acoustic Cues by the Listener's Auditory System
How then can one assess how well sound is being processed throughout the auditory system and whether specific cues are being relayed from the periphery to central auditory cortices? In animals, single- and multiple-unit recordings can be made. In humans, a less invasive method is needed. Numerous imaging techniques are available to assess the neural representation of sound in humans, but each has its strengths and weaknesses. A strength of functional imaging (eg, fMRI) is its spatial resolution. This tool provides exemplary information about where in the brain sound is being processed. Examining the neural representation of subtle temporal cues that distinguish 2 speech sounds, however, would be difficult.
Electroencephalography is a tool with exquisite temporal resolution but provides limited spatial information. Auditory evoked potentials are electrophysiologic measures that can be described as bioelectrical potentials that are time locked to an auditory event. They are represented as a waveform with positive (eg, P1) and negative (eg, N1) peaks (Figure 13). These peaks are then defined according to their polarity (positive [P] or negative [N]) as well as their amplitude and latency. Amplitude describes the strength of the response in microvolts. Latency describes the amount of time, in milliseconds, that it takes to generate the bioelectrical response following stimulus onset. Latency therefore is related to neural conduction time and site of excitation; in other words, the time it takes for the sound to travel through the peripheral auditory system to the place of excitation in the central auditory system. Consider the auditory brainstem response (ABR). The ABR is called a short latency (or early) response because the evoked neural pattern occurs quickly after stimulus presentation and reflects early stages of processing in the central auditory system. Within 10 milliseconds of presenting an auditory stimulus to the ear, activity from the eighth nerve through the lateral lemniscus and inferior colliculus is summed and recorded. The resultant pattern is a series of peaks (I–V) known as the ABR. Cortical AEPs generate evoked response patterns beyond 50 milliseconds in latency and represent neural activity in the auditory cortices as well as in association areas.93–95

Example of the cortical evoked P1-N1-P2 (also known as the P100, N100, P200) response.
Like hearing aid research, electrophysiology has a long-standing theoretical foundation. There are several publications that provide an overview of the underlying anatomical and physiologic mechanisms that contribute to each specific evoked response.96–100 More important, these publications outline the methods used to record different evoked responses and why it is important to understand how slight modifications in filter and amplifier settings affect the neural activity recorded. In addition, subject and stimulus factors influence the acquisition and interpretation of AEPs; therefore, clinicians and scientists need to be aware of these principles before using AEPs. For this reason, electrophysiologic recordings should not be regarded as a tool that can easily be added to an assessment battery. We are just beginning to understand the interaction between modifications made to the signal by the hearing aid and the effects of this signal processing on the evoked neural response.
Auditory Brainstem Response
Aided ABR recordings can be found in the literature.101–107 A focus of many of these studies was to determine aided thresholds by adjusting the hearing aid gain until the latency of wave V of the ABR fell within a desired latency range. The ability to compare unaided and aided ABR thresholds in clinical populations unable to provide behavioral thresholds could aid the audiologist doing the assessment. However, even though the ABR remains a widely accepted physiologic measure that is used to estimate unaided auditory thresholds, recording-aided ABRs proved to be problematic. Because clicks or tone bursts are very brief, they do not activate the hearing aid circuitry in a way that longer duration signals, such as speech, do. Furthermore, such brief stimuli can introduce distortion and artifact. Other potential confounding variables include stimulus rate and how compression characteristics of the hearing aid interact with the stimulus onset. 108 In digital hearing aids, for example, the delay characteristics of the digital processor might interfere with the onset response of the ABR. This is further complicated by the fact that the delay in digital hearing aids varies across frequency and across instruments.109–111 Even in normal-hearing unaided listeners, subtle manipulations in the rise time or presentation rate of the stimulus used to evoke the ABR can greatly alter the evoked response pattern. 97 It is for these reasons that conventional click or tone evoked ABR recordings have not been used to assess aided thresholds in the clinic. That being said, efforts are being made to find other ways of assessing aided brainstem activity. Using longer duration amplitude modulated tones, Picton and colleagues 112 are exploring methods to use steady-state responses to estimate aided and unaided thresholds in people with hearing loss.
Cortical Evoked Potentials
Cortical AEPs are generated 50 to 80 milliseconds after stimulus onset and represent neural activity in the auditory cortex.93–95 They show the greatest potential for assessing hearing aid–amplified speech because (1) they can be elicited in response to longer speech stimuli, and (2) they represent the neural detection of sound at the highest level of the auditory system. Although there are many different types of auditory evoked cortical potentials (eg, MMN, P300, N400), many are difficult to quantify in individuals and require off-line averaging techniques that limit their use in the typical audiology clinic. It is for this reason we focus on the P1-N1-P2 response. Like the ABR, it can be recorded in individuals in a brief period of time using commercially available recording systems.
The P1-N1-P2 complex consists of a positive peak (P1) followed by a negative peak (N1), and a second positive peak (P2) (Figure 13). The P1-N1-P2 complex is thought to originate from the auditory cortex; specifically, from the thalamic-cortical portion of the system.95,98,113 The N1 is the best-described of the 3 peaks and is thought to be a response to stimulus onset, signaling the neural detection of an acoustic change (from silence to sound). Although traditionally recorded in response to static signals, such as clicks or tones, current research trends include the neural representation of speech sounds. Like the ABR, the P1-N1-P2 complex is sensitive to various stimulus parameters. For example, as stimulus intensity increases, the latency of the response decreases and the amplitude increases. Stimulus frequency also affects the response, with higher amplitude responses to low-frequency stimuli. 98 Because the response is sensitive to small changes in frequency and intensity,114,115 it has been used extensively to assess the neural detection of sound as well as estimate auditory thresholds. 98 Like the ABR, the presence or absence of the P1-N1-P2 response shows good agreement with behavioral thresholds. It is therefore logical to ask if the P1-N1-P2 response could be used to estimate aided thresholds as well as suprathreshold perception. If so, it would be possible to use this measure to determine whether adequate amplification was being provided to an individual and whether the amplified signal was reaching the cortex.
Unaided and aided P1-N1-P2 comparisons have been described in children with varying degrees of hearing loss.116–118 Without amplification, the evoked neural response pattern is typically delayed or absent. With amplification, a neural response pattern typical of that seen in normal-hearing children is evoked (ie, a P1 response, followed by a prominent negativity [N200–250]). However, results have not always been consistent. For example Rapin and Grazianni 117 reported that only five of eight 5- to 24-month-old subjects with severe-to-profound sensorineural hearing loss showed improved aided responses when compared to their unaided responses. One possible explanation for conflicting results may be the functional status of the hearing aid(s). Because little information about the hearing aid was provided, it is difficult to determine why responses might be absent in some aided conditions.
More recently, Korczak et al 119 successfully recorded P1-N1-P2 responses in unaided and aided conditions from 14 adults wearing their own (monaural or binaural) hearing aids. Test stimuli were the syllables /ba/ and /da/, presented at moderate (65 dB peak equivalent dB SPL [peSPL]) and high (80 dB peSPL) levels in sound field. Wearing hearing aids resulted in shorter latencies and larger amplitudes relative to the unaided condition. Listeners with more hearing loss showed a more dramatic change in AEP characteristics with amplification. And indeed, as might be expected if the stimulus is inaudible in the unaided condition, evoked responses were absent in unaided conditions and present (in some cases) with amplification. Although the Korczak et al study 119 nicely confirms that use of hearing aids can alter the P1-N1-P2, a number of questions remain. Electroacoustic tests were used to confirm adequate hearing aid function; however, some of the aids may have provided suboptimal responses, either because the listener selected a presentation level that was comfortable but was too low for consonant audibility or because the severity of hearing loss limited the ability to provide gain (9 of 14 listeners wore linear hearing aids). The match between the obtained hearing aid gain and the prescribed target was reported only for the 1 to 2 kHz range. Even within that minimal criterion, only 3 of the binaurally aided listeners were within 5 dB of target gain in both ears. An additional subject was within 5 dB of target gain in his monaurally aided ear. In 7 of the 10 remaining listeners, gain in at least 1 ear differed from the prescribed gain by more than 10 dB, usually lower than prescribed, and well outside the acceptable range suggested by Mueller 40 and Dillon. 38 In 8 of the 14 listeners, the aided Speech Intelligibility Index (SII) 120 was 50% or less. Although this is consistent with work showing that adults typically choose a volume control setting that provides less gain than prescribed, 121 it also makes it difficult to determine how much of the evoked potential effects were due to the listener's hearing loss, how much was attributed to the hearing aid, and how much resulted from signal inaudibility. Such problems could be addressed by combining the acoustic measurements of speech described in stages 1 through 3 of this review with physiologic measures.
There is evidence that advanced age and hearing loss affect the way sound is processed in the brain and thus also affect the P1-N1-P2 complex.89,90,122 To better understand the effects of amplification on the central auditory system while excluding the effects of aging and hearing loss, Tremblay et al 123 compared unaided and aided responses in younger listeners with normal hearing. Two questions were asked: first, can naturally produced speech sounds be used to reliably record P1-N1-P2 responses in individuals wearing hearing aids; and second, does amplification alter neural response patterns?
To answer these questions, cortical evoked potentials were recorded in sound field in response to the naturally produced speech token /si/ (as in the word see) from the Nonsense Syllable Test. 124 Participants wore binaural behind-the-ear hearing aids with stock foam-tip ear molds. All of the listeners were fitted with the same response: 6 dB per octave high-frequency emphasis, 20 dB peak gain, linear amplification with output compression limiting, and an omnidirectional microphone. In both aided and unaided conditions, stimuli were presented in sound field at a level of 64 dB peSPL. As an additional control, gain was verified for the aided condition using coupler measurements. Using a repeated measures design, subjects were tested and then retested within an 8-day period under both aided and unaided conditions.
Test-retest reliability, in both unaided and aided conditions, was remarkably good. Figure 14 shows test-retest reliability in the aided condition for a group of listeners as well as a representative individual (s1). These results confirm that sound presented in sound field and processed through a hearing aid can evoke reliable P1-N1-P2 responses in individuals. Not only is the repeatability visibly obvious, but also the intraclass correlation (a correlation that accounts for both amplitude and latency values across the entire waveform) is high (.88). This is reassuring, particularly given the multiple sources of variance, such as head movement relative to the loudspeaker. Similar reliability ought to be achievable in a clinical setting.

Two overlapping P1-N1-P2 responses can be seen in response to the naturally produced speech token /si/: The first signals the neural detection of the onset of the consonant; the second represents the consonant-vowel transition. Test-retest aided grand mean waveforms (n = 7; top) as well as from an individual subject (bottom) for initial (thick) and retest (thin) conditions are shown. The intraclass correlation for this particular individual, which takes into account latency and amplitude values for each of the test and retest measures, is good (.88) Reprinted with permission from Tremblay KL, Billings CJ, Friesen LM, Souza PE. Neural representation of amplified speech sounds. Ear Hear. 2006; 27: 93–103.
Surprisingly, however, there was no difference between the evoked responses in the aided versus unaided conditions (Figure 15). This finding was unexpected because in normal-hearing individuals it is well established that increases in intensity level (as small as 2–3 dB when provided by an audiometer or computer) result in significant waveform changes.115,125–128 Therefore, with increased stimulus intensity levels (provided by the hearing aid), we expected aided-evoked neural responses to be larger in amplitude and shorter in latency than the unaided recordings. But this was not the case, and the absence of an amplification effect has since been replicated in a second hearing aid study using 1 kHz tones instead of a speech sound. 129

Grand mean waveforms (n = 7) of unaided (thick) and aided (thin) conditions for the syllable /si/. No significant latency or amplitude differences were found when comparing aided and unaided conditions. Reprinted with permission from Tremblay KL, Billings CJ, Friesen LM, Souza PE. Neural representation of amplified speech sounds. Ear Hear. 2006; 27: 93–103.
The fact that we did not observe these expected patterns of change suggests that long-standing principles underlying electrophysiologic recordings, which are based on unaided recordings, do not apply when sound is processed and then delivered to the auditory system through a hearing aid. We therefore need to be cautious and not assume that our interpretation of latency and amplitude patterns recorded in aided and unaided conditions reflect similar neural properties. Presumably, some sort of interaction occurs between the way sound is processed by the hearing aid and encoded in the auditory system, and it is necessary to understand this interaction before aided evoked recordings can be interpreted.
One approach to understanding aided evoked potentials is to consider the hearing aid as a source of additional variables. For example, clinicians and scientists are trained to recognize how stimulus parameters such as rise-time, duration, rate, and presentation level affect ABR recordings. This is because the physical characteristics of the stimulus greatly affect the morphology (latency and amplitude) of the evoked response. The same principles apply to cortical evoked potentials, and this point is especially important to consider when sound is presented and processed through a hearing aid. Hearing aids modify the physical characteristics of sound; they introduce noise, compress signals, and alter the frequency content of the signal. So when evoked potentials are recorded using sound that is delivered through a hearing aid, the effects of hearing aid processing on the physical characteristics of the sound likely affect the evoked neural response pattern.
With this point in mind, we presume that the hearing aid used in the study by Tremblay et al 123 altered the signal in a way that interfered with the physiologic detection of the intensity change. Although we verified (using coupler measurements) that the prescribed amount of gain was provided by the hearing aid, we did not record the output of the hearing aid in each individual's ear canal. Therefore, we cannot say for certain how the signal was altered in each individual ear. However, because of the unexpected findings, we now recommend and have since added acoustic recordings (stage 3) to our evoked potential studies. 130 Based on our preliminary findings, we speculate that one possible explanation for not seeing an amplification effect is that the hearing aid introduced additional noise into the system, and thus the signal-to-noise ratios (SNRs) were maintained across unaided and aided conditions. Because central auditory system neurons are sensitive to SNR as well as absolute intensity, 20 dB of gain, provided by a hearing aid, might not evoke the expected changes in neural processing. 129 This explanation might also explain some of the inconsistent findings cited earlier, where aided evoked potentials were recorded in people with hearing loss. Depending on the degree and configuration of the hearing loss, the noise may be more or less audible for a particular individual.
The fact that there appears to be some interaction between the way in which the brain responds to signal modifications introduced by the hearing aid could be perceived as a negative confound, as was seen decades ago in the aided ABR literature, or a positive opportunity. For example, it might be possible to capitalize on the sensitivity of cortical evoked potentials (such as the P1-N1-P2) to estimate the neural detection of different speech sounds in hearing impaired children using hearing aids. The research group at National Acoustic Laboratories 131 has recently begun to study the use of cortical AEPs in infants who wear hearing aids. On a positive note, this assessment technique could be tremendously helpful to audiologists fitting aids on pediatric populations. However, the data from Tremblay et al 123 suggest that we also must take a step back and take into consideration the effect of the hearing aid (stage 3). It is therefore the impression of these authors that future applications could be beneficial, provided the knowledge of stages 1 through 4 are taken into consideration when recording aided evoked potentials of any kind.
Stage 6: Identification of the Speech Sound by the Listener
Ultimately, the goal of amplification is improved speech recognition, and at that, hearing aids are fairly successful. Adequate audibility and the neural detection of sound does not automatically translate into a perceptual event. Decreased audibility and impaired neural transmission, however, can certainly contribute to impaired perception. From this perspective, appropriately selected and fitted amplification can substantially improve speech audibility and hence speech recognition for listeners with hearing loss. Even with hearing aids, however, listeners with hearing loss do not acquire complete information from the acoustic signal, at least not to the extent of the redundant information usually available to listeners with normal hearing. “Top-down” cognition plays an important role132,133 in filling in missed information. This is reflected in greater listening effort for those with hearing loss, even when the result is accurate perception.134–137
How, then, can we determine what amplification parameters will provide the maximum usable information? Modern hearing aids offer a wide range of adjustments, so many that they may be overwhelming to the clinician. Should we have short or long release times? Change the crossover frequencies or rely on the manufacturer's recommendation? Use a high compression ratio in the high frequencies or a low compression ratio in the low frequencies? Increasingly, the focus of amplification research is not to build a better hearing aid but to make the best use of available technology. Dianne Van Tasell138(p 240) wrote that “the crucial question is whether the distortion produced by the hearing aid ultimately proves helpful or harmful to the listener who is hearing impaired.” The techniques described here are a means to that end. By analyzing the acoustic content of the signal, considering the cues available to the listener at various levels in the auditory system, and relating this information to the gold standard of accurate speech understanding, we can make guided choices about optimal amplification parameters. Although many of the tools described here are in research use, their availability for clinical decision making is not out of reach. Clinical probe microphone systems already offer “real speech” measures in a convenient and time-efficient format. Work is underway in some laboratories112,119,123,131,139 to develop an electrophysiology procedure suitable for estimating aided physiologic responses in the clinic. Even though this work is at a very early stage and many issues remain to be resolved before electrophysiologic assessment of amplified speech can be effectively used in a clinical setting, such research directions show the strong interest in developing new clinical techniques. These and other tools have the potential to provide new information toward our ultimate goal: improved communication for our patients.
Conclusion
To summarize, perception is dependent on the acoustic stimulus, the way in which this signal is modified by a hearing aid, and the neural representation of frequency, timing, and intensity codes throughout the auditory system. Therefore, the success of a hearing aid user is partially dependent on the neural encoding of sound received by the hearing aid and the ability of an individual to make use of these cues.
The proposed model aims to broaden our perspective and diversify our attempts at improving hearing aid performance. By analyzing the acoustic content of the signal, characterizing the cues available to the listener at various levels in the auditory system, and relating this information to speech understanding, we can make guided choices about rehabilitation. To date, the focus of most research has been on the end points of this process, a standardized specification of the hearing aid's processing characteristics and speech recognition. Yet it remains difficult to determine whether inconsistent benefit from a hearing aid is a failure of the hearing aid to preserve acoustic information or to the listener's inability to process available information. By acknowledging other sources of performance variability and improving our techniques for characterizing their contribution to speech understanding, we hope to provide new information toward our ultimate goal: improved communication for our patients.
Footnotes
Acknowledgments
This work was supported by the National Institutes of Health grants R01DC006014 (PS) and R01DC007705 (KT) and by the University of Washington Royalty Research Fund. Portions of this work were presented at the following professional meetings: American Academy of Audiology, 2004; American Auditory Society, Scottsdale, Arizona, 2004, 2005; Association for Research in Otolaryngology, Baltimore, Maryland, 2006. The authors thank Curtis Billings, Marc Caldwell, Evelyn Davies-Venn, Lendra Friesen, Lorienne Jenstad, Laura Kalstein, and Kerry Witherell for their help in collecting and analyzing the data discussed here.