
Abstract
Introduction
Ultramarathons are growing considerably in both popularity and distance. This study aimed to identify factors associated with performance and satisfaction in ultramarathons of 200 mi (322 km) or more.
Methods
This cross-sectional study surveyed ultramarathoners who recently competed in a 200+ mi (322+ km) race between June and September 2023. The survey assessed demographics, ultramarathon experience, training habits, sleep-related factors, sleep-related adverse events, and injuries. Logistic regression quantified associations between variables and race outcomes.
Results
A total of 117 participants (67% male; mean age 47.2 y) completed the survey. Median race distance was 217 mi (interquartile range [IQR]=203–314 mi); 349 km [IQR=327–505 km]). Median sleep during races was 5.63 h (IQR=3.25–15.75 h). The most common within-race sleep strategy was sleeping when exhausted (38%). Finishing in the top quartile was associated with being male (odds ratio [OR]=3.37, more than 3fold higher odds than females), lower body mass index (OR=0.85, 15% lower odds per body mass index unit increase), and sleeping <7 h the night before (OR=0.33, 67% lower odds vs ≥7 h). Higher Pittsburgh Sleep Quality Index score (OR=0.70, 30% lower odds per point) and Insomnia Severity Index scores (OR=0.80, 20% lower odds per point) were associated with reduced likelihood of exceeding performance expectations. Weekly alcohol consumption, compared with monthly or less, was associated with lower race satisfaction (OR=0.42, 58% lower odds).
Conclusions
This study identified several factors associated with performance and satisfaction in 200+ mi (322+ km) ultramarathons, highlighting prerace and race sleep as key modifiable factors for optimizing performance.
Introduction
The popularity of ultramarathons, or any race that is longer than the traditional marathon distance of 26.2 mi (42.2 km), has been increasing steadily over the past decades. A report on ultrarunning in 2020 showed that the sport had grown in participants by 1676% from 1996 to 2018. 1 Furthermore, the distance of ultramarathons has been increasing; ultramarathons greater >360 km, or roughly 223 mi, have been increasing in number since 2017. 2 In 2018, there were 611,098 yearly participants in ultramarathon races. 1 The body of evidence surrounding ultramarathons also has been increasing with specific regard to ultramarathon-specific injuries, nutrition, and psychology; certain factors may be associated with performance and the ability to finish ultramarathon races, but this has been relatively less investigated.3,4
Sleep and Fatigue in Ultramarathons
Research has found that for ultramarathons <200 mi (322 km), forgoing sleep in exchange for continuous running is most common and beneficial for performance.5,6 However, for races of 200 mi (322 km) or more, sleep and sleep strategies are an integral aspect of the race.5–7 A study by Martin et al in 2018 found that the most prevalent sleep strategy was increasing opportunities for sleep in the days preceding the ultramarathon. 8 Another study by Miller et al in 2022 found that the average time to complete an ultramarathon of ≥200 mi (322 km) was 92.1±28.3 h and that the average amount of sleep per event was 4.14±3.8 h. 6 A separate study found that among 200-mi (322-km) ultramarathoners, the average amount of sleep per event was 4.7±3.0 h. 9 Sleep deprivation becomes increasingly common at these distances, with the most common adverse effect being visual hallucinations.6,7,9
Study Rationale
With ultramarathons becoming increasingly popular and race distances growing, increased emphasis on safety and how far the human body can be pushed is necessitated. Several studies have found that for races of around 200 mi (322 km), forgoing sleep becomes less beneficial for performance.5–7 Additional studies have found that at race distance of 100 mi (161 km) or less, variables such as low body weight, low body mass index (BMI), extensive previous race experience, a high running volume during training, and caffeine consumption have been associated with improved performance.10–15 Thus, with the increasing popularity and distances of ultramarathons, this begs the question of which factors might be associated with increased performance and satisfaction in ultramarathons of 200 mi (322 km) or more.
Objectives
The goal of this study was to describe demographic characteristics, lifestyle factors, race experience, and sleep-related factors of 200+ mi (322+ km) ultramarathon runners and identify factors associated with indicators of ultramarathon race performance and satisfaction. Additionally, we aimed to quantify the frequency of different sleep strategies used during ultramarathons and identify the most common sleep-related adverse events experienced during these races.
Methods
Study Design
An online survey was created in REDCap, a secure Health Insurance Portability and Accountability Act-compliant web-based application, 16 to collect information on demographic characteristics, lifestyle factors, race experience, and sleep-related factors of adults (≥18 y old) participating in a 200+ mi (322+ km) ultramarathon. Directors of ultramarathon races were contacted between June and September 2023 with a request to distribute a survey link via email to recent runners, who were asked to complete a survey after the race at their own discretion. Eligible races were chosen from the ultramarathon race hub UltraSignup.com. Consent was obtained at the start of each survey, and responses were downloaded and deidentified prior to analysis. The protocol for this cross-sectional survey study was reviewed by the University of Michigan Institutional Review Board’s Health Science and Behavioral Sciences section and was determined to be exempt from ongoing review (reference no.: HUM00237228).
Demographic Characteristics
Respondents were asked to provide information on their age (in years), biological sex at birth (ie, female, male, intersex, unknown, other, or prefer not to answer), race, ethnicity (Hispanic or Latino/a or not), height, and weight, which were used to calculate BMI. BMI was treated as a continuous variable in all analyses to maximize statistical power because most participants were classified as normal weight or overweight, and very few were underweight (see “Results” for category distribution).
Lifestyle Factors
Respondents were asked to report on their history of smoking cigarettes or use of other nicotine-containing products (response options: “Yes,” “A few times just to try,” or “No”), current alcohol consumption (“Never,” “Monthly or less,” “2–4 times a month,” “2–3 times a week,” or “4+ times a week”), and current caffeine consumption (“Never,” “Monthly or less,” “2–4 times a month,” “2–3 times a week,” “4+ times a week,” “Once a day,” or “More than once a day”).
Ultramarathon Experience
Questions covered number of years having participated in ultramarathons, the name of the race that their responses related to (henceforth referred to as the index race), whether the index race was the respondent's first 200+ mi (322+ km) ultramarathon (yes or no), whether the index race was finished, and the total distance ran (in miles). Respondents also were asked to rate how they finished both overall and in their age group for the index race to the nearest percent (response options: “Bottom 10%,” “Bottom 25%,” “Bottom 50%,” “Top 50%,” “Top 25%,” “top 10%,” “Did not finish,” or “Prefer not to disclose”). For the outcome of finishing in the top 25% overall, participants who selected “Top 25%” or “Top 10%” for their overall finishing position in the index race were classified as having met this outcome. They also were asked to rate where they had expected to finish in the index race and how they normally finish in ultramarathons, using the same response options. “Exceeding performance expectations” was defined as finishing in a higher percent bracket than the participant's self-reported expected finishing bracket for the index race. This variable was constructed by directly comparing each participant's reported expected and reported finishing brackets. Additionally, respondents were asked what their goal was for competing in the index race (response options: “To finish,” “To break a certain time barrier,” “To run as fast as I could,” “To win my age group,” “To win the race,” or “Other”), if they were injured during the index race (yes or no), caffeine consumption before and during the race, and level of satisfaction with race performance (5-point Likert scale from 0=very satisfied to 4=very dissatisfied). For analysis, responses were dichotomized such that “Very satisfied” and “Satisfied” were classified as satisfied vs all other responses.
Sleep-Related Factors
Respondents were asked to report on their sleep duration the night before the index race and total sleep duration during the race. Sleep quality the night before the index race and during the race was assessed using a 5-point Likert scale (0=very good to 4=very bad). Respondents were asked if they used a sleep strategy during the race and, if so, what type of strategy they used (see Tables 1 to 3 for response options). Respondents were asked if they experienced any sleep-related adverse events during the index race (yes or no). They also were asked to complete a single-item restless legs syndrome screener, the Pittsburgh Sleep Quality Index (PSQI; assesses sleep quality and disturbances over the past month), 17 the Epworth Sleepiness Scale (ESS; measures daytime sleepiness), 18 the STOP-Bang Questionnaire (aids in screening for obstructive sleep apnea), 19 and the Insomnia Severity Index (ISI; detects the presence and severity of insomnia). 20
Demographic Characteristics and Lifestyle Factors of Study Participants.
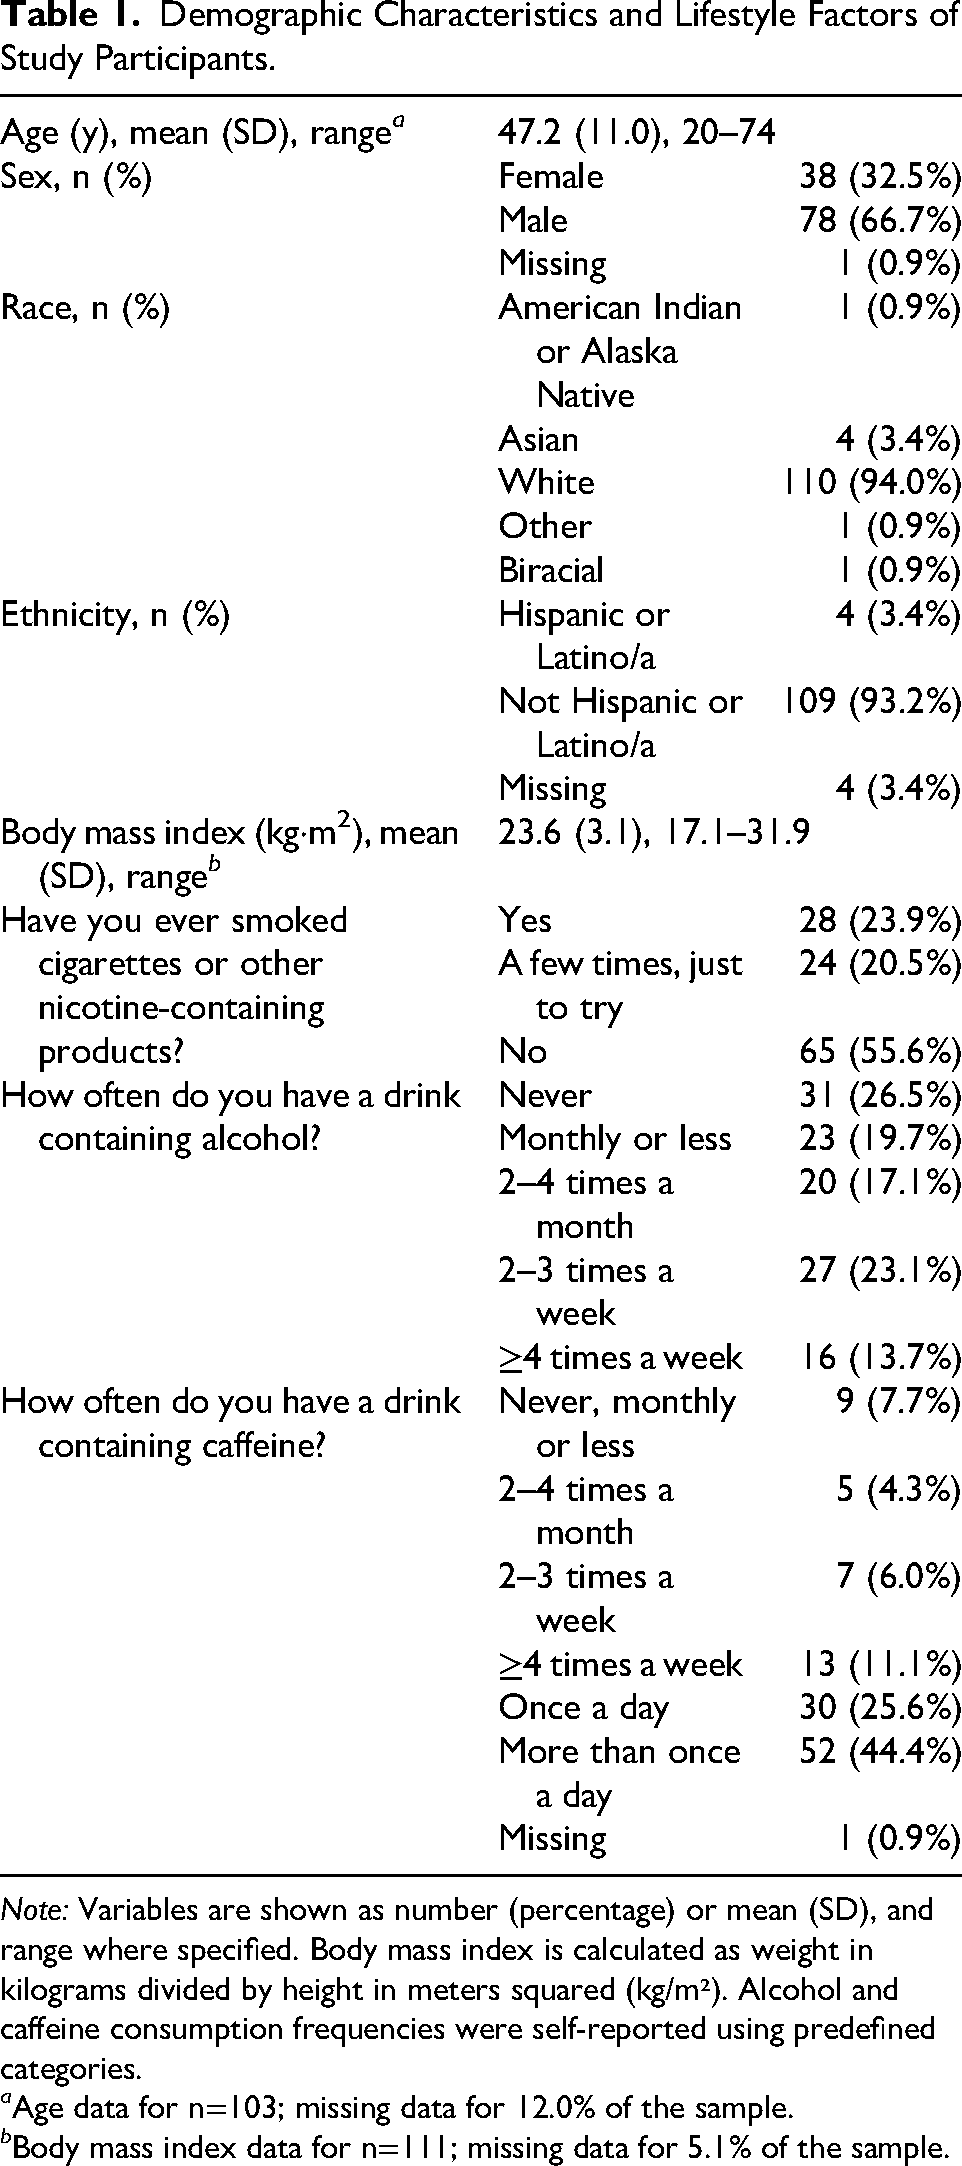
Note: Variables are shown as number (percentage) or mean (SD), and range where specified. Body mass index is calculated as weight in kilograms divided by height in meters squared (kg/m²). Alcohol and caffeine consumption frequencies were self-reported using predefined categories.
a Age data for n=103; missing data for 12.0% of the sample.
b Body mass index data for n=111; missing data for 5.1% of the sample.
Ultramarathon Experience of Study Participants.
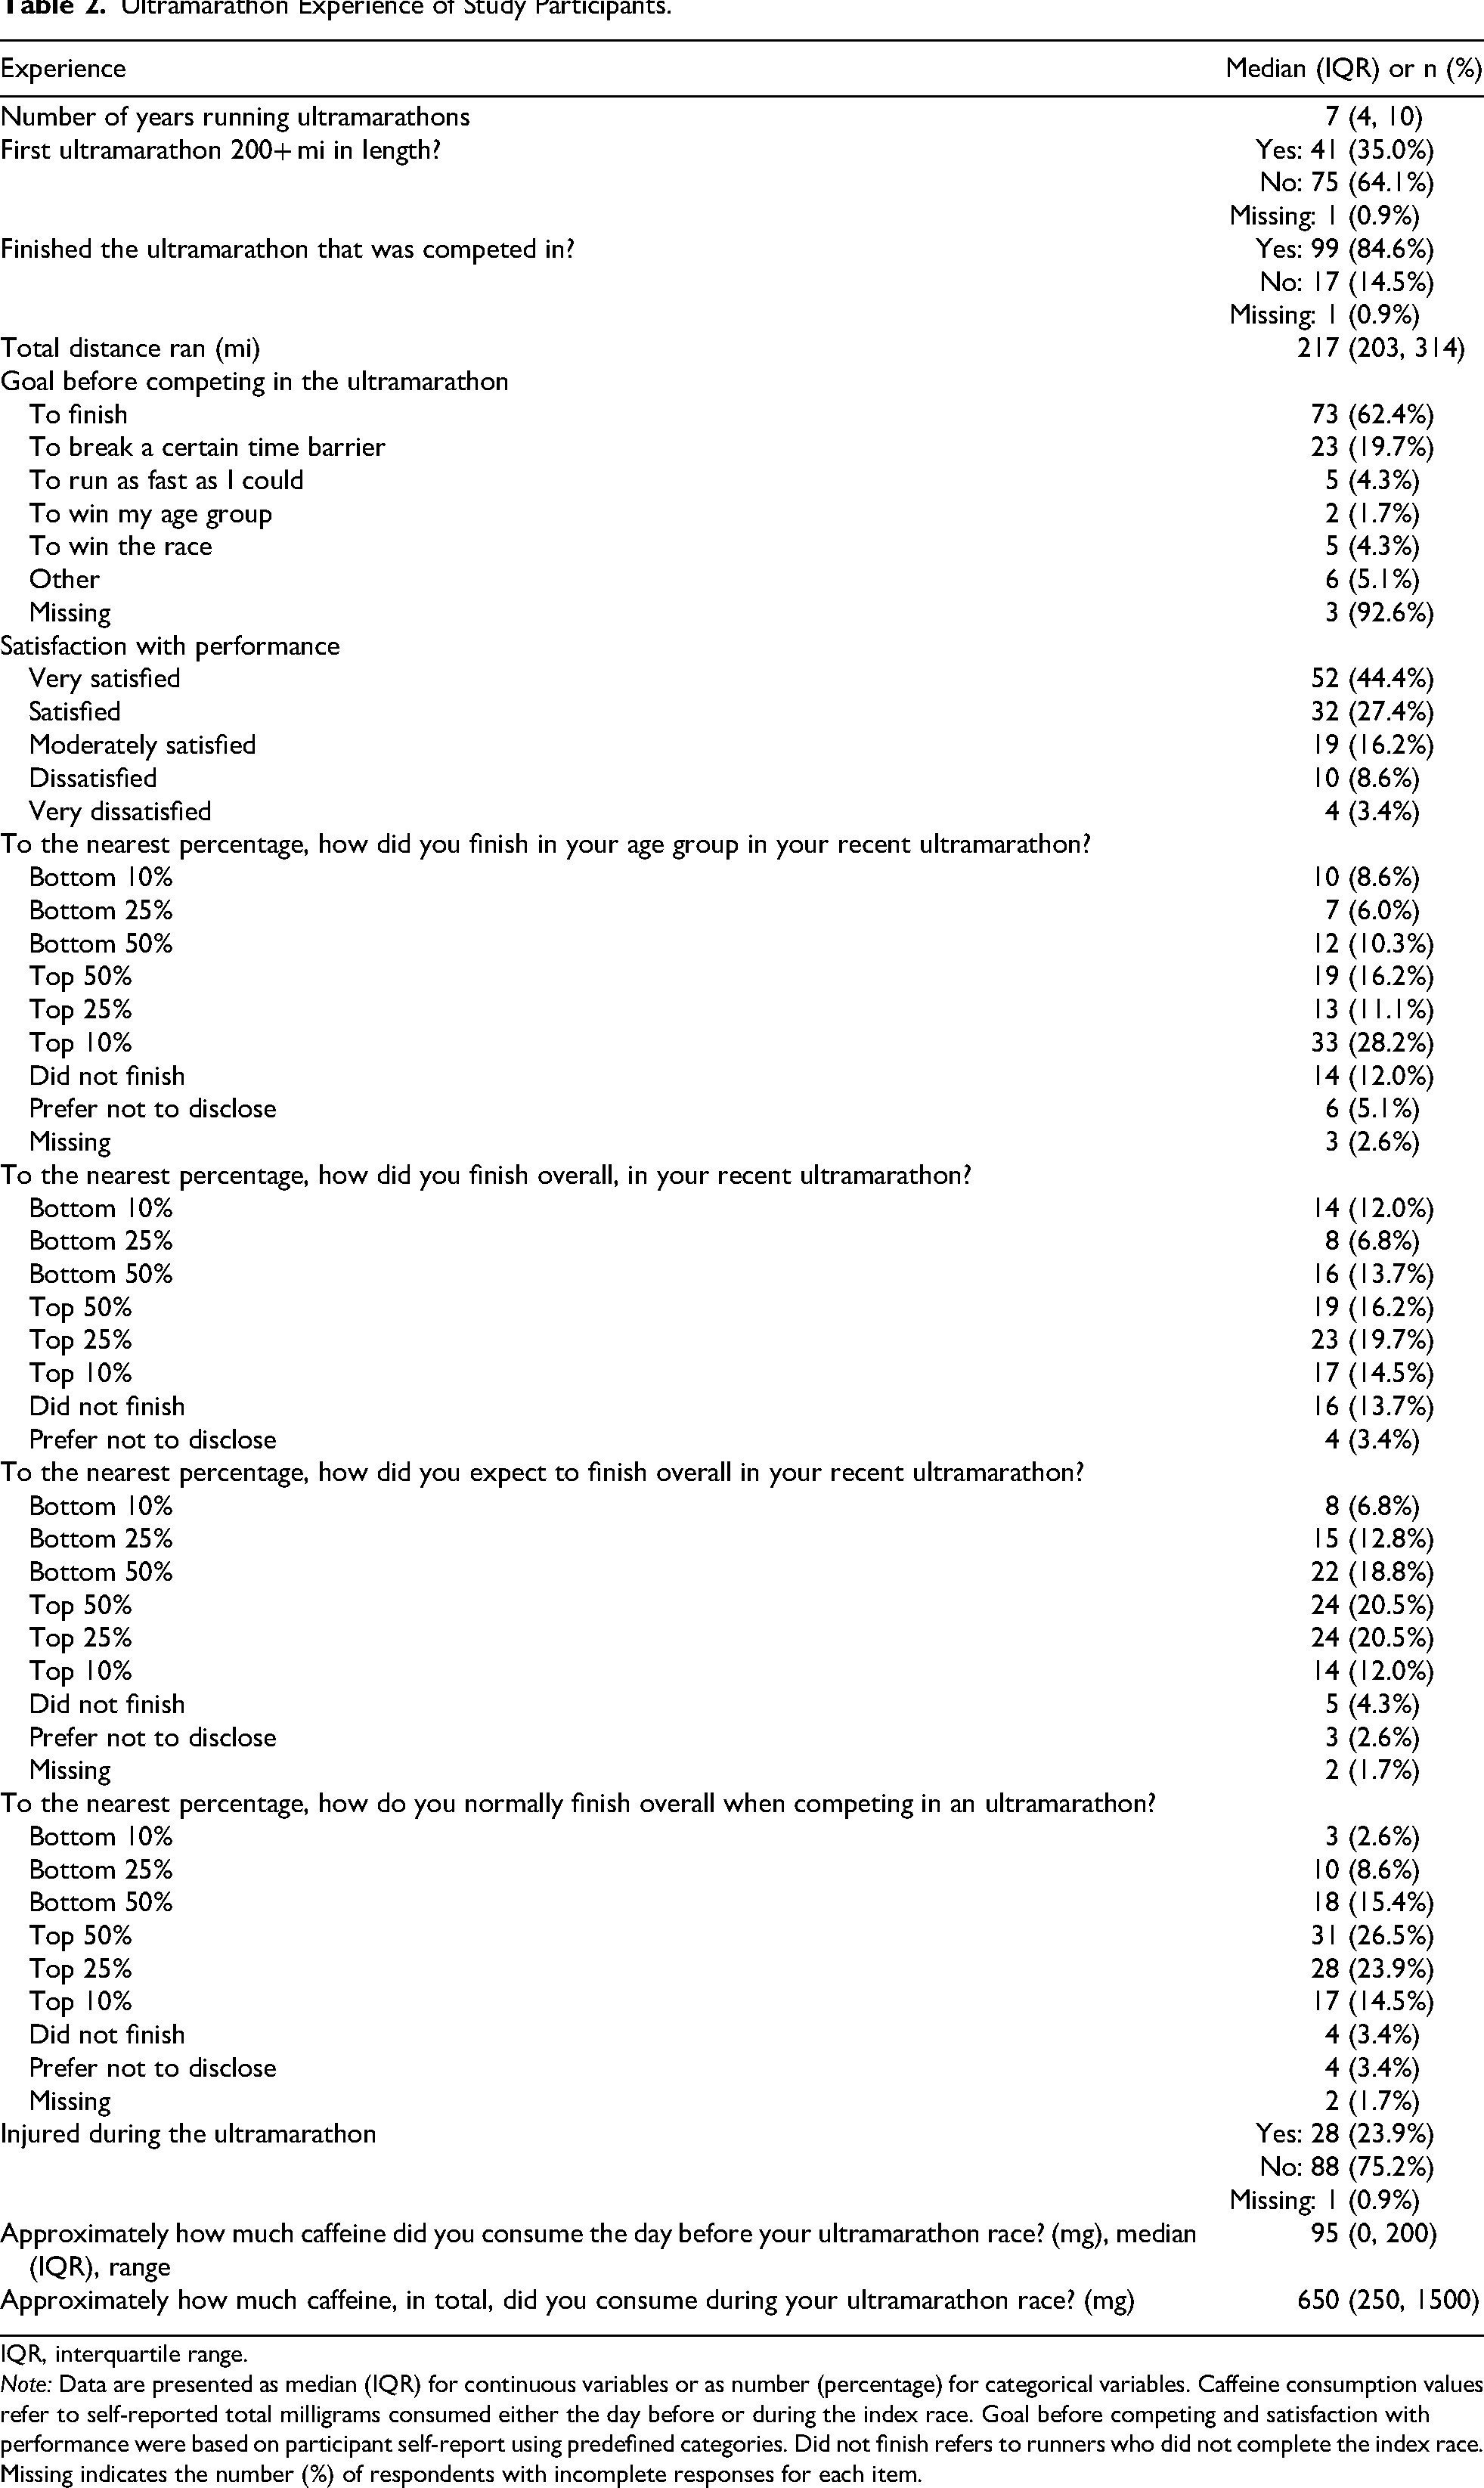
IQR, interquartile range.
Note: Data are presented as median (IQR) for continuous variables or as number (percentage) for categorical variables. Caffeine consumption values refer to self-reported total milligrams consumed either the day before or during the index race. Goal before competing and satisfaction with performance were based on participant self-report using predefined categories. Did not finish refers to runners who did not complete the index race. Missing indicates the number (%) of respondents with incomplete responses for each item.
Sleep-Related Factors.
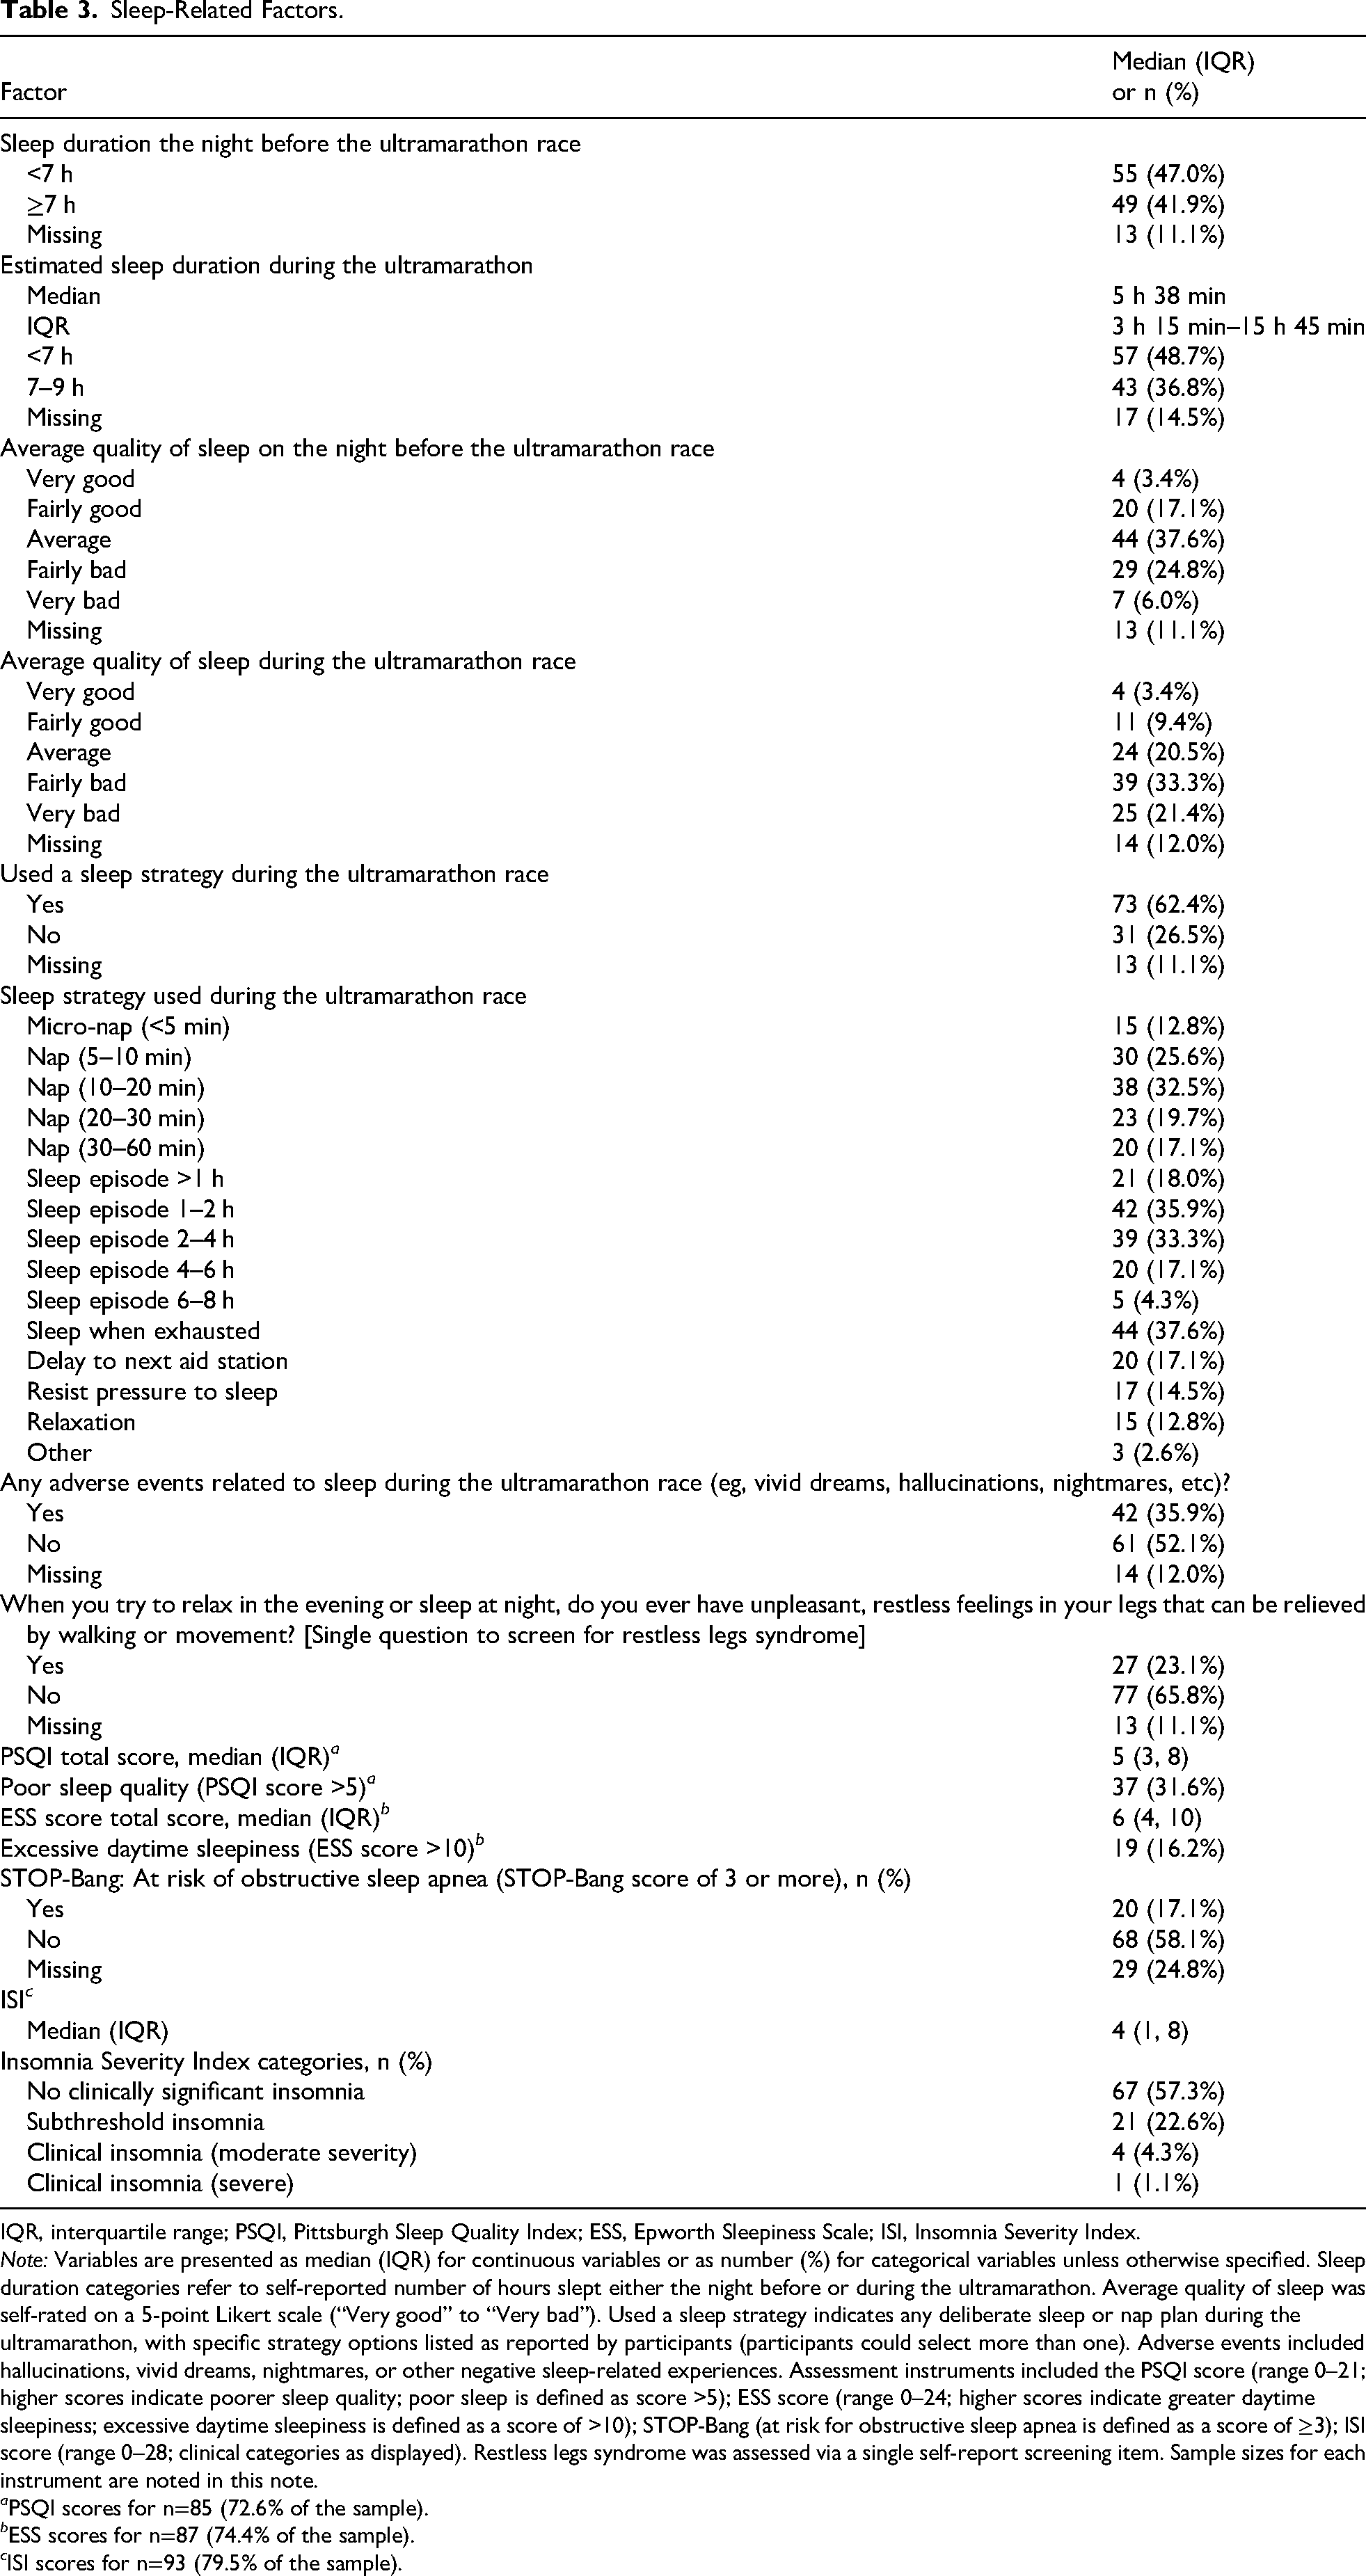
IQR, interquartile range; PSQI, Pittsburgh Sleep Quality Index; ESS, Epworth Sleepiness Scale; ISI, Insomnia Severity Index.
Note: Variables are presented as median (IQR) for continuous variables or as number (%) for categorical variables unless otherwise specified. Sleep duration categories refer to self-reported number of hours slept either the night before or during the ultramarathon. Average quality of sleep was self-rated on a 5-point Likert scale (“Very good” to “Very bad”). Used a sleep strategy indicates any deliberate sleep or nap plan during the ultramarathon, with specific strategy options listed as reported by participants (participants could select more than one). Adverse events included hallucinations, vivid dreams, nightmares, or other negative sleep-related experiences. Assessment instruments included the PSQI score (range 0–21; higher scores indicate poorer sleep quality; poor sleep is defined as score >5); ESS score (range 0–24; higher scores indicate greater daytime sleepiness; excessive daytime sleepiness is defined as a score of >10); STOP-Bang (at risk for obstructive sleep apnea is defined as a score of ≥3); ISI score (range 0–28; clinical categories as displayed). Restless legs syndrome was assessed via a single self-report screening item. Sample sizes for each instrument are noted in this note.
a PSQI scores for n=85 (72.6% of the sample).
b ESS scores for n=87 (74.4% of the sample).
c ISI scores for n=93 (79.5% of the sample).
Outcomes of interest were finishing in the top 25% overall, exceeding performance expectations (evaluated by finishing in a higher percent bracket than expected), and being satisfied or very satisfied with race performance (compared with moderately satisfied, dissatisfied, or very dissatisfied).
Data Analysis
Study variables were summarized descriptively. For continuous variables, means and standard deviations were reported when data were approximately normally distributed, whereas medians and interquartile ranges (IQRs) were reported for nonnormally distributed variables. Categorical variables were reported as number and proportion. Univariable logistic regression then was used to quantify associations between demographic characteristics, lifestyle, ultramarathon experience, and sleep-related factors and study outcomes of interest. Analyses were conducted using listwise deletion such that only complete cases were included for each model. A P value of ≤0.05 was used to determine statistical significance. All analyses were performed using Stata/IC, version 15.1 (StataCorp LLC, College Station, TX).
Results
Demographics and Lifestyle Factors
Of the 117 survey respondents, the mean age (SD) was 47.2 (11.0) y, with the youngest competitor being 20 y old and the oldest 74 y old. Demographic characteristics of the sample, including sex, race, and ethnicity are presented in Table 1. The mean BMI (SD) was 23.6 (3.1) kg·m2 (range, 17.1–31.9 kg·m2). Of the 117 respondents, 4 (3%) were classified as underweight (BMI<18.5 kg·m2), 75 (64%) as normal weight (BMI=18.5–24.9 kg·m2), 32 (27%) as overweight (BMI=25.0–29.9 kg·m2), and 6 (5%) as obese Class I (BMI=30.0–34.9 kg·m2). Most respondents (56%) had never smoked cigarettes or used nicotine-containing products. Of those who had, 96% did not smoke regularly or had quit smoking. Regarding alcohol consumption, 27% said that they had never drunk alcohol, 20% reported drinking monthly or less often, 17% reported drinking two to four times a month, 23% reported drinking two to three times a week, and 14% reported drinking four or more times a week. When asked about caffeine consumption, 8% reported never or rarely (monthly or less) drinking caffeine, 4% reported consuming caffeine two to four times a month, 6% reported consuming caffeine two to three times a week, 11% reported consuming caffeine four or more times a week, 26% reported consuming caffeine once a day, and 44% reported consuming caffeine more than once a day.
Ultramarathon Experience
Descriptive statistics summarizing respondents’ ultramarathon experience are presented in Table 2. The median (IQR) number of years participants had been running ultramarathons was 7 (4, 10), with a range of 0 to 33 y. Of survey respondents, 35% had never previously run an ultramarathon of 200 mi (322 km) or more. Respondents participated in a range of different races, including the Heart of the South Road Race (∼304 mi/547 km; n=23; 20%), the Vol State 500K Unaided (∼314 mi/500 km; n=23; 20%), the Bigfoot 200 Mile Endurance Run (∼206 mi/332 km; n=21; 18%), the Tahoe 200 Endurance Run (∼206 mi/332 km; n=19; 16%), the Vol State 500K Aided (∼314 mi/500 km; n=10; 9%), the Third Circle of Hell (370 mi/∼595 km; n=8; 7%), the Cowboy 200 (∼206 mi/332 km; n=7; 6%), and other unnamed races (n=6; 5%). These races took place in California, Georgia, Nebraska, Tennessee, and Washington. Races were run during the summer months, with runners exposed to extreme heat, remote conditions, and mountainous terrain. Eighty-five percent completed the ultramarathon, and the median (IQR) race distance was 217 (203, 314) mi (349 km; IQR=327–505 km). For most participants, their goal set before entering the race was to finish (62%), and most were either very satisfied (44%) or satisfied with their race performance (27%).
Sleep
Summary statistics for sleep-related variables are provided in Table 3. On the night before the race, 47% of responsents reported sleeping less than 7 h, with 31% reporting fairly bad or very bad sleep quality. During the ultramarathon, median (IQR) total sleep duration was 5 h 38 min (3 h 15 min–15 h 45 min), and 55% reporting fairly bad or very bad sleep. However, most respondents (62%) reported using a sleep strategy during the race, with the most frequently reported strategies being sleeping when exhausted (38%), sleeping 1 to 2 h per sleep episode (36%), or sleeping 2 to 4 h per sleep episode (33%). Twenty-three percent responded positively to the single-item screener for restless legs syndrome. The median (IQR) PSQI score was 5 (3, 8), with 32% of the sample categorized as poor sleepers (PSQI>5). The median (IQR) ESS score was 6 (4, 10), with 16% categorized as having excessive daytime sleepiness (ESS>10). Seventeen percent of respondents were screened as being at risk of obstructive sleep apnea (STOP-Bang score>3). Responses to the ISI indicated that 23% of the sample had subthreshold insomnia, 4% had moderate clinical insomnia, and 1% had severe clinical insomnia. Of the total sample, 36% reported experiencing a sleep-related adverse event during the race. Of these, 95% described some form of hallucination, almost all being visual in nature (eg, seeing people, animals, or objects that were not present), with 10% also reporting concurrent auditory hallucinatory experiences. The remaining responses described vivid dreams or altered perceptions that did not meet the threshold for hallucination.
Factors Associated with Race Performance and Satisfaction
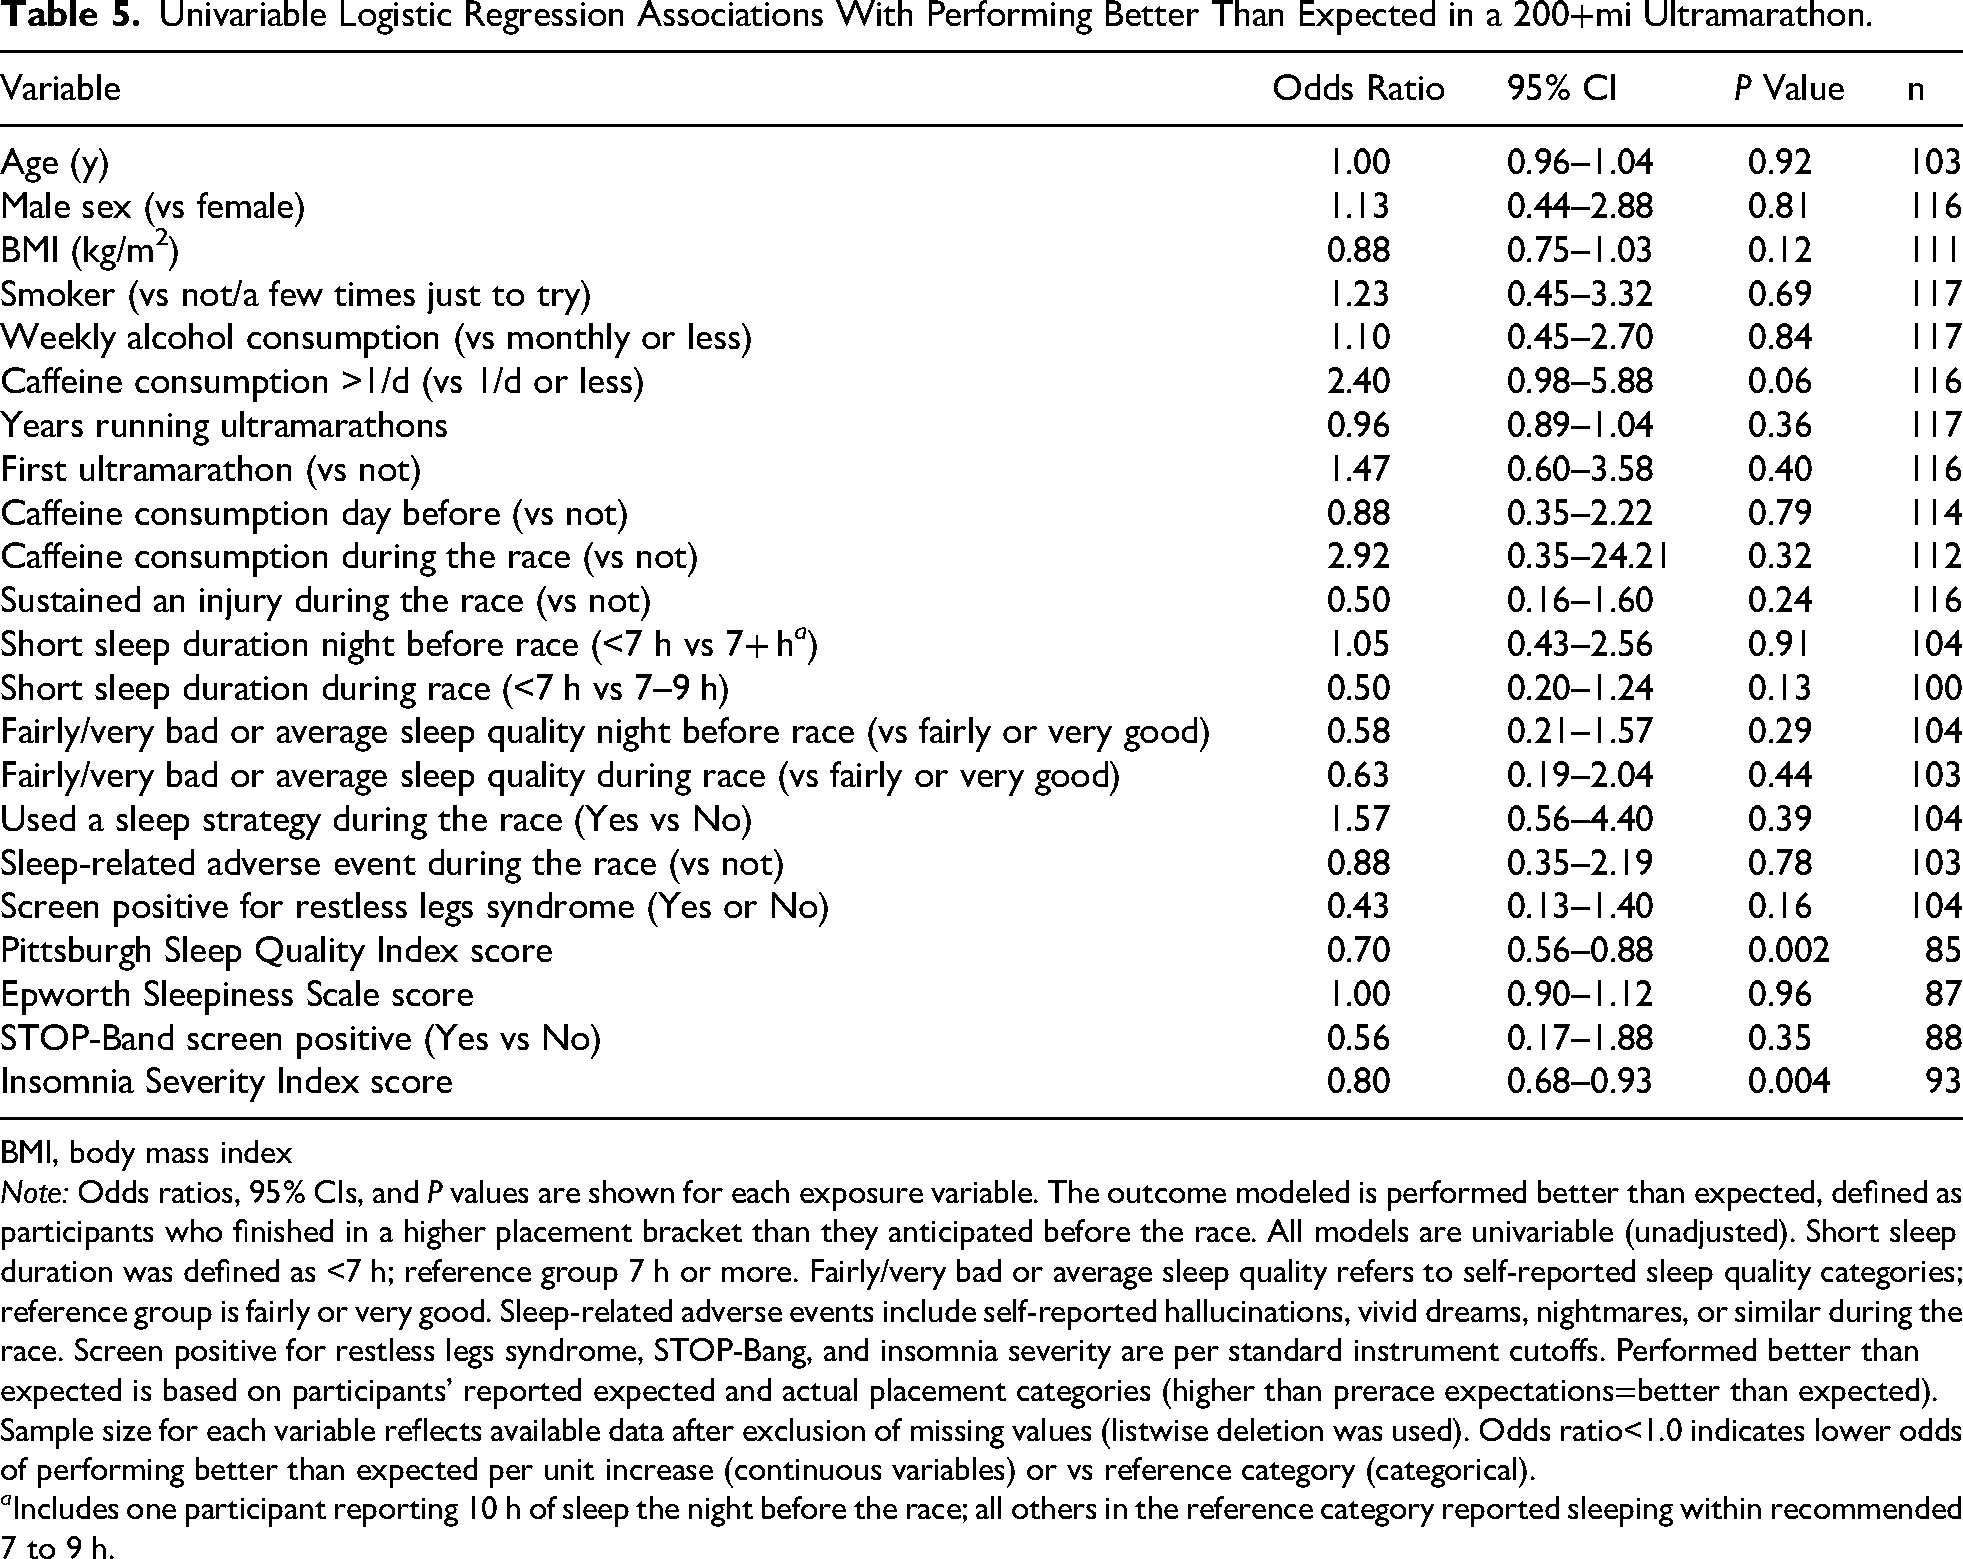
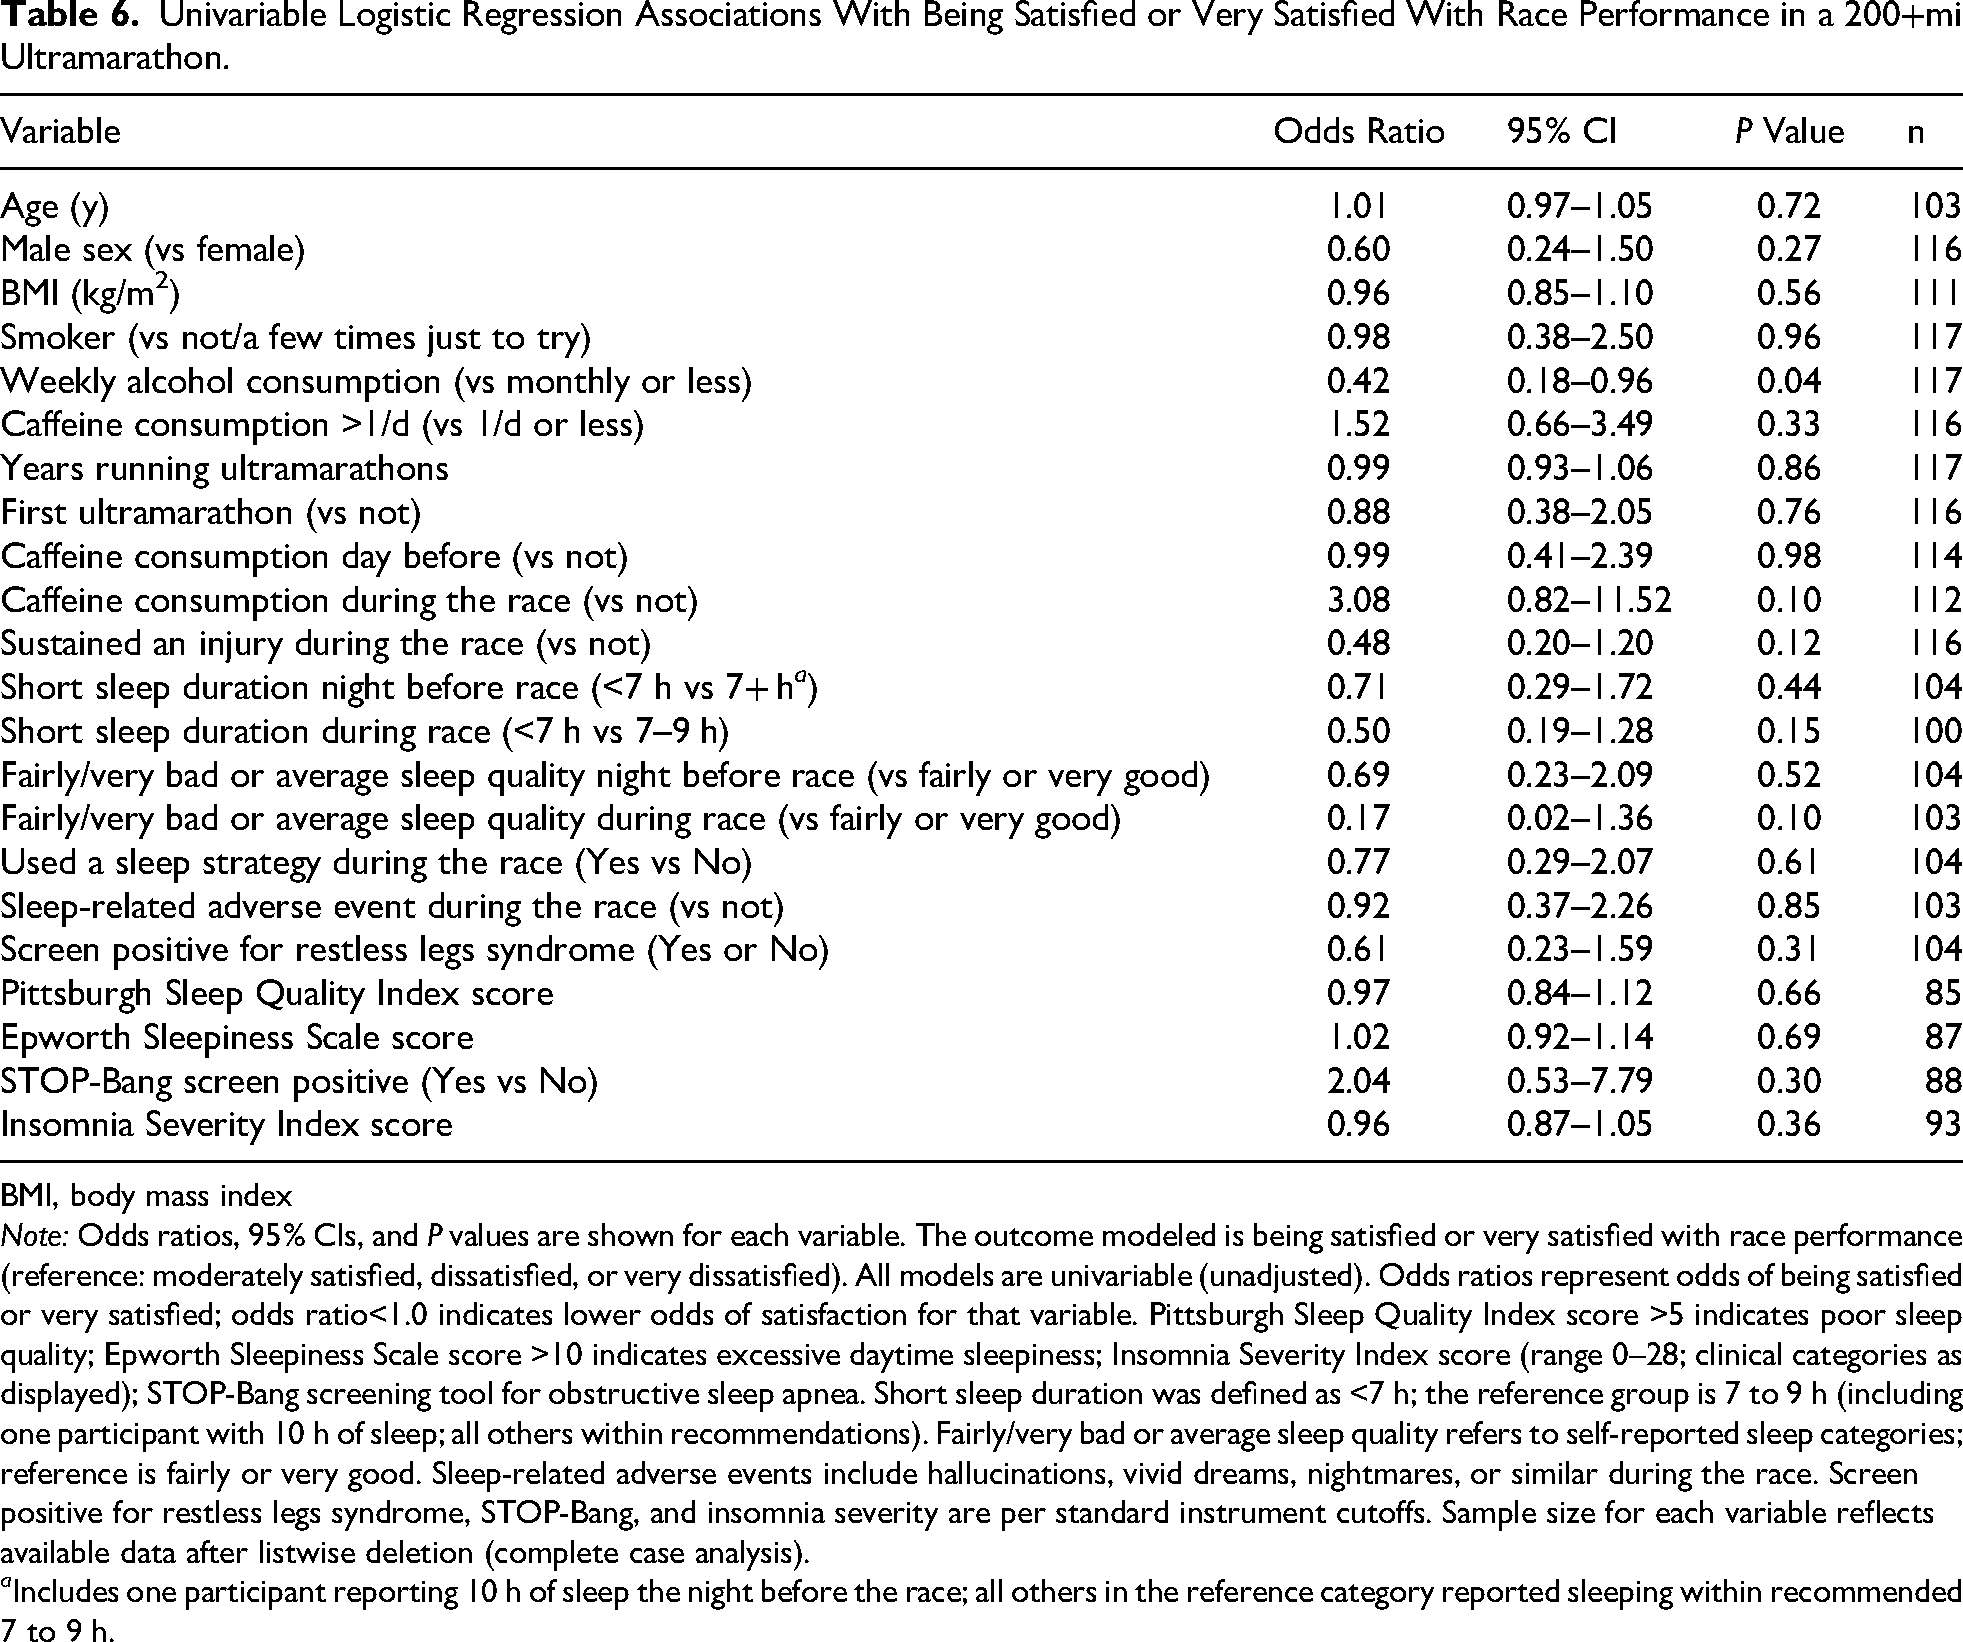
The associations between demographic characteristics, lifestyle, and ultramarathon- and sleep-related factors with race performance and satisfaction are presented in Tables 4 to 6. Factors significantly associated with finishing in the top 25% include being male (odds ratio [OR]=3.37, meaning males were more than 3 times as likely as females to finish in the top quartile), having a lower (continuous) BMI (OR=0.85; for each 1-unit increase in BMI, the odds of finishing in the top quartile decreased by 15%), and sleeping 7+ h on the night before the race compared with sleeping <7 h (OR=0.33; those sleeping <7 h had a 67% lower odds of finishing in the top quartile). The association with BMI was observed across the BMI distribution in our sample, the majority of whom were classified as normal weight or overweight; very few participants were in the underweight range (n=4; 3%). Indicators of poor sleep quality and insomnia were associated with a lower likelihood of performing better than expected: having a higher PSQI score and a higher ISI score. Only alcohol consumption was associated with race satisfaction, with weekly alcohol consumption (compared with monthly alcohol consumption or less) being associated with a lower odds of being satisfied or very satisfied with race performance (OR=0.42; 95% CI, 0.18–0.96; P=0.04; Table 6).
Univariable Logistic Regression Associations With Finishing in the top 25% Overall in a 200+mi Ultramarathon.
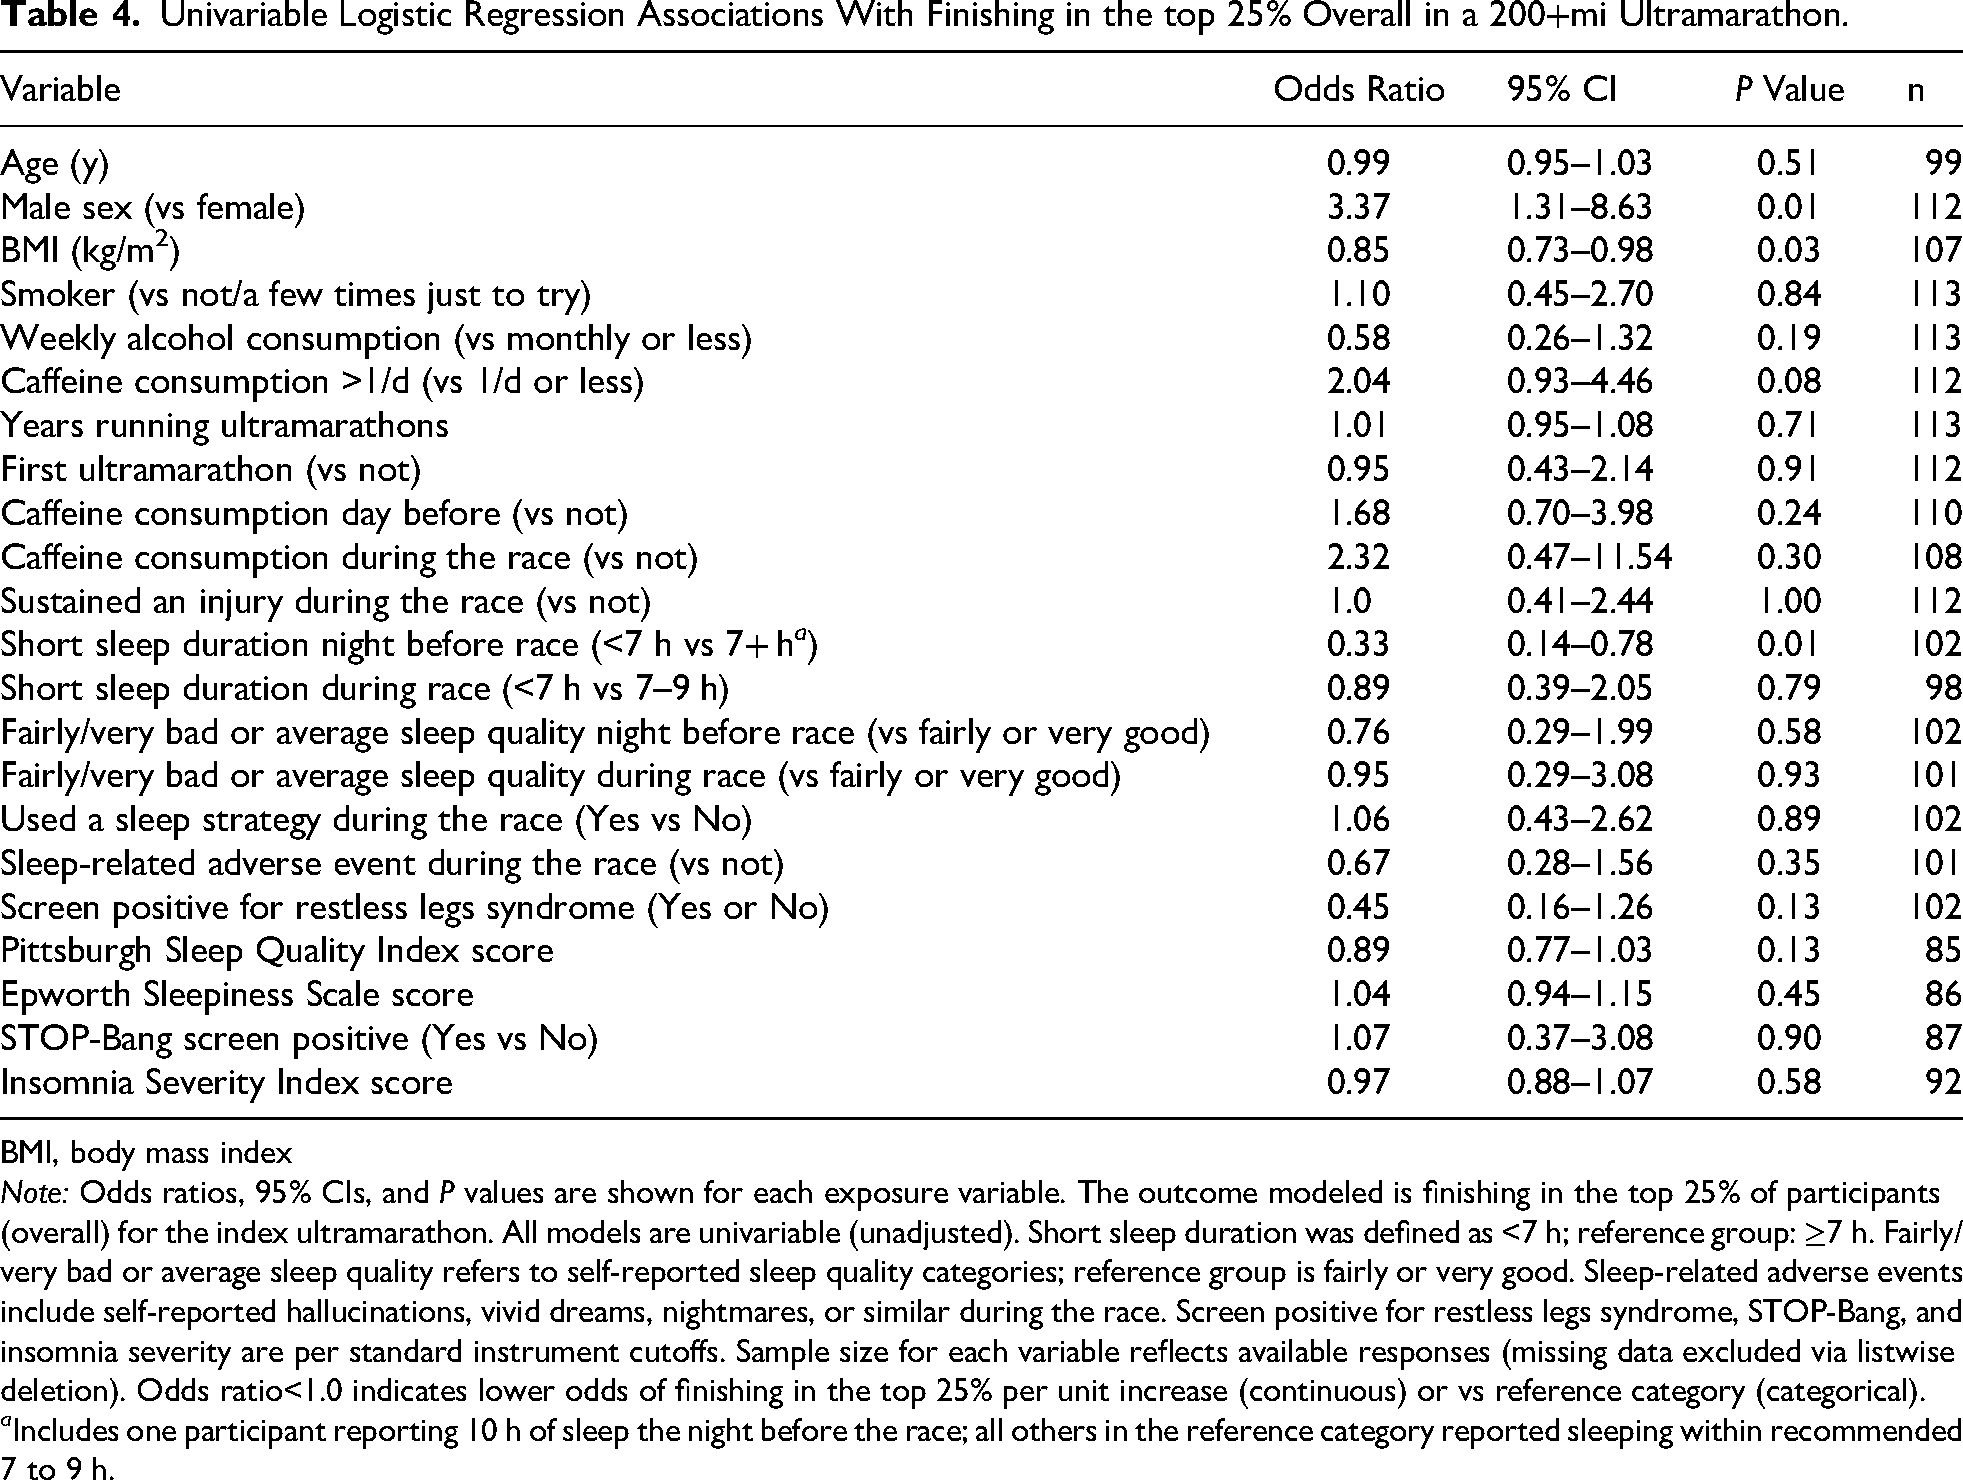
BMI, body mass index
Note: Odds ratios, 95% CIs, and P values are shown for each exposure variable. The outcome modeled is finishing in the top 25% of participants (overall) for the index ultramarathon. All models are univariable (unadjusted). Short sleep duration was defined as <7 h; reference group: ≥7 h. Fairly/very bad or average sleep quality refers to self-reported sleep quality categories; reference group is fairly or very good. Sleep-related adverse events include self-reported hallucinations, vivid dreams, nightmares, or similar during the race. Screen positive for restless legs syndrome, STOP-Bang, and insomnia severity are per standard instrument cutoffs. Sample size for each variable reflects available responses (missing data excluded via listwise deletion). Odds ratio<1.0 indicates lower odds of finishing in the top 25% per unit increase (continuous) or vs reference category (categorical).
a Includes one participant reporting 10 h of sleep the night before the race; all others in the reference category reported sleeping within recommended 7 to 9 h.
Univariable Logistic Regression Associations With Performing Better Than Expected in a 200+mi Ultramarathon.
BMI, body mass index
Note: Odds ratios, 95% CIs, and P values are shown for each exposure variable. The outcome modeled is performed better than expected, defined as participants who finished in a higher placement bracket than they anticipated before the race. All models are univariable (unadjusted). Short sleep duration was defined as <7 h; reference group 7 h or more. Fairly/very bad or average sleep quality refers to self-reported sleep quality categories; reference group is fairly or very good. Sleep-related adverse events include self-reported hallucinations, vivid dreams, nightmares, or similar during the race. Screen positive for restless legs syndrome, STOP-Bang, and insomnia severity are per standard instrument cutoffs. Performed better than expected is based on participants’ reported expected and actual placement categories (higher than prerace expectations=better than expected). Sample size for each variable reflects available data after exclusion of missing values (listwise deletion was used). Odds ratio<1.0 indicates lower odds of performing better than expected per unit increase (continuous variables) or vs reference category (categorical).
a Includes one participant reporting 10 h of sleep the night before the race; all others in the reference category reported sleeping within recommended 7 to 9 h.
Univariable Logistic Regression Associations With Being Satisfied or Very Satisfied With Race Performance in a 200+mi Ultramarathon.
BMI, body mass index
Note: Odds ratios, 95% CIs, and P values are shown for each variable. The outcome modeled is being satisfied or very satisfied with race performance (reference: moderately satisfied, dissatisfied, or very dissatisfied). All models are univariable (unadjusted). Odds ratios represent odds of being satisfied or very satisfied; odds ratio<1.0 indicates lower odds of satisfaction for that variable. Pittsburgh Sleep Quality Index score >5 indicates poor sleep quality; Epworth Sleepiness Scale score >10 indicates excessive daytime sleepiness; Insomnia Severity Index score (range 0–28; clinical categories as displayed); STOP-Bang screening tool for obstructive sleep apnea. Short sleep duration was defined as <7 h; the reference group is 7 to 9 h (including one participant with 10 h of sleep; all others within recommendations). Fairly/very bad or average sleep quality refers to self-reported sleep categories; reference is fairly or very good. Sleep-related adverse events include hallucinations, vivid dreams, nightmares, or similar during the race. Screen positive for restless legs syndrome, STOP-Bang, and insomnia severity are per standard instrument cutoffs. Sample size for each variable reflects available data after listwise deletion (complete case analysis).
a Includes one participant reporting 10 h of sleep the night before the race; all others in the reference category reported sleeping within recommended 7 to 9 h.
Discussion
This study revealed a number of variables associated with success and satisfaction in ultramarathon racing. Factors significantly associated with finishing in the top 25% of runners included being male vs female, having a lower BMI, and sleeping >7 h the night before the race. Although previous studies have indicated the importance of years of experience running ultramarathons in performance outcomes, this study did not find a significant association.12,21 Similarly, runners who scored higher on the PSQI and the ISI were less likely to exceed performance expectations. Hence, sleep quality likely plays a vital role in the performance outcomes of ultra-endurance athletes. Although not statistically significant, there was a possible association suggesting that runners who consumed caffeine more than once per day might have higher odds of exceeding their performance expectations (P=0.06). However, larger studies are needed to clarify whether a true association exists. In terms of performance satisfaction, runners who consumed alcohol more frequently (ie, weekly as opposed to monthly or less) were less satisfied with their performance. We included alcohol consumption in our survey as a key lifestyle variable given prior research linking regular alcohol intake to poor sleep quality, impaired physical recovery, and decreased athletic performance. In endurance athletes, alcohol may disrupt sleep architecture and circadian rhythms, which could impact both perceived and actual performance and recovery. However, it is also possible that regular alcohol use serves as a proxy for other psychosocial, behavioral, or health-related factors (such as stress, different coping styles, or less emphasis on health behaviors) that could independently affect race satisfaction. Our study was not designed to determine causality, and future research could further assess the interplay between alcohol use, sleep quality, and athletic outcomes in ultramarathoners.
Our findings provide insights for ultramarathoners who wish to improve their performance in the sport as well as potential implications for other extreme endurance-based activities. In particular, the importance of sleep for satisfactory performance outcomes is highlighted, with athletes who slept >7 h the night before a race having a higher likelihood of finishing in the top 25%. Previous literature has explored the benefits of sleeping 7 to 9 h (in line with public health guidance for sleep duration for adults) in the nights leading up to a race, with results supporting those found in this study.6,22,23 Although this study did not find a significant association with the use of sleep strategies during the race and performance outcomes, it does suggest the importance of adequate sleep duration in the nights leading up to the day of a race.
Ultramarathon runners often opt to forego sleep or sleep as minimally as possible during races to achieve faster times. In this study, almost half the athletes surveyed (49%) slept <7 h during the entirety of the ultramarathon race, with a median sleep duration during the race of 5.63 h. These findings are similar to those reported in other studies of ultramarathons of 200 mi (322 km) or more, with a median of 4.14 h of total sleep found by Miller et al (n=71) and a median of 4.7 h of total sleep found by Bianchi et al (n=4).6,9 The relatively larger median sleep duration found in this study may have been influenced by including races of longer distance. Previous studies have found that decreased sleep increases the risk of musculoskeletal injuries and illness and, in some cases, auditory and visual hallucinations.5,22 This study found that 34% of participants experienced hallucinations due to sleep deprivation. While foregoing sleep in shorter ultramarathon races may lead to improved race results, the importance of sleep both before and during the race increases as distances reach 200 mi (322 km) or more. Despite the benefits of quality sleep, almost half of the athletes surveyed (47%) reported sleeping <7 h the night before the race, with 31% reporting fairly bad or very bad sleep quality.
This research also highlights the potential impact of sleep-related disorders on performance in ultramarathon athletes, with 23% of participants being categorized as having subclinical threshold insomnia and 5% categorized as having clinical insomnia (moderate to severe), as measured by the ISI. Participants with higher ISI scores were less likely to exceed performance expectations. There are multiple plausible conclusions. Insomnia may negatively affect recovery, and thus race performance, or rather, high performance expectations may be seen as a stressor for an athlete and, when combined with a potential sleep disorder, may jointly impact performance. 24 These results suggest that screening for potential sleep disorders and addressing them may help to improve ultramarathon performance.
As ultramarathon races increase in distance, adequate sleep before and during the race becomes increasingly important. 5 This study found that in 200+ mi (322+ km) races in particular, sleep is likely vital to the success of the athlete. Individuals wishing to maximize their performance should focus on getting a recommended 7 to 9 h of sleep in the days leading up to their race as well as determining what sleep strategies work best to maximize sleep quality. Previous studies have demonstrated the impact of caffeine usage on mitigating impacts of sleep deprivation in endurance athletes, which may be another strategy for ultramarathon runners to implement into their race-day plan. 15 Considering that almost half the sample fell into the category of poor sleepers per the PSQI, it also may be beneficial to assess sleep quality and screen for potential sleep disorders to optimize health and race performance.
Strengths and Limitations
This study characterized sleep practices, strategies, and sleep-related adverse events using a range of validated sleep-related instruments (eg, PSQI, STOP-Bang, ESS, and ISI) with a relatively large number of participants compared with previous studies. Further conferring to the strengths of this study, runners were recruited from multiple geographic regions, and we included several established ultramarathon races, increasing generalizability. However, this study does have limitations. Its cross-sectional and self-reported survey design prevents inference of causality and is susceptible to recall bias. The recruiting method, which relied on race directors and voluntary responses, may underrepresent athletes with extremely negative or positive experiences or nonfinishers. Differences in race terrain, duration, climate, support, and other factors were not controlled for, and these factors may impact both sleep strategies and outcomes. Although respectable for this population, the modest sample size may limit statistical power to detect smaller effects or generalize to all ultramarathon runners. Notably, of 117 respondents, only 17 (15%) did not finish their ultramarathon event. Due to the small size of this group, we did not conduct separate analyses for associations with race noncompletion because such analyses would lack sufficient statistical power for reliable interpretation. Another limitation is the lack of racial and ethnic diversity among respondents: 94% of participants identified as White. Although consistent with prior reports, this distribution is not representative of the general US population. As such, our findings reflect the experiences of White ultramarathoners and may not capture potential differences across more diverse populations. Efforts to increase diversity and inclusion within ultramarathon events could enhance the applicability of future research in this field. Also, associations were identified using univariable models; in future studies, adjusting for potential confounding structures using multivariable analyses is recommended. Finally, the absence of objective measures (eg, actigraphy and polysomnography) precludes precise quantification of sleep duration and quality but does provide direction for future studies.
Conclusions
The findings of this study highlight multiple insights into what may contribute to success and satisfaction in 200+ mi (322+ km) ultramarathons. While this study corroborates previous findings such as the influence of BMI on ultramarathon success, it notably calls attention to the importance of sleep on performance outcomes. Despite the necessity of sleep strategies in ultramarathons of 200 mi (322 km) or more, many runners reported an insufficient amount and quality of sleep and a high rate of sleep-related adverse events. These findings therefore suggest the need for increased awareness of the importance of sleep in this population, with special consideration toward routine sleep screenings, prerace sleep preparation, and within-race sleep strategies. As ultramarathons increase in distance and popularity, optimizing sleep should be seen as a key modifiable factor to optimize the performance and satisfaction of runners pursuing this discipline.
Footnotes
Ethical Considerations and Consent to Participate
The Health Sciences and Behavioral Sciences Institutional Review Board at the University of Michigan approved our survey with a notice of exemption (approval: HUM00237228) on June, 16, 2023. Respondents gave electronic consent for participation before starting the survey. Data are available on reasonable request from the corresponding author.
Author Contribution(s)
Funding
The author(s) received no financial support for the research, authorship, and/or publication of this article.
Declaration of Conflicting Interests
The author(s) declared no potential conflicts of interest with respect to the research, authorship, and/or publication of this article.