
Abstract
BACKGROUND:
Food insecurity affects 15 million households in the United States and is associated with negative physical and mental health outcomes including Major Depressive Disorder. Governmental public assistance or food benefit programs including the Supplemental Nutrition Assistance Program (SNAP) and Women, Infants, and Children (WIC) are social intervention services that attempt to minimize food insecurity for low-income households. There is little consensus regarding the effects of food benefit participation on reducing risk of depressive symptoms.
AIM:
This study aims to explore the association between household food insecurity and food benefit participation (SNAP or WIC) on risk for depressive symptoms using nationally representative samples from the Center for Disease and Control and Prevention Nutritional Health and Nutrition Examination Survey 2013-2014 and 2015-2016 cohorts. We hypothesize that food insecurity is associated with increased risk of depressive symptoms and food benefit participation with reduced risk.
METHOD:
Cross-sectional analyses were conducted using survey-weighted logistic regression to explore the relationship between food insecurity, food benefit participation, and the risk of depressive symptoms controlling for relevant income and sociodemographic variables.
RESULTS:
When controlling for sociodemographic variables, food benefit participation did not reduce the risk of depressive symptoms, while high levels of food insecurity were associated with elevated risk.
CONCLUSIONS:
High levels of food insecurity are associated with elevated risk of depressive symptoms. Nurses and public health professionals can address food security needs through increased knowledge of referral and eligibility requirements. Implications on clinical practice, policy, and future directions for research are discussed.
Limited access to food is a major source of distress in the United States, with 15 million households reporting food insecurity (Coleman-Jensen et al., 2018). The United States Department of Agriculture (USDA, 2019a) defines food insecurity as household-level economic and social conditions resulting in limited and uncertain access to food. Additionally a seminal work defines food insecurity as the inaccessibility of nutritionally adequate and safe foods (Anderson, 1990). Among the 15 million U.S. households that report food insecurity, 6.1 million report very high levels of food insecurity (Coleman-Jensen et al., 2018). Households with very high levels of food insecurity are characterized by disrupted eating patterns and reduced food intake (Bickel et al., 2000). On average, a food insecure household restricts their caloric intake by 5,200 calories per week less than food secure households, which is approximately the dietary caloric intake for an adult male for 2 days (Gregory et al., 2019). One in every nine U.S. households is forced to make difficult decisions between paying for food and other essential needs (e.g., housing, utilities; Coleman-Jensen et al., 2018). These households are less likely to acquire nutritious foods with less total fruit, whole fruit, total protein, and seafood and plant proteins than food secure households. Also food insecure households are more likely to purchase their foods at accessible convenience store locations with foods containing high salt, fat, and sugar content (Gregory et al., 2019). Households who experience very high levels of food insecurity are adapting based on their own available resources, which affects not only the quality and quantity of accessible foods but also has implications on health and well-being (Feeding America, 2014).
Food insecure individuals are at high risk for developing psychological distress including depressive symptoms or diagnosable psychopathology, including major depressive disorder (MDD; Ciciurkaite & Brown, 2017; Gundersen & Ziliak, 2015; Whitaker et al., 2006). The risk of psychological distress has been hypothesized to be, in part, due to exposure to chronic or prolonged stress (Lazarus & Folkman, 1984; Schetter & Tanner, 2012; Tanner Stapleton et al., 2016). Food insecurity is an example of a source of chronic stress as food insecure households report the effects of food insecurity on average 7 months of the year (Coleman-Jensen et al., 2018). A recent meta-analysis indicates that individuals who report food insecurity have 2.74 the odds of experiencing MDD (Arenas et al., 2019). Although the relationship between food insecurity and risk for experiencing MDD or depressive symptoms has been explored, few studies have explored this relationship within the context of governmental public assistance food benefit participation.
In response to prevalent food insecurity, the Dietary Guidelines Advisory Committee (2015) has supported the expansion of federal nutrition policies as a means to reduce food insecurity. Governmental public assistance or food benefit programs including the Supplemental Nutrition Assistance Program (SNAP) and Women, Infants, and Children (WIC) are available to individuals who qualify based on household income requirements. Of food insecure households, 58% report that they have participated in one federal nutrition assistance program (Coleman-Jensen et al., 2018). SNAP alone serves 42 million American families (Coleman-Jensen et al., 2018). Public food supplementation programs aim to reduce food insecurity in U.S. households and the effect of food benefit programs on reducing food insecurity is well established (Nord, 2012; Ratcliffe et al., 2011; Tiehen & Ver Ploeg, 2012; Wilde & Nord, 2005). However, it is still unclear if utilization of these programs reduces the risk of MDD or depressive symptoms. The studies that explored this relationship show lack of consensus in the their results, with evidence for both protective (Heflin et al., 2005; Leung et al., 2014) and nonprotective effects (Adynski et al., 2019; Bergmans et al., 2018; Kim & Frongillo, 2007; Oddo & Mabli, 2015) of food benefit programs on risk for MDD or depressive symptoms.
There has been a call within public health to promote health equity with one of the Healthy People 2020 goals, which aims to eliminate food insecurity among children (Office of Disease Prevention and Health Promotion, 2020). Nurses are uniquely positioned to have an active role in the national efforts to reduce food insecurity and promote health equity through screening, education, referral (community based and government food benefit programs), and the implementation of evidence-based interventions (Flores & Amiri, 2019).
This study aims to explore the potential buffer effect of food benefit participation (SNAP or WIC) on risk for depressive symptoms when controlling for relevant income and sociodemographic variables using nationally representative samples from the Center for Disease and Control and Prevention (CDC) Nutritional Health and Nutrition Examination Survey (NHANES) for both the 2013-2014 and 2015-2016 cohorts. We hypothesize the following:
Method
For this study, we conducted secondary data analyses of deidentified data separately for the 2013-2014 and 2015-2016 cohorts from CDC’s annual NHANES publicly available data sets (CDC) 2020b). The NHANES survey is a nationally representative sample of American households that aims to assess the health and nutritional status of adults and children in the United States and is administered every year (CDC, 2020a). The 2013-2014 and 2015-2016 NHANES cohorts were selected for this study as they are the most recently released cohorts having data containing variables on food security. The use of both cohorts was selected in order to improve the robustness of our analysis. The Institutional Review Board of the University of North Carolina at Chapel Hill approved the current study (No. 19-1377).
Participants
For this study, adult participants were included in our sample if they completed all the relevant sociodemographic, food security, food benefit participation, and depression screening responses collected during the interview process within the 2013-2014 or 2015-2016 NHANES cohorts (see Figure 1 for cohort sample sizes).
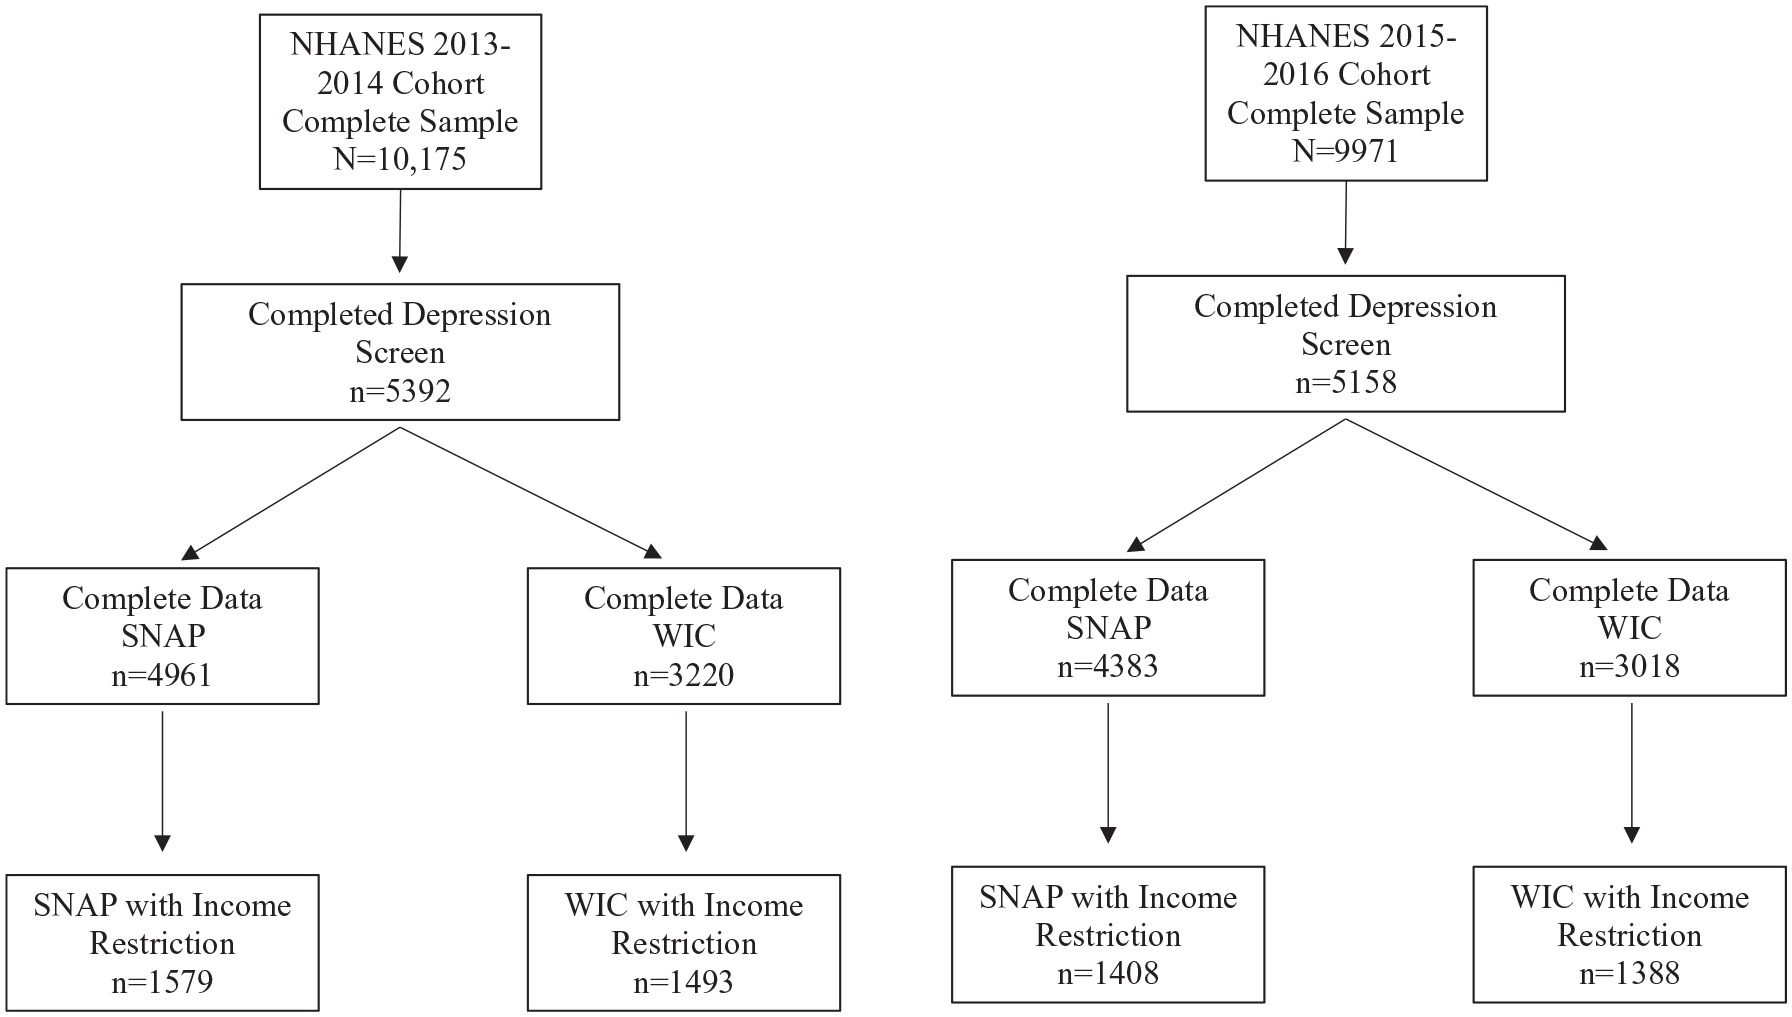
Flowchart for sample size.
Measures
Predictors: Food Insecurity and Food Benefit Participation
Household-level food insecurity was measured by the U.S. Food Security Module, an 18-item instrument developed by the U.S. Department of Agriculture to assess food security in the past 12 months (Bickel et al., 1996; Bickel et al., 2000). The items within the tool assess experiences of anxiety surrounding food budget or supply, perception of food supply, perception of food quality, and behaviors surrounding reduced food intake and its consequences for adults and children within the household (Bickel et al., 2000). Households with children are assessed with 18 items, while households without children are assessed with 10 items. A raw score is calculated by a sum of affirmative responses. Households are categorized into four groups based on severity of food insecurity, based on the following number of affirmative responses: food secure (0-2), marginal food secure (3-7 with children and 3-5 without children), low food secure (8-12 with children and 6-8 without children), very low food secure (13-18 with children and 9-10 without children). For the purpose of this study, all four categories were retained with a four-level variable for household food security including food secure, marginal, low, and very low food secure. The Food Security module has been validated and is considered the gold standard for measurement of food insecurity (Cook et al., 2013).
Food benefit participation was assessed via self-report in the survey. Participants were asked whether they had used WIC or SNAP benefits in the past 12 months “in the last 12 months did you or any members of your household receive Food Stamp Benefits (SNAP)?” or “ Did you or a member of your household receive benefits from WIC, that is, the Women, Infants, and Children program, in the past 12 months?”
Outcome: Depressive Symptoms
Depressive symptoms were assessed with the nine-item Patient Health Questionnaire (PHQ-9; Kroenke et al., 2001). The PHQ-9 is a widely used tool to screen depressive symptoms in the general population and has extensive validation (Gilbody et al., 2007; Kroenke et al., 2001; Martin et al., 2006). Participants respond with the frequency in which they experience the depressive symptom from “not at all (0)” to “nearly every day (3).” Scores range from 0 to 27, with higher scores indicating elevated levels of depressive symptoms. For the purpose of this study, the PHQ-9 score was dichotomized into unlikely depression (score <9) and likely depression (score ≥10) based on previous studies establishing that a moderate or higher screening score is highly predictive of a diagnosis of MDD (Manea et al., 2012). Scores were imputed for participants who did not complete 1 to 2 items by replacing the missing response(s) with the average for the completed responses. If a participant did not answer three or more items, the screen was considered incomplete and excluded from the analysis.
Covariates: Sociodemographic Factors
The sociodemographic variables utilized from the NHANES data set included the following: age (years), gender (male and female), race and ethnicity, education, insurance status, and income. Race and ethnicity were organized into the following categories: non-Hispanic White, non-Hispanic Black, Hispanic, non-Hispanic Asian, and other (those who reported more than one race and ethnicity). Education was reported as highest level of education (less than high school, high school, some college, and college degree or higher). Insurance status was divided into multiple categories, including no insurance, Medicaid, private insurance, or other (Medicare, State Children’s Health Insurance Program, Military health care, Indian health service, state sponsored plan). Participants reported household size as the number of individuals living in the house. Household income level was standardized based on residential location and household size as the Income Needs Ratio (INR). For example, an INR score less than 1 indicates a household income level below the federal poverty line, a score of 1 indicates the income of a household that is exactly at the federal poverty line, while a score of 2 indicates a household that is earning 200% of the federal poverty line. INR is used in order to determine eligibility for food benefit programs (WIC 1.85 and SNAP 1.3; Center on Budget and Policy Priorities, 2020) and is reported as a score between 0 and 5.
Analysis
Samples were created based on participants complete responses on depression screen with SNAP participation (2013-2014 n = 4,961; 2015-2016 n = 4,383) and WIC participation (2013-2014 n = 3,220; 2015-2106 n = 3018), respectively. Further the samples were subdivided for both SNAP (2013-2014 n = 1,579; 2015-2016 n = 1408) and WIC (2013-2014 n = 1,493; 2015-2016 n = 1388) with an income restriction based on income needs ratio eligibility criteria for participation in the programs. The income restricted subsamples were created in order to explore households that were eligible but did not participate in the food benefit programming. For a flow chart of the sample size for these analyses, see Figure 1.
Unweighted descriptive statistics were calculated to determine the composition of each subsample for analysis: means and standard deviations or frequency and percentages were calculated, as appropriate. Univariate survey-weighted logistic regression models were conducted for each sociodemographic, food security, and food benefit participation predictor with the outcome of depressive symptoms. Initial survey-weighted multivariable models included both food security and food benefit participation on depression controlling only for age and gender. Additional survey-weighted (full) multivariable logistic regression models were expanded to include all sociodemographic variables (age, gender, race and ethnicity, education, insurance status, marital status and INR for the non–income restricted samples, and all sociodemographic variables except for INR for the income restricted models) on the outcome of depressive symptoms. These analyses were conducted for each sample including both income-restricted and nonrestricted samples (see Figure 1). For each of the univariate, age- and gender-controlled, and full multivariable logistic regression models, design variables including survey weights from NHANES were applied in order to reflect the nationally representative nature of the sample. Further details on the survey-weighted procedures and analytic guidelines are available elsewhere (CDC, 2020c; Chen et al., 2018). As the basis for statistical significance, we selected an alpha level of 0.05. The following statistics are reported for the model results: parameter estimates, standard errors (SE), odds ratios (OR), 95% confidence intervals (CI), and p values.
Results
The unweighted demographics of the samples are described in Table 1. We noted key differences between the non–income restricted and restricted samples. The income restricted samples were less educated, had a lower prevalence of marriage, were more likely to have no insurance or being on Medicaid, and had higher food insecurity, with higher participation in WIC or SNAP. The income restricted samples were also more likely to report moderate or severe depressive symptoms indicating high risk for MDD.
Unweighted Descriptive Statistics for Variables of Interest Including Demographics, Food Security, and Depression.
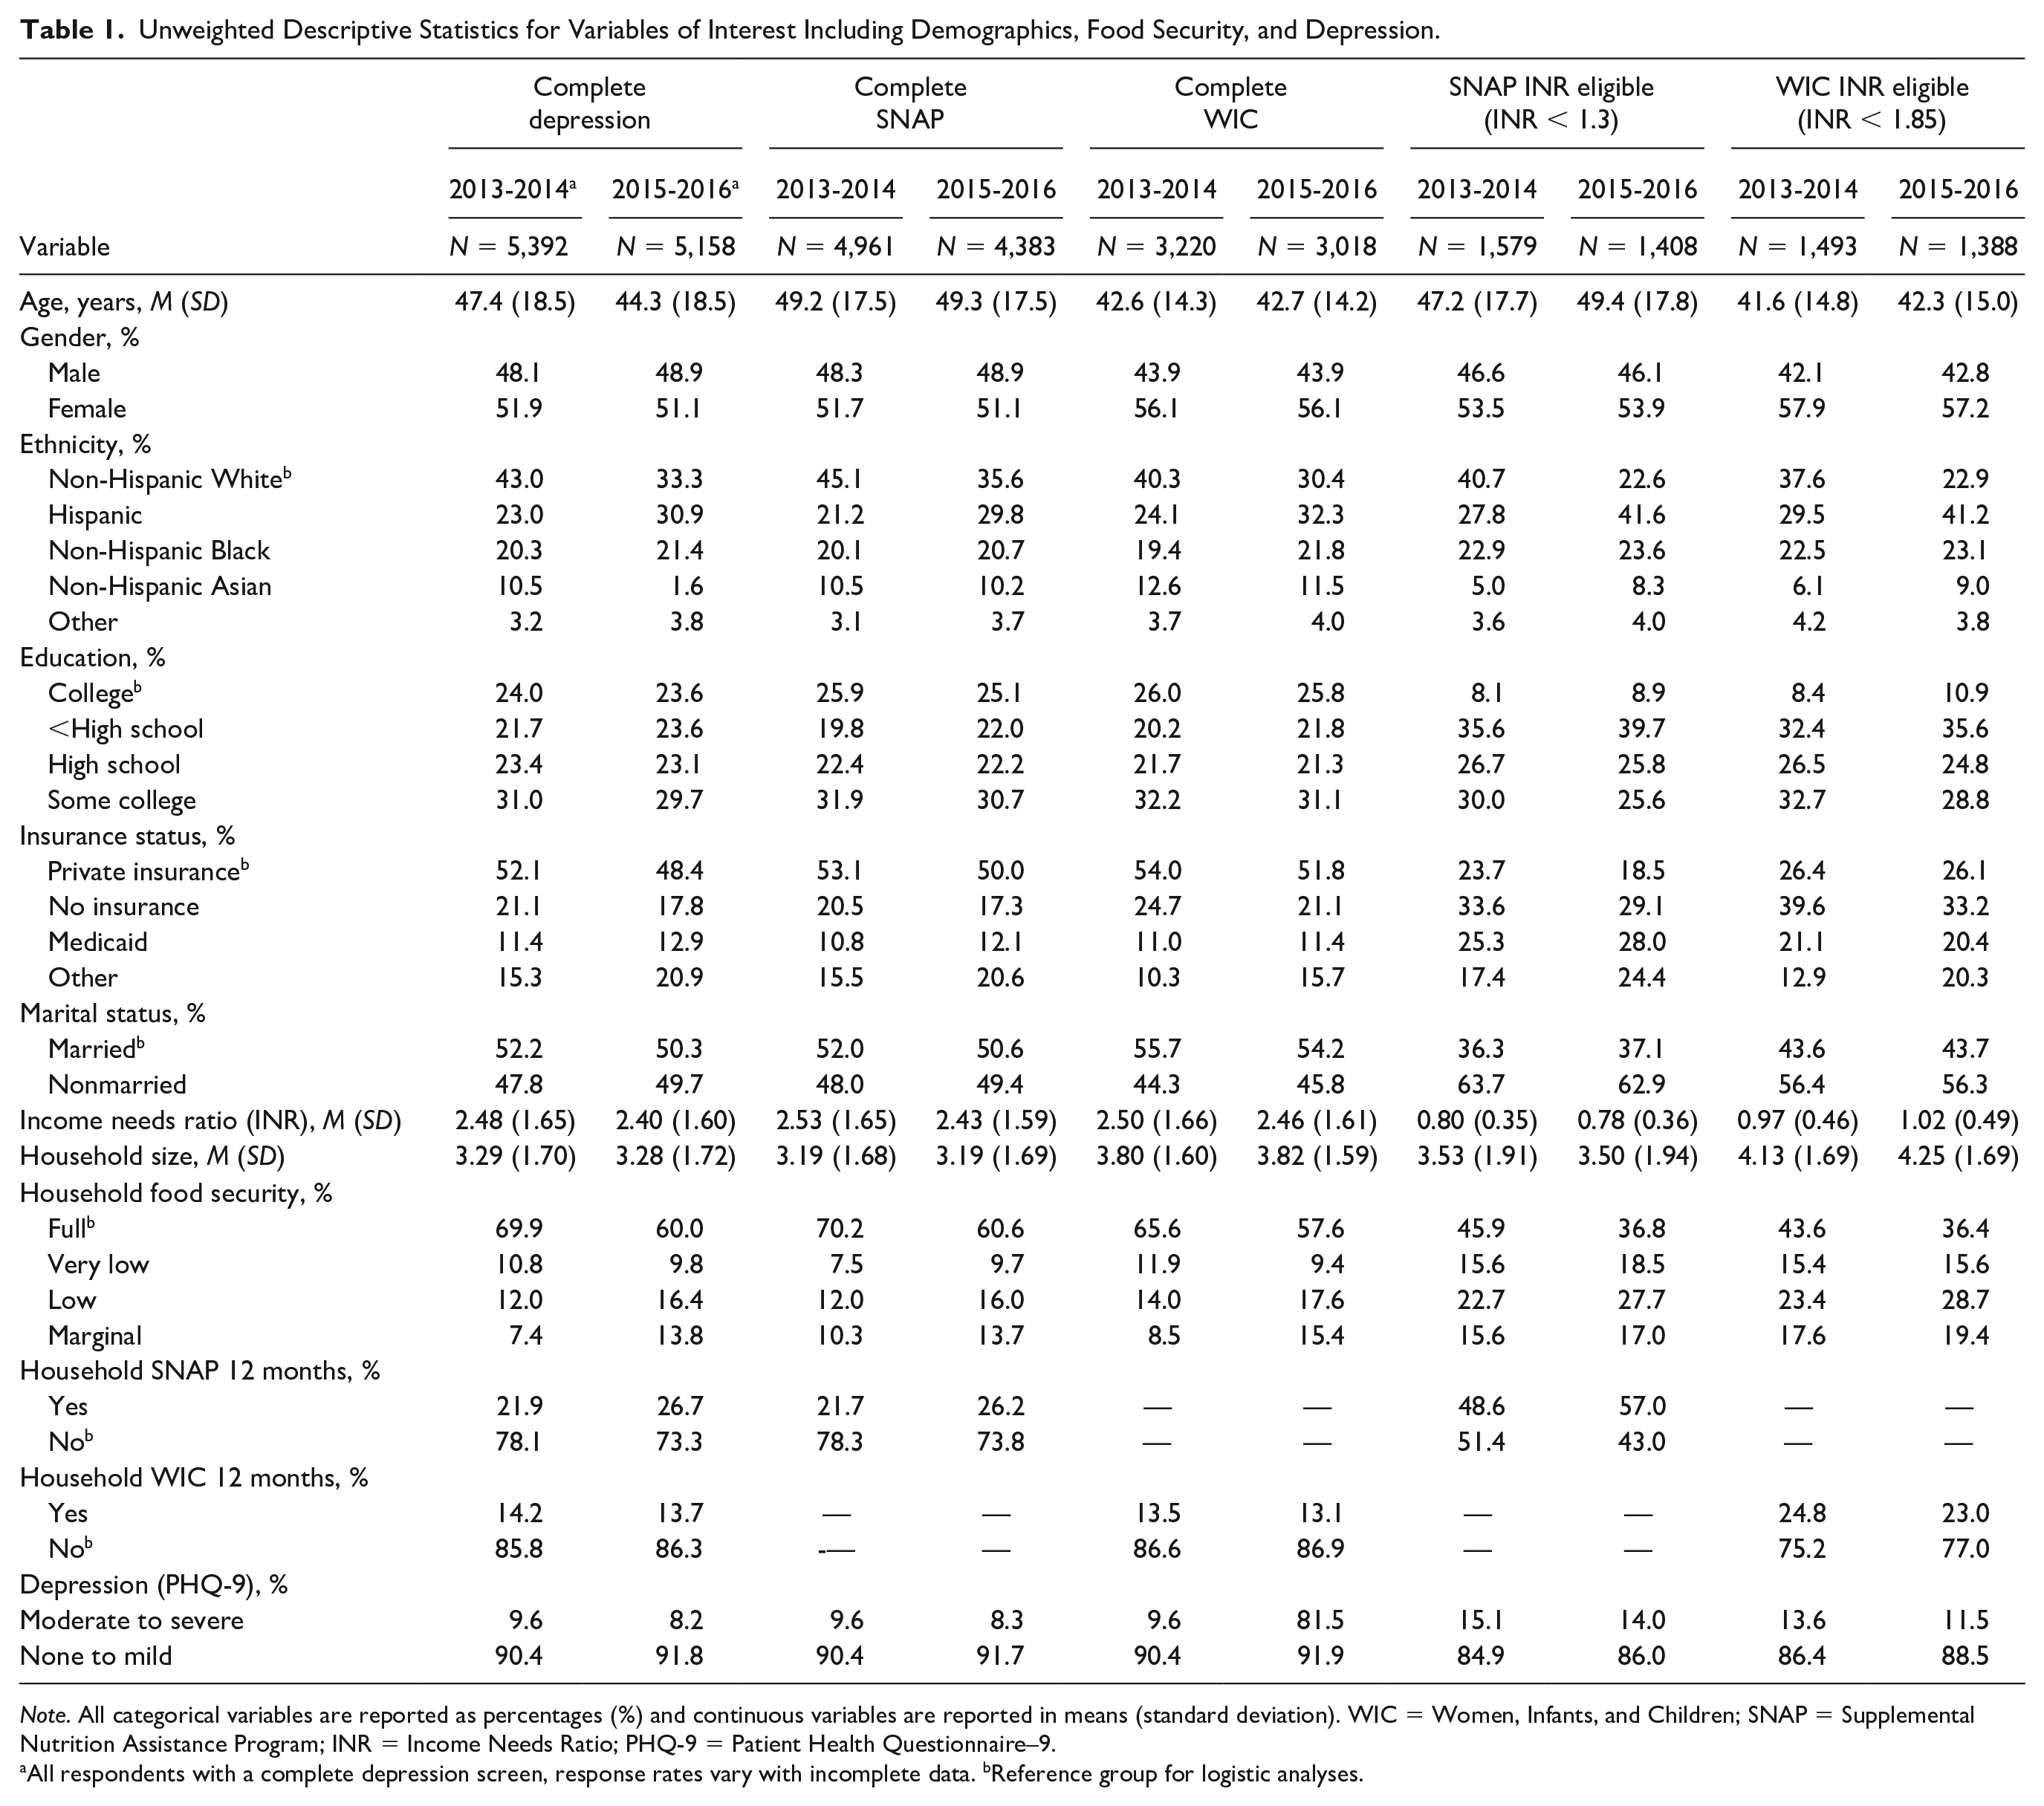
Note. All categorical variables are reported as percentages (%) and continuous variables are reported in means (standard deviation). WIC = Women, Infants, and Children; SNAP = Supplemental Nutrition Assistance Program; INR = Income Needs Ratio; PHQ-9 = Patient Health Questionnaire–9.
All respondents with a complete depression screen, response rates vary with incomplete data. bReference group for logistic analyses.
Non–Income Restricted Sample
SNAP
In testing the association between food insecurity and depression in the non–income restricted sample, our initial survey-weighted regression model adjusting only for age and gender showed that individuals at every level of food insecurity were significantly associated with increased odds of experiencing depression across both the 2013-2014 and 2015-2016 cohorts (ORs ranging from 2.12 to 4.43) compared with food secure households. Furthermore, individuals participating in the SNAP program had an increased odds of depressive symptoms (2013-2014 OR = 1.82, 95% CI [1.30, 2.56], p < .001; 2015-2016 OR = 2.85, 95% CI [2.15, 3.77], p < .001) compared with those who did not receive SNAP benefits (Table 2). In our survey-weighted full multivariable model including sociodemographic variables, households who reported low or very low food security were associated with increased odds of experiencing depressive symptoms with odds ratios of 1.71 (95% CI [1.25, 2.33]) and 2.89 (95% CI [1.95, 4.28]) compared with food secure households the 2013-2014 cohort, respectively. In the 2015-2016 cohort, all households who reported food insecurity (marginal, low, very low) were significantly associated with increased odds of experiencing depressive symptoms compared with food secure households with odds ratios ranging from 1.93 to 2.66. In the 2015-2016 cohort SNAP participation was significantly associated with an increased risk of experiencing depressive symptoms compared with households that did not participate in SNAP (OR = 2.06, 95% CI [1.41, 3.00]; p < .001) while SNAP participation in the 2013-2014 cohort showed an attenuated effect (OR = 1.20, 95% CI [0.83, 1.75], p = .333).
Effect of Food Benefit Programming on Depression: Age- and Gender-Controlled and Full Multivariable Models for the SNAP Samples.
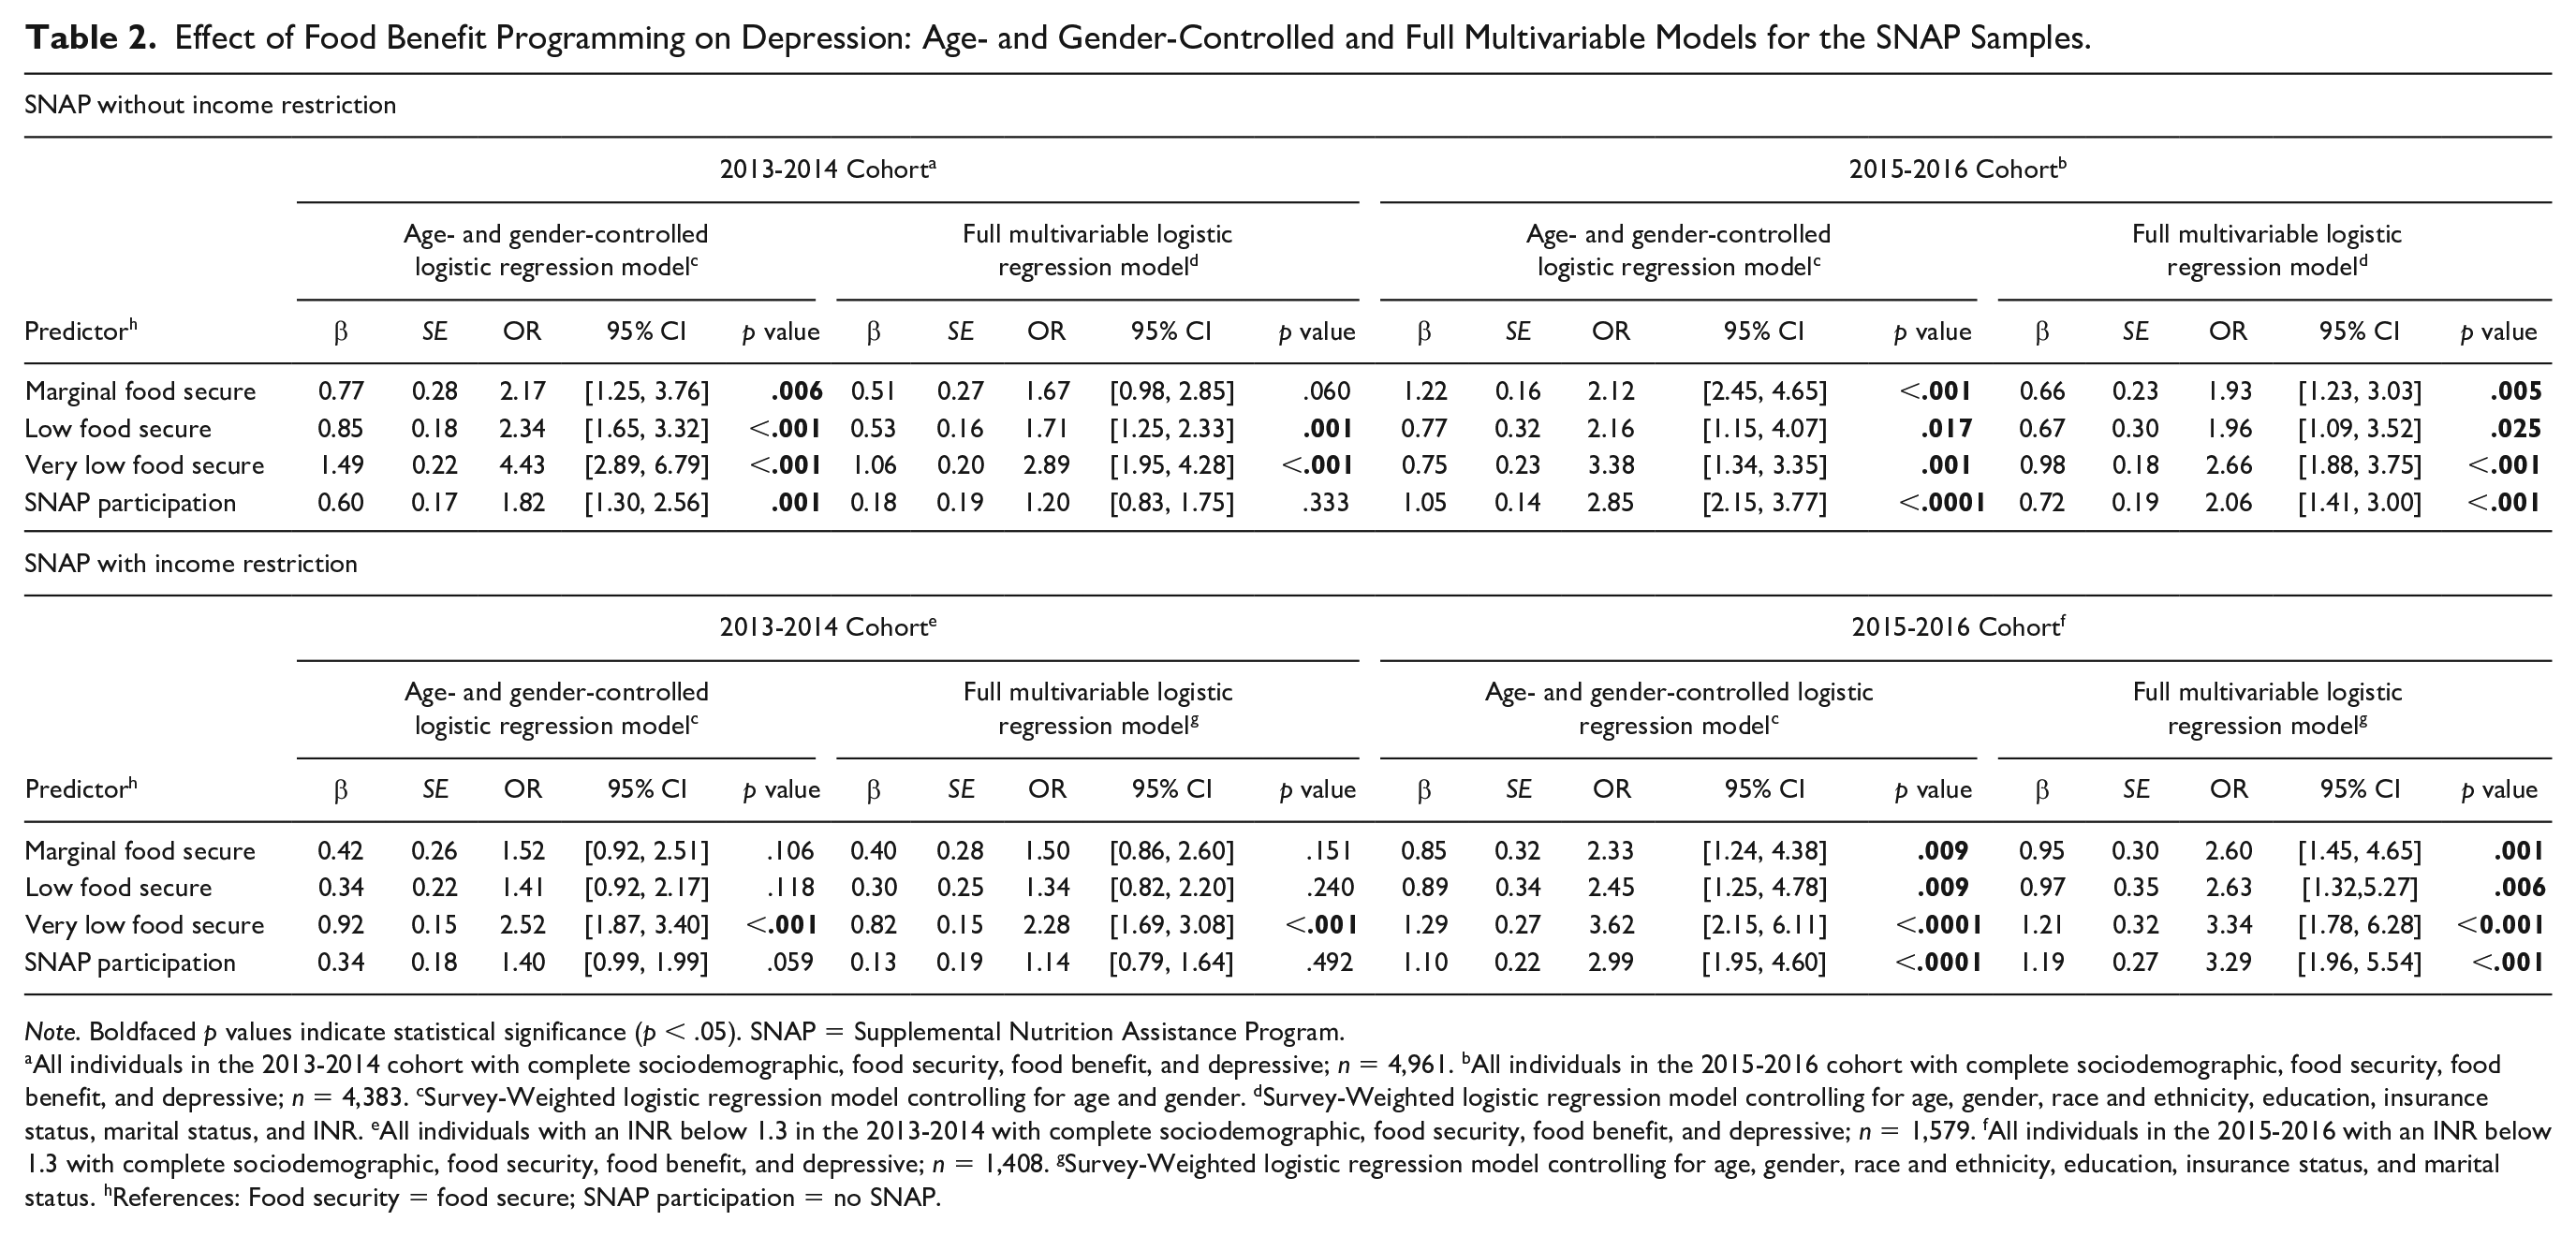
Note. Boldfaced p values indicate statistical significance (p < .05). SNAP = Supplemental Nutrition Assistance Program.
All individuals in the 2013-2014 cohort with complete sociodemographic, food security, food benefit, and depressive; n = 4,961. bAll individuals in the 2015-2016 cohort with complete sociodemographic, food security, food benefit, and depressive; n = 4,383. cSurvey-Weighted logistic regression model controlling for age and gender. dSurvey-Weighted logistic regression model controlling for age, gender, race and ethnicity, education, insurance status, marital status, and INR. eAll individuals with an INR below 1.3 in the 2013-2014 with complete sociodemographic, food security, food benefit, and depressive; n = 1,579. fAll individuals in the 2015-2016 with an INR below 1.3 with complete sociodemographic, food security, food benefit, and depressive; n = 1,408. gSurvey-Weighted logistic regression model controlling for age, gender, race and ethnicity, education, insurance status, and marital status. hReferences: Food security = food secure; SNAP participation = no SNAP.
WIC
In testing the association between food security and depressive symptoms in the nonincome restricted sample, our initial survey-weighted regression model (adjusted only for age and gender) showed that across both NHANES cohorts all levels of food insecurity were associated with increased OR (ranging from 2.53 to 5.39) of experiencing depressive symptoms as compared with food secure households (Table 3). WIC participation was not significantly associated with depressive symptoms (2013-2014 OR = 1.01, 95% CI [0.68, 1.49], p = .966; 2015-2016 OR = 1.01, 95% CI [0.61, 1.65], p = .985). In the survey-weighted full multivariable model, controlling for relevant sociodemographic variables, all levels of food insecurity compared with food secure households retained their significance with elevated odds of depressive symptoms (OR ranging from 1.92 to 3.05) across both NHANES cohorts. Furthermore, WIC participation was not significantly associated with depressive symptoms (2013-2014 OR = 0.98, 95% CI [0.60, 1.60], p = .940; 2015-2016 OR = 0.70, 95% CI [0.41, 1.20], p = .196).
Effect of Food Benefit Programming on Depression: Age- and Gender-Controlled and Full Multivariable Models for the WIC Samples.
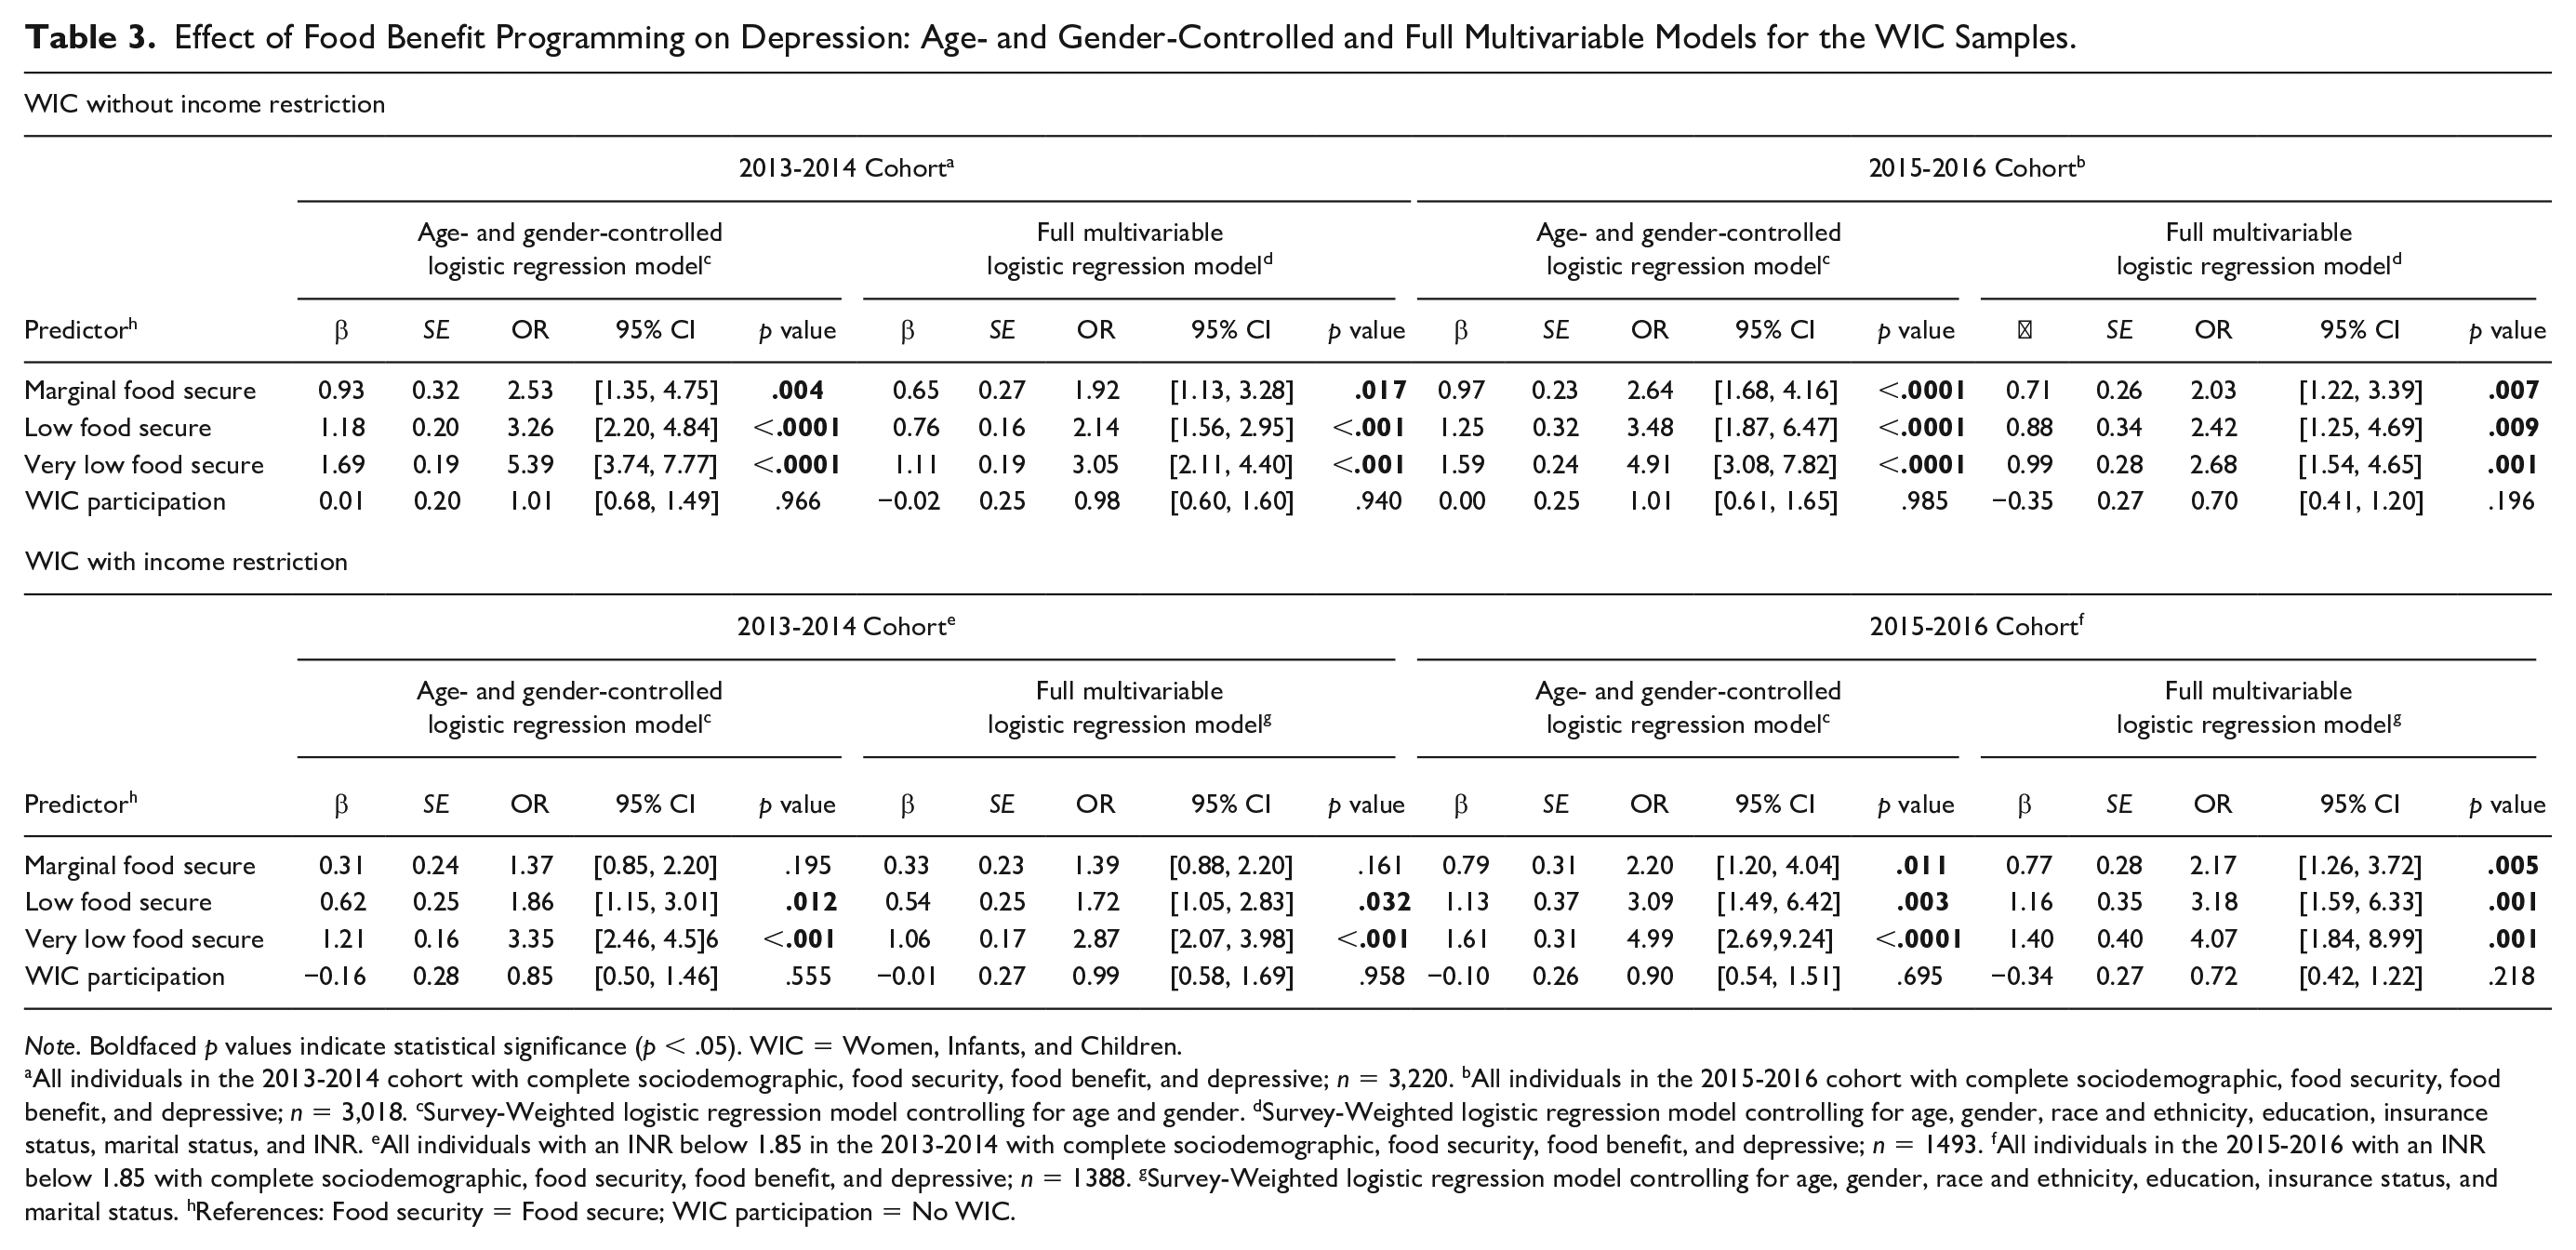
Note. Boldfaced p values indicate statistical significance (p < .05). WIC = Women, Infants, and Children.
All individuals in the 2013-2014 cohort with complete sociodemographic, food security, food benefit, and depressive; n = 3,220. bAll individuals in the 2015-2016 cohort with complete sociodemographic, food security, food benefit, and depressive; n = 3,018. cSurvey-Weighted logistic regression model controlling for age and gender. dSurvey-Weighted logistic regression model controlling for age, gender, race and ethnicity, education, insurance status, marital status, and INR. eAll individuals with an INR below 1.85 in the 2013-2014 with complete sociodemographic, food security, food benefit, and depressive; n = 1493. fAll individuals in the 2015-2016 with an INR below 1.85 with complete sociodemographic, food security, food benefit, and depressive; n = 1388. gSurvey-Weighted logistic regression model controlling for age, gender, race and ethnicity, education, insurance status, and marital status. hReferences: Food security = Food secure; WIC participation = No WIC.
Income Restricted Sample
SNAP
For our income restricted sample, the initial survey-weighted regression model (adjusted for age and gender) for the 2013-2014 cohort indicates that households with very low food security had significantly increased odds of experiencing depressive symptoms compared with food secure households (OR = 2.52, 95% CI [1.87, 3.40], p < .001). Within the 2015-2016 cohort, all levels of food insecurity were significantly associated with elevated odds of experiencing depressive symptoms compared with food secure households (ORs ranging from 2.33 to 3.62). In the 2015-2016 cohort, SNAP participation was significantly associated with increased odds of depressive symptoms (OR = 2.99, 95% CI [1.95, 4.60], p < .001) compared with households that did not participate in SNAP in the survey-weighted age- and gender-adjusted model (Table 2). In the survey-weighted full multivariable model, for the 2013-2014 cohort only very low food secure households retained its significance with depressive symptoms (OR = 2.28, 95% CI [1.69, 3.08], p < .001) compared with food secure households. In the 2015-2016 cohort, all levels of food insecurity retained their significance with increased odds of experiencing depressive symptoms compared with food secure households (ORs ranging from 2.60 to 3.34). In the 2013-2014 cohort, SNAP participation was attenuated compared with the survey-weighted age- and gender-adjusted model (OR = 1.14, 95% CI [0.79, 1.64], p = .492), though both were nonsignificant. In the 2015-2016 cohort SNAP participation retained its significance in the survey-weighted full multivariable model with increased odds of experiencing depressive symptoms compared with households not participating in SNAP (OR = 3.29, 95% CI [1.96, 5.54], p < .001).
WIC
For our income restricted sample in the 2013-2014 cohort, the initial survey-weighted age- and gender adjusted model indicated that both low and very low food security levels were significantly associated with increased odds of depressive symptoms (respective OR = 1.86, 95% CI [1.15, 3.01]; OR = 3.35, 95% CI [2.46, 4.56]) compared with food secure households (Table 3). In the 2015-2016 cohort survey-weighted age- and gender adjusted model, all levels of food insecurity were significantly associated with increased odds of depressive symptoms (ORs ranging from 2.20 to 4.99). Across the 2013-2014 and 2015-2016 cohorts, the associations were retained in the survey-weighted full multivariable models (ORs ranging from 1.72 to 4.07). Across both cohorts both in the initial and final survey-weighted multivariate models, WIC participation was not significantly associated with depressive symptoms.
Discussion
The purpose of this study was to explore the relationship among food insecurity, food benefit participation, and depressive symptoms using a nationally representative sample from the CDC NHANES 2013-2014 and 2015-2016 cohorts. Our results supported our initial hypothesis regarding food insecurity being associated with an increased risk of experiencing depressive symptoms. Across income restricted samples, controlling for other relevant sociodemographic factors, very low food security was consistently significantly associated with depressive symptoms. The results from the multivariable income nonrestricted sample reflected more levels of food insecurity being associated with depressive symptoms. All our analyses suggest that WIC and SNAP did not reduce the risk of depressive symptoms, with SNAP participation being associated with increased odds of experiencing depressive symtpoms in the 2015-2016 cohort.
Recent literature has explored the role of inflammation in individuals with MDD as well as other negative health outcomes (Capuron et al., 2017; Eisenberger et al., 2017; Nusslock & Miller, 2016). Meta analyses indicate that individuals with MDD have both elevated peripheral and systemic inflammation implicating inflammation in the development of depression (Firth et al., 2019; Goldsmith et al., 2016; Wang & Miller, 2017). Individuals who experience very low food security may be exacerbating their physiological risk for MDD through the diets they have access to (Bergmans et al., 2018). Future research should include biological indicators of health such as inflammation, which may be related to and part of the mechanisms in which depressive symptoms develops in individual with very low food security.
Our hypothesis regarding the potential buffer in risk for depressive symptoms based on food benefit participation was not supported. The only reduction in odds was seen in the income restricted WIC samples, but these results were nonsignificant. The majority of other results exploring food benefit programming indicated near independent odds of increased depressive symptoms and were also nonsignificant, except for SNAP participation in the 2015-2016 cohort, which reflected increased odds for experiencing depressive symptoms (OR = 3.29, 95% CI [1.96, 5.54]). The current literature has little consensus regarding the role of food benefit participation on reduction of risk for depressive symptoms or MDD. Overall, our results support the evidence from studies that found increased odds for depressive symptoms among individuals utilizing food benefit programming (Heflin et al., 2005; Leung et al., 2014). This may indicate that these programs, which may be effective in increasing access to foods, may not address other psychosocial stressors of individuals in low social positions associated with experiencing depressive symptoms. Additionally, the requirements for food benefit participation affect the individuals access through policy decisions increasing nonincome-related criteria such as employment requirements (Bolen et al., 2016). Our study contributes to the discussion of policy surrounding food benefit programming. Uncertainty about the eligibility to these programs may be important as recently the USDA has issued changes in the employment requirements, which is estimated to affect 2.1 million households losing their SNAP benefit eligibility (USDA, 2019b; Wheaton, 2019). Additionally, stigma of welfare participation may contribute to risk for depressive symptoms. A positive view of food benefit programming, among individuals using these programs, was associated with a reduction in depressive symptoms (Bergmans et al., 2018). This study highlights the importance of perception of the food benefit programming. We suggest that participation itself is not the only measure that should be considered for food benefit programming and perception and attitudes of participants should be explored as potential moderators in future research. This brings into question how food benefit programs are delivered as well as how individuals are supported through this process and may indicate the need for further support to enhance the effects of the program in terms of reducing risk of experiencing depressive symptoms and MDD.
Our study has some limitations that need to be taken into consideration. We used NHANES data cross-sectionally, thus our results do not reflect causal effects. Despite this, our study has multiple strengths including the use of two separate cohorts through large nationally representative samples to help support the robustness of our findings. Additionally, our study accounted for the survey design variables in our analyses and further included multiple sociodemographic control variables in order to better isolate the relationship between food security and food benefit programing on risk for experiencing depressive symptoms.
Regarding clinical implications, our results suggest that when controlling for other relevant sociodemographic variables very low food security is consistently associated with increased odds of depressive symptoms compared with food secure households highlighting the importance of screening and intervention. In order to address the Healthy People 2020 goal of reducing hunger and very low food security nurses and public health professionals can address food insecurity and promote health equity through screening, education, referral (community based and government food benefit programs), and the implementation of evidence-based interventions (Flores & Amiri, 2019). Additionally, our results have policy implications as food benefit participation in itself was not associated with a reduction in risk of experiencing depressive symptoms suggesting that individuals may require further support through the shifting policy landscape that is food benefit eligibility. Future longitudinal studies that include the perception of participants may lead to the development of evidence-based programs with improved efficacy in reducing the stressors and stigma-associated with food benefit participation and also risk for depressive symptoms.
Conclusions
The purpose of this study was to explore the relationships of food security and food benefit participation with the risk for elevated depressive symptoms using nationally representative samples from the CDC’s NHANES 2013-2014 and 2015-2016 cohorts. Our findings suggest that after controlling for relevant sociodemographic variables very low food security was consistently significantly associated with experiencing elevated depressive symptoms compared with food secure households. Low food security is associated with both a reduction in food intake as well as diets that are more likely to contain less nutritious foods (Gregory et al., 2019). Food benefit participation was not significantly associated with a decrease in risk of depressive symptoms, but the majority of the results reflected an increase in the magnitude of odds ratios for those who participate in SNAP benefit programs compared with those who did not. Future research is suggested for studies that address other biological and psychological facets of food security including the role of diet and inflammation as a potential mechanism in developing depressive symptoms as well as the perception of food benefit participation. Our study contributes to the literature by providing both clinical and policy implications in order to address the Healthy People 2020 goals of reducing hunger and very low food security. Nurses and public health professionals can aid in this process by understanding both screening and referral processes as well as food benefit eligibility requirements.
Footnotes
Acknowledgements
The authors wish to thank the following individuals who provided support and feedback throughout the development of this article: Dr. Eric Hodges, Karen Armijos, Lilian Bravo, Crisma Emmanuel, Shaimaa Hatab, Charity Lackey, Alasia Ledford, and Kelly Tan.
Author Roles
HA, TAS, and HPS designed the study. HA and TAS were involved in data management, processing and/or quality assurance, and performed the statistical analyses and/or made tables. All authors contributed to the interpretation of the results. HA wrote the first draft of the manuscript. All authors contributed to and have approved the final manuscript.
Declaration of Conflicting Interests
The author(s) declared no potential conflicts of interest with respect to the research, authorship, and/or publication of this article.
Funding
The author(s) disclosed receipt of the following financial support for the research, authorship, and/or publication of this article: This study did not receive any external funding.