
Abstract
Objectives:
The US government implemented the Hospital Readmission Reduction Program on 1 October 2012 to reduce readmission rates through financial penalties to hospitals with excessive readmissions. We conducted a pooled cross-sectional analysis of US hospitals from 2009 to 2015 to determine the association of the Hospital Readmission Reduction Program with 30-day readmissions.
Methods:
We utilized multivariable linear regression with year and state fixed effects. The model was adjusted for hospital and market characteristics lagged by 1 year. Interaction effects of hospital and market characteristics with the Hospital Readmission Reduction Program indicator variable was also included to assess whether associations of Hospital Readmission Reduction Program with 30-day readmissions differed by these characteristics.
Results:
In multivariable adjusted analysis, the main effect of the Hospital Readmission Reduction Program was a 3.80 percentage point (p < 0.001) decrease in readmission rates in 2013–2015 relative to 2009–2012. Hospitals with lower readmission rates overall included not-for-profit and government hospitals, medium and large hospitals, those in markets with a larger percentage of Hispanic residents, and population 65 years and older. Higher hospital readmission rates were observed among those with higher licensed practical nurse staffing ratio, larger Medicare and Medicaid share, and less competition. Statistically significant interaction effects between hospital/market characteristics and the Hospital Readmission Reduction Program on the outcome of 30-day readmission rates were present. Teaching hospitals, rural hospitals, and hospitals in markets with a higher percentage of residents who were Black experienced larger decreases in readmission rates. Hospitals with larger registered nurse staffing ratios and in markets with higher uninsured rate and percentage of residents with a high school education or greater experienced smaller decreases in readmission rates.
Conclusion:
Findings of the current study support the effectiveness of the Hospital Readmission Reduction Program but also point to the need to consider the ability of hospitals to respond to penalties and incentives based on their characteristics during policy development.
Keywords
Introduction
The Centers for Medicare and Medicaid Services (CMS) define a hospital readmission as an admission to either the original discharging hospital or another CMS qualified acute inpatient hospital within 30 days of an initial hospitalization.1,2 Readmission rates are frequently used as an important measure of hospital quality, with higher rates potentially reflecting failures of care coordination and inadequate support following the initial hospital discharge. 3 Readmissions are associated with increased cost to the US healthcare system and undesirable outcomes for patients such as disruption of routines, increased stress, and increased chance of hospital-acquired illness.3–6 In response to these financial and quality of care ramifications, CMS identified hospital readmission rate reduction as a national priority and in 2009 began requiring public reporting of readmission rates.1,2
In addition to requiring hospitals to make 30-day readmission rates publicly available in 2009, the federal government added legislation to the Patient Protection and Affordable Care Act to implement the Hospital Readmission Reduction Program (HRRP) starting in fiscal year 2013 (1 October 2012) in an effort to further reduce readmission rates.1,2 Initially, the HRRP authorized CMS to reduce payments to hospitals who have excessive readmission rates for acute myocardial infarction (AMI), congestive heart failure (HF), and pneumonia (PN).1,2 Risk-adjusted hospital readmission rates are compared to national averages, and hospitals with excess readmissions were assessed up to a 1%, 2%, or 3% decrease in discharge base payment for fiscal years 2013, 2014, and 2015, respectively.1,2,7
With the public reporting of 30-day readmission rates and financial incentives for hospitals tied to these rates under HRRP, more attention was paid to 30-day readmissions by hospitals. 3 For instance, a previous study reported a decrease in hospital readmissions from 2007 to 2015 for a composite outcome of AMI, HF, and PN and a statistically significant association between HRRP and readmission rates. 8 However, the authors did not report results of AMI, HF, and PN readmission subgroups, separately. 8 Also, the associations between hospital and market characteristics and changes in readmission rates over time were not reported. While several authors have reported factors associated with changes in 30-day readmission rates prior to and following HRRP,9–13 they only include a limited set of covariates (i.e., only hospital or only limited hospital and market characteristics), and in some cases are not nationally representative, only include one 30-day readmission outcome, or are cross-sectional and do not assess the effects of HRRP on 30-day readmission rates. Identifying characteristics that may be associated with the ability of hospitals to effectively reduce readmissions in response to financial penalties has implications for future incentive-driven programs. 14 Therefore, the purpose of this manuscript is to examine readmission rates from 2009 to 2015 among US hospitals overall and for AMI, HF, and PN subgroups, the association of hospital (i.e., ownership, average bed size, system affiliation, location, etc.) and market characteristics (competition, supply of primary care doctors, per capita income, etc.) with 30-day readmission rates, and whether specific hospital and market characteristics were associated with a change in readmission rates during the timeframe of this study.
Methods
Data and sample
We conducted a pooled cross-sectional analysis of US hospitals from 2009 to 2015 using merged data from CMS Hospital Compare, 15 the American Hospital Association Annual Survey Database (AHA), 16 and the Area Health Resource File (AHRF). 17 We focused on this time period in order to determine the short-term effects of the HRRP policy. Data were linked using Provider IDs and FIPS codes. In order to be included in the sample, hospitals had to have two or more of the AMI, HF, and PN readmission rates available in each year from 2009 to 2015. We excluded Veterans Health Administration hospitals because HRRP penalties do not apply to these hospitals. 18 Hospital Compare data contains risk-standardized hospital level 30-day readmission rates for patients admitted for AMI, HF, and PN. 19 AHA data was utilized to obtain hospital-level organizational characteristics. The AHRF contains variables that were used to determine market characteristics in the hospital external environment. We did not submit this research to an Institutional Review Board or Independent Ethics Committee. Ethical approval and informed consent were not sought for the present study because we utilize deidentified, publicly available data (https://www.hhs.gov/ohrp/sites/default/files/human-subject-regulations-decision-charts-2018-requirements.pdf).
Dependent variable
A composite outcome of hospital 30-day readmission rates was created by averaging all available readmission rates for AMI, HF, and PN, provided two or more of the AMI, HF, and PN readmission rates were available in each year from 2009 to 2015. We refer to this composite outcome throughout the manuscript as overall 30-day readmissions since these were the targeted conditions of the HRRP penalties.1,2 However, it is important to note that this outcome does not represent all readmissions to hospitals. We also included AMI, HF, and PN, separately, as dependent variables. Rates of 30-day readmission provided in the Hospital Compare dataset are risk-adjusted for patient characteristics such as age, sex, medical history, and other comorbidities which may be associated with risk of readmission.20,21
Independent variable
We included an indicator variable for HRRP as the main independent variable. To create the HRRP indicator variable, we categorized years 2009–2012 as “before” HRRP. These years were assigned a “0.” The years after HRRP, 2013–2015, were categorized as “after” HRRP and assigned a “1.”
Covariates
Hospital characteristics: Hospital-level organizational characteristics including system affiliation (nonmember, member), hospital ownership type (for-profit, not-for-profit, and government hospitals), teaching status (yes, no), location (metro, urban nonmetro, rural), bed size (small < 100; medium 100–249; large ⩾ 250), staffing ratio for registered nurses (RNs) and licensed practical nurses (LPNs), separately, Medicare share (percentage of inpatient days for Medicare patients), Medicaid share (percentage of inpatient days for Medicaid patients), and operating margin (operating income/operating revenue).
Market characteristics: County level market characteristics included competition and the percentage of residents in the market who were Black, Hispanic, ⩾65 years of age, living in poverty, uninsured, unemployed, and with a high school education or more. The number of primary care physicians (PCPs) per 10,000 people was also obtained from the AHRF. Hospital competition was defined using the Herfindahl-Hirschman index (HHI). This was calculated using AHA data at the health service area level. Briefly, it was calculated as the sum of the squared market share of inpatient days based on each hospital in the market.22,23
Statistical analyses
All analyses were conducted for 30-day readmission rates overall, and for subgroups of AMI, HF, and PN readmission rates, separately. We calculated descriptive statistics for hospital and market characteristics by included and excluded status from the sample. Characteristics of included and excluded hospitals were compared using Chi-square tests for dichotomous variables and t-tests for continuous variables. Unadjusted overall 30-day readmission rates were calculated by calendar year. Rates of 30-day readmission were also calculated by hospital and market characteristics and presented for the years 2009–2011, 2012, and 2013–2015. Statistical significance of readmission trends across years and differences in rates within variable categories was determined using ANOVA. p-Values from this analysis were Bonferroni adjusted using the “Bonferroni” command in STATA. 24
To determine the association of the HRRP with readmission rates, we conducted multivariable linear regression with year and state fixed effects. 25 Including year and state fixed effects in the model accounts for underlying year and state level variation in readmission rates. The model was adjusted for the hospital and market characteristics listed above. To determine if hospital and market characteristics were associated with a smaller or larger change in readmission rates over time, we included interaction effects of hospital and market characteristics with the HRRP indicator variable in the model. Hospital and market characteristics were lagged by 1 year. We accounted for heteroscedasticity and non-independence of repeated hospital measurements over time by clustering observations at the hospital level. 26 All analysis were conducted in STATA version 17.0.
Sensitivity analysis
We repeated the main analysis excluding Critical Access Hospitals. Although the HRRP was not implemented until October of 2012, hospitals may have made efforts to improve 30-day readmission rates before implementation of the HRRP to avoid financial penalties. 8 Therefore, we also repeated the multivariable regression described above using an indicator variable with three levels for the HRRP dummy: prior to implementation (2009, 2010, and 2011), transition period before implementation (2012), and the years after implementation (2013, 2014, and 2015).
Results
Out of a possible 5889 hospitals, the current study included 3126 hospitals with complete information on the composite variable of overall 30-day readmission rates and hospital and market characteristics included in the model. The number of hospitals with complete information for subgroups of AMI, HF, and PN readmission rates was 1844, 3142, and 3432, respectively. Hospitals included in the analytic sample were predominantly system members, not-for-profit, non-teaching, and in a metro location (Table 1). On average, the hospitals were in markets with 11.2% and 10.8% Black and Hispanic residents, respectively, 14.4% of the population >65 years of age, 16.1% with income below the poverty level, 17.6% without insurance, 9.3% unemployment, 84.5% with a high school education or more, and 7.2 PCPs per 10,000 people. Hospital and market characteristics of included and excluded hospitals were similar except hospitals excluded from the analysis were less likely to be members of a hospital system, not-for-profit, teaching, and medium and large sized compared with included hospitals. They also had lower operating margins compared with included hospitals. Hospital and market characteristics of included and excluded hospitals for subgroups of AMI, HF, and PN are presented in Supplemental Table 1.
Hospital and market characteristics for included and excluded hospitals (year = 2009).

SD: standard deviation; RN: registered nurse; LPN: licensed practical nurse; HHI: Herfindahl-Hirschman index; PCP: primary care physician.
A composite outcome of hospital 30-day readmission rates was created by averaging all available readmission rates for AMI, HF, and PN, provided two or more of the AMI, HF, and PN readmission rates were available in each year from 2009 to 2015.
Unadjusted rates of overall 30-day readmissions declined from 21.2% in 2009 to 19.0% in 2015, p < 0.001 (Figure 1). Readmission rates for subgroups of AMI, HF, and PN decreased from 19.9% to 16.9% (p < 0.001), 24.7% to 21.9% (p < 0.001), and 18.3% to 16.9% (p < 0.001), respectively. Unadjusted readmission rates for all hospital and market characteristics declined over the study period (Supplemental Table 2). ANOVA Bonferroni post hoc analysis found that in 2013–2015 following the implementation of HRRP, among hospital characteristics, rural hospitals, and hospitals in the lowest tertiles of RN staffing ratio had higher readmission rates compared to their counterparts. For market characteristics, in 2013–2015, hospitals in markets with the highest tertiles of Black residents, residents in poverty, and unemployment, and those in the lowest tertile of high school or more education had higher readmission rates compared to their counterparts (Supplemental Table 2).
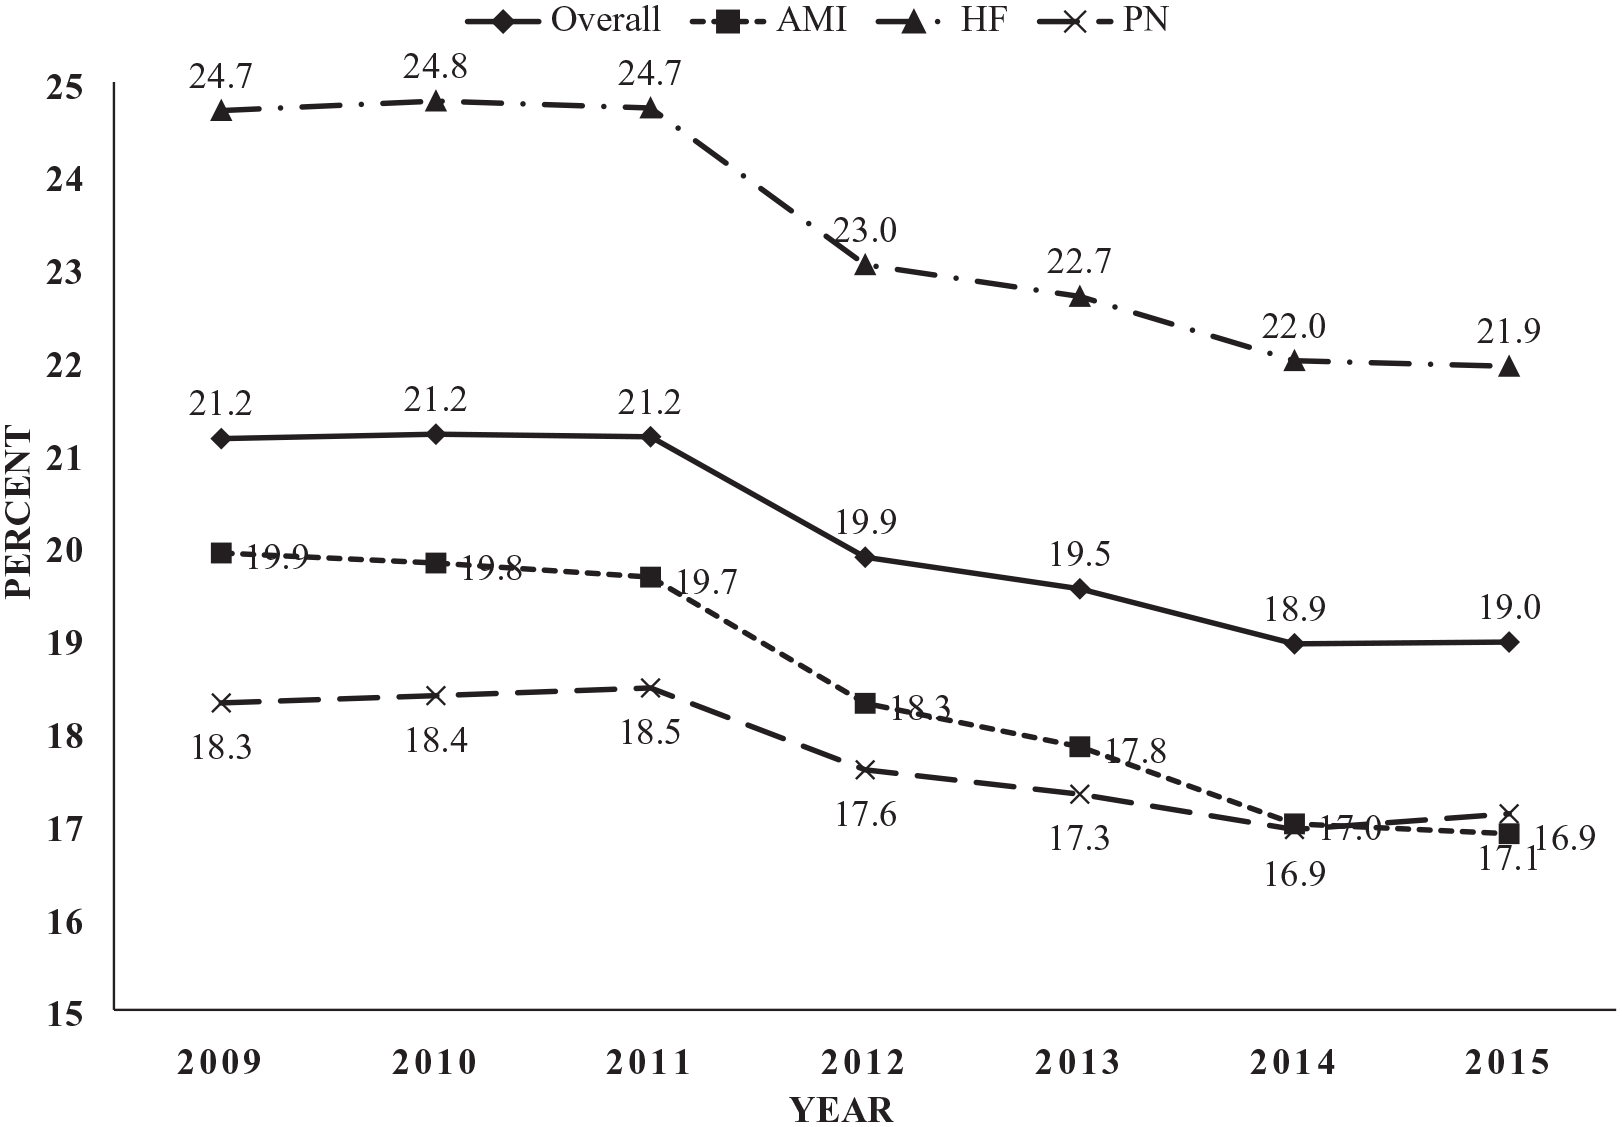
Unadjusted 30-day readmission rates, by calendar year.
In multivariable adjusted analysis which included the HRRP indicator variable and interactions between the HRRP and hospital and market characteristics, the main effect of HRRP was a 3.80 percentage point (p < 0.001) decline in readmission rates in 2013–2015 relative to the 2009–2012 period prior to implementation (Table 2). A decline in readmission rates for subgroups of AMI (β = −4.34, p < 0.01), HF (β = −5.33, p < 0.01), and PN (β = −2.81, p < 0.01) were also observed following implementation of HRRP.
Main and interaction effects for the association of the hospital readmission reduction program, hospital, and market characteristics with 30-day readmission rates.

AMI: acute myocardial infarction; HF: heart failure; PN: pneumonia; RN: registered nurse; LPN: licensed practical nurse; HHI: Herfindahl-Hirschman index; PCP: primary care physician.
Models were adjusted for all variables and interactions with HRRP listed in the methods section.
A composite outcome of hospital 30-day readmission rates was created by averaging all available readmission rates for AMI, HF, and PN, provided two or more of the AMI, HF, and PN readmission rates were available in each year from 2009 to 2015.
p < 0.001, **p < 0.01, *p < 0.05.
Overall, hospitals with lower readmission rates included not-for-profit (β = −0.306, p < 0.001) and government (β = −0.250, p < 0.001) hospitals compared with for-profit hospitals and medium (β = −0.352, p < 0.001) and large hospitals (β = −0.537, p < 0.001) compared with small hospitals (Table 2—Main Effects). Higher hospital readmission rates were observed among those with higher LPN staffing ratio (β = 0.242, p < 0.01), Medicare share (β = 0.004, p < 0.01), and Medicaid share (β = 0.007, p < 0.001). For market characteristics, a larger percentage of Hispanic residents (β = −0.004, p < 0.001), population 65 years and older (β = −0.020, p < 0.001), and higher poverty (β = −0.009, p < 0.001) were associated with lower readmission rates. Less competition (β = 0.105, p < 0.05) was associated with higher readmission rates. Statistical significance and direction of these associations was also similar for subgroups of AMI, HF, and PN.
Statistically significant interaction effects between hospital characteristics and the HRRP on the outcome of 30-day readmission rates were present (Table 2—Interaction Effects). Only statistically significant main and interactions effects are presented in Table 2. Teaching hospitals (β = −0.163, p < 0.01) and rural hospitals (β = −0.285, p < 0.01) experienced larger decreases in readmission rates over the study timeframe compared with their counterparts. Hospitals with larger RN staffing ratios (β = 0.151, p < 0.01) experienced smaller decreases in readmission rates over the study timeframe. When examining interaction effects between market characteristics and the HRRP on the outcome of 30-day readmission rates, hospitals in markets with a higher percentage of residents who were Black (β = −0.006, p < 0.001) had a larger decrease in readmission rates over the study timeframe compared to markets with a lower percentage of Black residents. Uninsured rate (β = 0.016, p < 0.01) and percentage of residents with a high school education or greater (β = 0.016, p < 0.01) were associated with a smaller decrease in readmission rates over time. Statistical significance and direction of these associations was also similar for subgroups of AMI, HF, and PN. Overall, there were no associations between system affiliation, operating margin, unemployment rate, or PCPs per 10,000 people with changes in 30-day readmission rates (Supplemental Table 3).
When Critical Access Hospitals were excluded in sensitivity analysis, the direction and statistical significance of associations between variables included in the analysis and 30-day readmission rates were very similar to the main analysis (Supplemental Table 4). There were several differences between this analysis and the main analysis. The magnitude of association between HRRP and 30-day readmission was larger (β = −4.56, p < 0.001). Also, the main effect of operating margin (β = 0.42, p < 0.01) became statistically significant. The interaction term for the association of teaching hospital status and HRRP with 30-day readmission was no longer statistically significant. The interaction term for the association of unemployment (β = 0.029, p < 0.05) and HRRP with 30-day readmission became statistically significant. In additional sensitivity analysis, we utilized three time periods for the HRRP indicator variable; prior to implementation of HRRP (2009, 2010, and 2011), transition to HRRP (2012), and after implementation of HRRP (2013, 2014, and 2015). Overall, there was a statistically significant change in 2012 compared with 2009–2011 (β = −1.75, p < 0.05), and there was a decrease in readmissions in 2013–2015 compared to 2009–2011 (β = −4.12, p < 0.001) (Supplemental Table 5). For AMI and HF, there was a decrease in rates from 2013 to 2015 compared to 2009–2011 (β = −4.57, p < 0.001, β = −5.22, p < 0.001, respectively). For PN, compared to 2009–2011, rates decreased in 2012 (β = −2.46, p < 0.01) and from 2013 to 2015 (β = −4.16, p < 0.001).
Discussion
Among a large sample of US hospitals, we identified a decrease in unadjusted rates of 30-day readmissions overall, by hospital and market characteristics, and for subgroups of AMI, HF, and PN from 2009 to 2015. In multivariable adjusted analyses, 30-day readmission rates were lower in the 2013–2015 post-HRRP period compared to 2009–2012. We identified several hospital and market characteristics associated with 30-day readmission rates over the entire study period. Finally, we observed interaction effects between implementation of the HRRP and hospital and market characteristics on the outcome of 30-day readmission, suggesting that hospitals differed in their ability to reduce readmissions in response to the HRRP penalties based on hospital and market characteristics.
The decrease in overall 30-day readmission rates of 2.2 percentage points from 2009 to 2015 among US hospitals was similar to prior research. 8 This suggests success of the HRRP, which was aimed at reducing hospital readmissions through the use of financial reimbursement penalties.1,2 A decrease in unadjusted rates of 30-day readmissions was present within all subgroups of hospital and market characteristics examined in the current manuscript as well, suggesting hospitals reduced their readmission rates over this timeframe regardless of their characteristics. However, hospitals with lower available resources (i.e., low RN staffing ratio) and in markets with residents with fewer socioeconomic resources (i.e., high poverty, high unemployment, and low education) had higher unadjusted rates of readmissions overall in 2013–2015 compared to their counterparts.
In multivariable adjusted analysis, higher LPN staffing ratio, Medicaid share, and Medicare share were associated with higher 30-day readmission rates over the entire study period. Data on the association of LPNs with quality outcomes is mixed; however, it is possible that larger LPN ratios are a result of staffing fewer RNs which could result in lower quality of care during a hospitalization.27,28 For Medicaid share, several studies have reported higher 30-day readmission rates among Medicaid beneficiaries.29,30 This higher rate has been attributed to larger numbers of chronic conditions and lower socioeconomic status among Medicaid beneficiaries.29,30 Similarly, for Medicare share, prior studies report higher 30-day readmission rates.31,32 In contrast, not for-profit and government hospitals and medium and large hospitals were associated with a lower rate of 30-day readmission over the entire study period. 33 Compared to not-for-profit and government hospitals, for-profit hospitals may be focused on improvements in other areas or perhaps focus more on efficiency (reduced length of stay) than not-for-profit hospitals.34,35
For market characteristics, a higher percentage of individuals with Hispanic ethnicity was associated with a statistically significantly lower rate of readmissions; however, the magnitude of the effect was small. Prior studies report that as the proportion of Spanish language-preferring Hispanic beneficiaries increases among Medicare Advantage plans, disparities in care experience decrease. 36 This is potentially due to an increase in Spanish language services among these plans as well as the potential for more culturally competent care. An increase in the percentage of the population 65 years of age and older and poverty was associated with lower readmission rates. Eligibility of Medicare beneficiaries for readmission reduction interventions, the focus of HRRP penalties among Medicare beneficiaries, and enhanced discharge planning for older adults may explain this finding.8,31,37–39 Finally, less market competition was associated with higher levels of 30-day readmissions. This finding has been previously explained by greater incentives for hospitals in markets with more competition to improve quality of care to attract patients.40,41
Interactions
Our study also examined the effect of interactions between hospital and market characteristics with the implementation of HRRP on 30-day readmissions. This approach allowed us to determine whether there were hospital and market characteristics that were associated with a larger or smaller 30-day readmission rate decrease following the implementation of the HRRP. These results can provide insights into which hospitals may be more responsive to such programs in the future and characteristics of organizations that may struggle to implement changes.
For hospital characteristics, larger RN staffing ratios were associated with a smaller decrease in readmission rates compared to their counterparts during the study timeframe. However, RN staffing ratios may be a proxy for hospital quality. 33 Larger RN staffing ratios can allow nurses more time to interact with patients and provide higher quality care in the form of increased patient surveillance, direct patient care, patient and family education of discharge instructions, and potential follow up with patients after discharge.33,42 Readmission rates in hospitals with higher RN staffing ratios were already low prior to HRRP. Therefore, the smaller decrease in rates may have been due to the lower rates of readmissions in these hospitals at baseline compared with their counterparts. Teaching hospitals, rural hospitals, and medium and large hospitals had a larger decrease in readmission rates over time compared with their counterparts. Although the larger decrease in readmission rates over time for teaching and rural hospitals is encouraging, following HRRP, both teaching and rural hospitals still had a higher rate of readmission compared to their counterparts, similar to previous literature.43–45 Future studies could explore the methods these hospitals used to decrease readmission rates.
For market characteristics, uninsured rate and percentage of residents with a high school education or greater were associated with a smaller decrease in readmission rates compared to their counterparts during the study timeframe. Prior studies report higher levels of 30-day readmissions among individuals with no insurance compared with private insurance. 30 Additionally, uninsured rate is a proxy for lower socioeconomic status, 14 and researchers report that hospitals in higher resourced communities are associated with higher quality care.46,47 This may be the result of residents in these areas having resources which allow them to adhere to discharge plans, purchase medication and medical supplies, and have more access to regular preventative care. 44 Previous literature reports an inverse association between education level and readmission rates.9,48 The finding of the current study that education was associated with a smaller decrease in readmission rates is likely due to having lower rates of readmissions prior to HRRP for hospitals in these areas as we report in the current study. Hospitals in areas with low-resourced residents may need to engage in more support services, follow up, outreach and education with the community to improve readmission rates.
Hospitals in markets with a higher percentage of residents who were Black had a larger decrease in readmission rates over time compared with their counterparts. While markets with a larger proportion of Black residents experienced larger declines in readmission rates, the unadjusted rates in these areas following implementation of the HRRP were still higher compared to their counterparts similar to prior studies. 49 The more rapid decrease in readmission rates likely reflects the higher readmission rates at baseline and resulting larger opportunity for quality improvement. This finding adds to previous literature on disparities in health care related to Black race as well as poverty and education,50–53 and highlight an opportunity for improvement in the care of patients in these communities. Future work may wish to explore the reasons for these continued disparities and how best to improve care related to hospitals involvement in communities and national health policy recommendations.
Our study is not without limitations. First, while the AHA data includes a nationally representative sample of hospitals and we include state fixed effects in the multivariable adjusted model to account for the potential influence of readmission trends aside from HRRP, ultimately, we use a cross-sectional study design. Therefore, the results of the current manuscript cannot be interpreted causally. Second, readmissions are a complex metric that are difficult to adjust for patient severity. However, the Hospital Compare data on readmission rates were risk-adjusted by CMS for patient severity before being reported. Finally, although we have information on sociodemographic market characteristics in the area surrounding hospitals, we did not have data on the actual patient population served by hospitals.
Conclusions
Our evaluation of the HRRP demonstrates that hospitals showed a decrease in readmissions over the study period overall, for three separate clinical areas (AMI, HF, and PN), and for all subgroups of hospital and market characteristics. These findings support the effectiveness of the HRRP. An additional contribution of this study was to identify several hospital and market characteristics associated with varying levels of decrease in readmissions. This suggests that hospitals responded differently to HRRP penalties based on hospital and market characteristics. Finally, hospitals in low-resourced areas had higher levels of readmissions in 2013–2015 compared to their counterparts suggesting that while the HRRP is associated with a decrease in readmission rates for all hospitals on average, quality of care received by adults in lower-resourced areas is still worse than their counterparts.
Supplemental Material
sj-docx-1-smo-10.1177_20503121231220815 – Supplemental material for Association of hospital and market characteristics with 30-day readmission rates from 2009 to 2015
Supplemental material, sj-docx-1-smo-10.1177_20503121231220815 for Association of hospital and market characteristics with 30-day readmission rates from 2009 to 2015 by Gabriel S Tajeu, Ganisher Davlyatov, David Becker, Robert Weech-Maldonado and Abby Swanson Kazley in SAGE Open Medicine
Footnotes
Acknowledgements
Not applicable.
Author contribution
All authors adhered to the International Committee of Medical Journal Editors authorship criteria which includes, substantial contributions to the conception or design of the work (all authors); or the acquisition, analysis, or interpretation of data for the work (all authors); and drafting the work or reviewing it critically for important intellectual content (all authors).
Declaration of conflicting interests
The author(s) declared no potential conflicts of interest with respect to the research, authorship, and/or publication of this article.
Funding
The author(s) disclosed receipt of the following financial support for the research, authorship, and/or publication of this article: Gabriel S. Tajeu’s effort was supported by NIH/NHLBI grant number 1K01HL151974-01.
Supplemental material
Supplemental material for this article is available online.
References
Supplementary Material
Please find the following supplemental material available below.
For Open Access articles published under a Creative Commons License, all supplemental material carries the same license as the article it is associated with.
For non-Open Access articles published, all supplemental material carries a non-exclusive license, and permission requests for re-use of supplemental material or any part of supplemental material shall be sent directly to the copyright owner as specified in the copyright notice associated with the article.