
Abstract
Nationalization of local party systems takes place in several countries. However, in the Netherlands, this process shows signs of reversal. Using data from seven municipal elections between 1998 and 2022, we observe that the local party system nationalization index decreases considerably over time, meaning more independent local parties in the local council. In addition to size, we find that rurality and center-periphery differences are important determinants of reverse nationalization. More specifically, we observe that a greater distance to the political center in the Netherlands is associated with less nationalization. In addition, more localization is found in municipalities that were recently part of a merger, except where a small municipality is merged with a much larger one.
Keywords
Introduction
Nationalization of local party systems has received growing scholarly attention in recent years. In the literature, the concept of nationalization is mostly linked to “the degree to which the local party system resembles the national party system at one point in time” (see Kjaer and Elklit 2010a). This approach is rooted in Rokkan's seminal work (1966), which discusses the nationalization of the local party system through the concept of “politicization.” “Politicization” describes a dynamic process through which the local party system increasingly duplicates the national party-political system because of national politics increasingly taking over local dynamics. In his view, this process would closely follow that of modernization and national integration. Gradually, national parties become better suited to organizing electoral competition in local areas, at the expense of independent local parties. However, while Rokkan's theory helped to understand the party system formation from the 19th century until the 1970s, empirical evidence for increasing local party system nationalization in recent decades is mixed. Based on time series data between 1937 and 2003 from Norwegian local elections, Aars and Ringkjøb (2005) claim that the non-partisan lists had a stronger mobilizing potential at the beginning of this century than they had in the past. Based on 10 Danish elections between 1966 and 2005, Kjaer and Elklit (2010b) show that their index of local party system nationalization (between 0, where only independent local parties are elected, and 1, where only national parties are elected), which in 1966 averaged 0.23, has increased over the four subsequent decades to 0.71 in 2005, leaving Denmark with a far more nationalized local party system than ever before. However, when dividing Denmark into three regions, they also found large cross-regional variation. Whereas nationalization was highest in the center (Greater Copenhagen), it was lowest in the periphery (Jutland), with the rest of the island of Zealand and the other major Danish islands scoring in between. Studying local elections in Austria between 1985 and 2009, Ennser-Jedenastik and Hansen (2013) did not find any evidence that the Austrian local party systems had become more nationalized over time. Moreover, they also found indications for cross-regional variation in the index of local party system nationalization. This cross-regional element is investigated further in Dodeigne, Close, and Teuber (2021) in a study of Belgium, which is a federal country divided into three regions. Based on local elections between 1976 and 2018, they show that the degree of nationalization is relatively low in Belgium, with Wallonia presenting the lowest degree of nationalization (index of 0.19), followed closely by Brussels (index of 0.26) and Flanders (index of 0.44). In addition, their empirical results highlight the positive relationship of the index to municipal size, with no clear trend over time.
In the Netherlands, local parties are on the rise (Boogers and Voerman 2010; Gradus, Dijkgraaf, and Budding 2023). Using data from municipal elections between 1998 and 2022, we find that our index for local party system nationalization decreased from 0.41 in 1998 to 0.27 in 2022. The goal of our article is to explore which factors influenced this development; therefore, our research question is: how do size, rurality, distance to the administrative center, and amalgamations of municipalities influence local party nationalization? To the best of our knowledge, we are the first to analyze these determinants. Our justification of the four possible factors is as follows. First, size can be an important explanation, as in small Dutch municipalities, independent local parties perform better (Gradus, Dijkgraaf, and Budding 2023). Second and third, while De Lange, van der Brug, and Harteveld (2023) show that regional resentment is especially strong in areas located further from the political and cultural, economic center and in rural areas, we explore if localization is a “rural” or “peripheral” phenomenon. Fourth, we investigate whether mergers have an effect on the extent of local party system nationalization. We expect that independent local parties can be formed to defend the interests of amalgamated villages. Notably, in the Netherlands, mergers are an ongoing phenomenon with a limited number each year, whereas in Belgium and Scandinavian countries, big reforms have taken place.
This article is structured as follows. The “What can explain localization or nationalization?” section develops our hypotheses. The Dutch political context on the municipal level is described in the “Research context and method” section, thereby also calculating the indices for local party system nationalization. In the “Findings” section, we present our empirical findings. Concluding remarks and topics for future research are offered in the “Conclusion and Discussion” section.
What Can Explain Localization or Nationalization?
Size, Rurality, and Center-Periphery Distance
In the empirical literature, the relationship between the local nationalization index and the number of inhabitants as independent variables is estimated (Kjaer and Elklit 2010a, Ennser-Jedenastik and Hansen 2013, and Dodeigne, Close, and Teuber 2021). In all three studies, there is a clear and positive relationship between nationalization and inhabitants, i.e., the degree of local party system nationalization increases with municipal size. Given the restricted personnel and financial resources of national parties, we expect them to focus on larger municipalities in order to attract as many voters as possible. Additionally, national lists predominate in larger cities because cities present policy issues that overlap with national socio-economic cleavages (Dahl and Tufte 1973). Thus, we include the number of inhabitants (in logarithms) in our estimations. Notably, in the Netherlands, the number of inhabitants per municipality increased from 28,500 in 1998 to approximately 50,400 in 2022. There is increasing empirical evidence that inhabitants from rural areas in the Netherlands feel that people in urban areas do not respect their way of life, while inhabitants in peripheral areas may sense that those who live in the cultural and economic center of the country do not respect them enough (De Lange, van der Brug, and Harteveld 2023). Political discontent has been cited as one of the factors explaining the support for independent local parties (e.g., Otjes 2023). Therefore, it is interesting to investigate whether independent local parties are willing to capture rural or peripheral discontent. So, when trying to explain the nationalization index, a rural and center-periphery hypothesis is formulated: nationalization will be more prominent in the center, while in rural areas and the periphery, nationalization will be rarer. We formalize this periphery argument by measuring the distance of every Dutch municipality to the political center of the Netherlands, i.e., The Hague. 1 , 2 We expect that for municipalities that are further away from this center, the nationalization index will be lower. In addition, we formalize rurality by using the municipal average of the five-fold categorization based on the address density of inhabitants (between 1 (most urban) and 5 (rural)). 3 We also expect that the relationship between the index and rurality is negative.
Hence,
Amalgamations
Municipal amalgamations might have several results, including political and democratic effects (Tavares 2024). A potential effect of mergers is a lower perceived quality of local democracy. In several countries, indications are found that citizens are less satisfied with local democracy and how problems are handled, especially those living in smaller or peripheral parts (see Hansen 2015 for Denmark; Erlingsson et al. 2024 for Sweden). As Tavares (2024) indicates, one of the main sources of resistance to municipal amalgamations is the threat to local identity. Voda and Vodová (2025) show that this fear is justified as they find that the chances of a sub-municipal unit being mentioned in a local electoral manifesto are related to the presence of a candidate coming from that unit. Given that small and peripheral areas tend to lack representation, their interests may not be taken into consideration enough.
In 1998–2022, 171 mergers occurred in the Netherlands. Allers and Geertsema (2016) observe a great deal of variation in the kind of these mergers—the number of merged municipalities ranges from 2 to 6, and the size of municipalities involved largely varies. Importantly, they notice that municipal mergers can be enforced by the central government against the wishes of affected jurisdictions. We expect that the threat to local identity and its expected influence on the local party system nationalization will differ among mergers of varying sizes. We distinguish three kinds of mergers: annexations, mergers of municipalities of mixed sizes, and mergers of municipalities of more equal size. Following Allers and Geertsema (2016), we define an annexation as the absorption of a small municipality into a larger neighbor. According to the authors, annexations do not require setting up new organizational structures, whereas other mergers do require this. We think that a merger of the annexation type will not result in a lower nationalization index, as the number of inhabitants of the smallest former jurisdiction is simply too small to have an influence on the outcome of elections. Furthermore, the inhabitants of the larger jurisdiction may not feel a threat to their identity, as it may be expected that this municipality will not be restructured or implement large policy changes. Following Jakobsen and Kjaer (2016), we think that if a merger takes place between municipalities of mixed sizes, the population of the smaller municipality (or municipalities, if more than two entities are involved) may fear that it will be dominated by the larger population, power, and organization of the center of the new municipality. Furthermore, candidates from the smaller municipalities may benefit from institutional path-dependency (Jakobsen and Kjaer 2016). Former (i.e., before the amalgamation) branches of parties are likely to agree that the candidate positions on the ballot should be fairly distributed among the former jurisdictions instead of ranking them according to the size of the former jurisdictions. As such, candidates from small villages may have a higher chance of being elected. However, also following Jakobsen and Kjaer (2016), we expect that when former jurisdictions are more even in size, a substantial representation bias is not expected. In such cases, there is less fear that some parts of the former jurisdiction will be dominated by other parts because candidates are supposed to come from a range of areas within the newly formed jurisdiction.
Given the above-mentioned arguments, we developed hypotheses for the influence of being part of a merger (regardless of the kind of municipalities involved) and also for the three kinds of mergers we distinguished. When a municipality was part of a merger in the previous five years, it is allocated a dummy. We chose this five-year period as we can include two elections: one just before the time of the merger and one that takes place in the regular election years.
Hence,
Research Context and Method
Dutch Elections 1994–2022
In the Netherlands, there are three layers of government (central, provincial, and local). Subnational governments consist of twelve provinces and (in 2023) 342 municipalities.
The Netherlands has 150 seats in the directly elected House of Representatives. The election threshold is the number of votes that is necessary for the first seat (0.67% of the votes), thereby providing a low barrier for new parties to be elected. This is also visible in the substantial number of political parties in the House of Representatives (Table 1). In our observation period (1994–2022), this varies between 9 (after the elections in 1998 and 2003) and 17 (after the elections in 2021). Seven political parties are elected in all years: Conservative Liberals (VVD), Christian Democrats (CDA), Progressive Liberals (D66), Green Left (GL), Socialist Party (SP), Social Democrats (PvdA), and Reformed Political Party (SGP). In 2000, the parties RPF and GPV were merged into Christian Union (CU). In 2004, Geert Wilders left the parliamentary group of VVD and started a new party, PVV or Freedom Party. Since 2006, PVV has had representation in the House of Representatives. In 2012, a pensioner party (50PLUS) gained representation with two seats. In March 2017, two new parties (a party for minority rights (DENK) and the radical right-wing Forum for Democracy (FvD)) were elected.
Parties in the House of Representatives of the National Parliament (1994–2022).
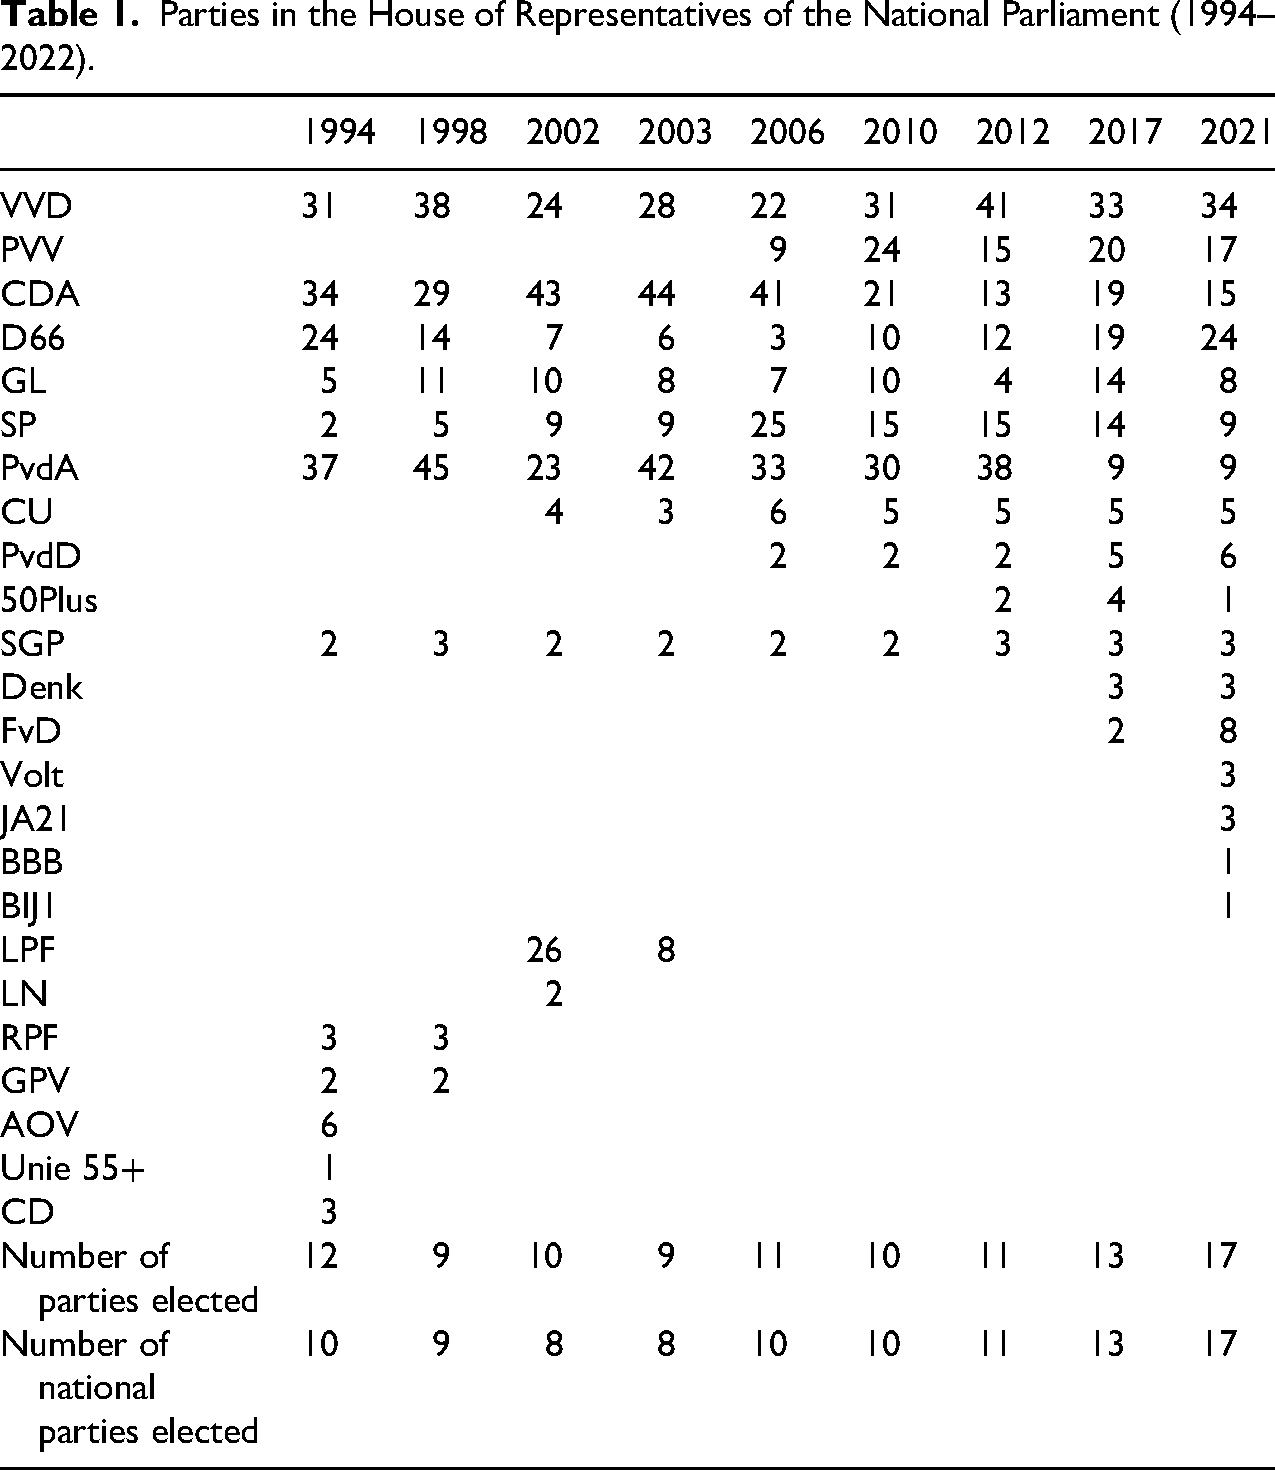
In March 2021, four new national parties were elected: a pan-European liberal party, Volt, a radical right-wing party JA21, a party for farmers and citizens (BBB), and a party for radical equality (BIJ1).
Table 1 presents the outcomes of the national elections between 1994 and 2022 and the number of national parties. We define national parties as having registered their name nationwide with the Electoral Council prior to a municipal election. In the last row of Table 1, we give the number of national parties registered for local elections and elected to the House of Representatives. Notably, the number of national parties in the House of Representatives increased from 8 in 2006 to 17 in 2021. Currently, the number of national parties elected in this house is fifteen.
Normally, Dutch municipal councils are elected every four years. In principle, elections in all municipalities are held on the same day in March. The electoral system is based on party-list proportional representation, with no threshold other than the natural threshold due to council size (i.e., total votes divided by number of seats). There is an exception: for small municipalities with less than 19 seats (or 20,001 inhabitants), parties with more than 75% of the natural threshold can win a residual seat. National parties have the possibility of running in every municipality; in almost all municipalities, the main established parties (CDA, VVD, and PvdA) do so. Normally, lists are presented in accordance with the number of votes in the past election; new political parties are displayed in a random order. For new local parties it is relatively easy to participate in an election as the main criteria to do so are (only) that a political party should have the legal form of a formal association, a small deposit should be secured, and a limited number (between 10 and 30, dependent on the size of the municipality) of individual support statements should be handed in. This makes the Dutch system relatively open to the formation of new and independent local parties. After every local election, aldermen are appointed by the municipal council. The board of mayors and aldermen is responsible for the preparation and execution of policies. 4
The number of council seats varies between 9 (for municipalities with less than 3,001 inhabitants) and 45 (for municipalities with more than 200,001 inhabitants). Therefore, the threshold due to council size ranges from 2% for large cities with 45 seats and 8.25% for small municipalities. Due to mergers, the number of municipalities has decreased from 548 in 1998 to 345 in 2022, thereby giving a yearly average decline of 8.25. In the same period, the total number of seats on local councils has decreased from 10,129 to 8,531. Data about the number of seats of different parties in the election years 1998, 2002, 2006, 2010, 2014, and 2018 were collected from the Gids Gemeentebesturen (Guide to Municipal Boards). 5 Data for the results of the 2022 municipal council elections were gathered from the election results published on the website of NOS Nieuws, i.e., the news website of the Dutch public broadcasting organization. 6 For this election, we have information on the running lists and the seats won by different parties. Sometimes, a combination of political parties ran together in the election. In such a case, the number of seats is divided equally between these parties.
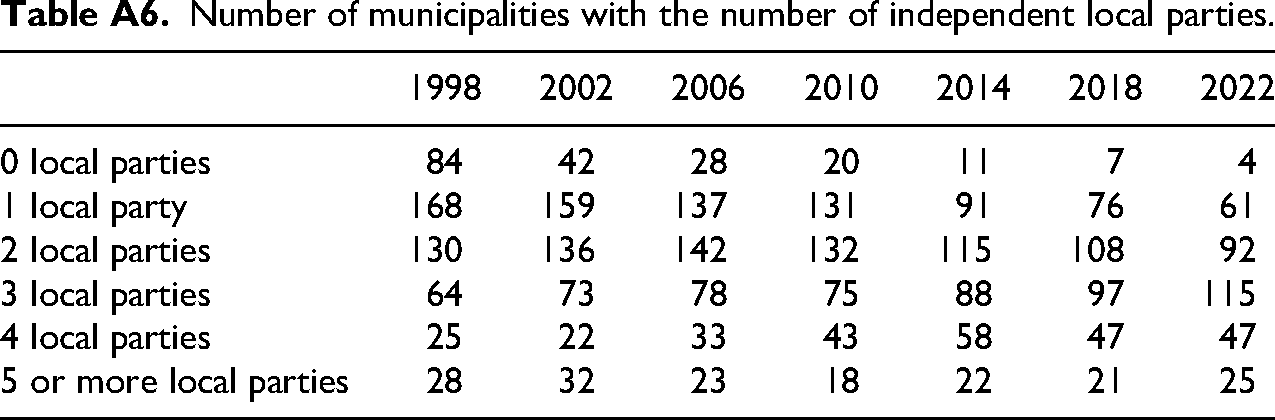
On average, the number of local political parties per municipality increased from 1.75 in 1998 to 2.65 in 2022. In 1998, more than 80 Dutch municipalities did not have a local party; in 2022, this had decreased to 4. 7 Remarkably, the share of municipalities with three or more local parties increased from less than 20% in 1998 to more than 50 in 2022.
Index of Local Party System Nationalization for Dutch Municipalities
In this article, we follow the approach espoused by Kjaer and Elklit (2010a) who argue that it is not enough to look solely at the number of local parties contesting an election but also at the extent to which national parties are elected. Kjaer and Elklit (2010a) calculated an index for both the number of political parties running and those being elected. As we only have information on political parties elected in Dutch municipalities for most election years, we present the second one. The parameters for the index of local party nationalization are as follows:
number of local parties represented in a municipal council, number of national parties represented in a municipal council, number of (registered) national parties elected in a parliamentary election, total number of parties elected to a municipal council (a + b), potential number of parties (a + c), proportion of national parties elected to the municipal council (b/c), proportion of local parties elected to the municipal council (a/d), index of local party system nationalization (b/e).
Models
Based on our discussion of the center-periphery, rurality, size, amalgamation, and time, we estimated two models. In the first model, inhabitants, rurality, distance, and a merger dummy are included. The dummy is one where a merger took place in recent years (five years or earlier). In the second model, five dummies with types of mergers are distinguished. Furthermore, we also include the elections years as dummies.
The following models will be estimated: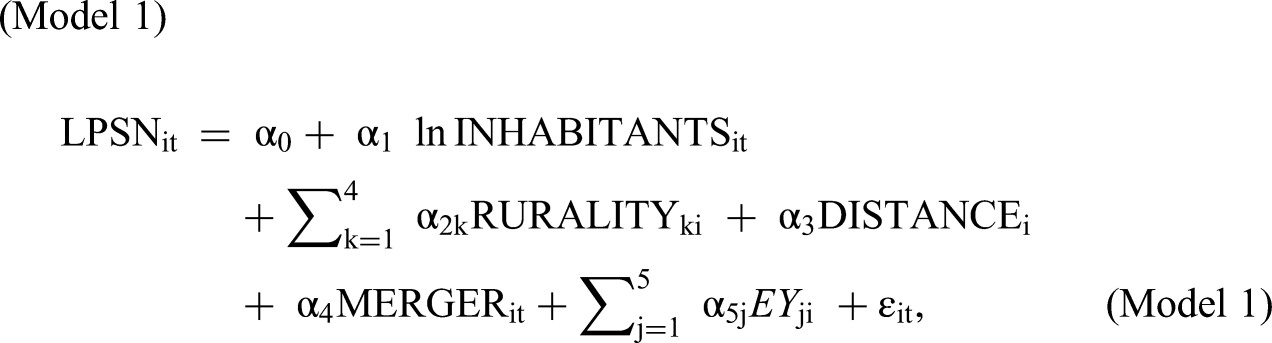
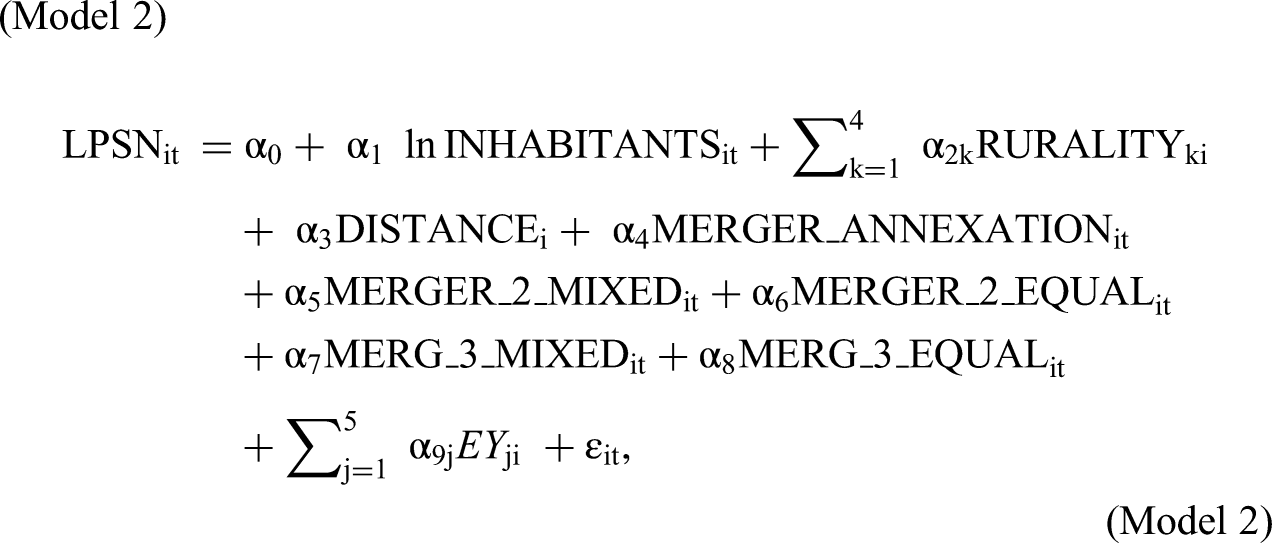
As we think that the influence of a merger might depend upon differences in size of the amalgamated municipalities, we not only use a dummy that takes a value of 1 if a municipality was part of a merger in the previous five years (model 1), but we also run model 2 in which we differentiate between five kinds of mergers:
MERGER_ANNEXATION—the absorption of a small municipality into a bigger neighbor (cf. Allers and Geertsema 2016)
8
, in which the smaller has less than 20% of the inhabitants compared to the larger municipality in the year preceding the merger. MERGER_2_MIXED—a merger of two municipalities of mixed size
9
, in which the smaller has more than 20% but less than 50% of the number of inhabitants of the larger municipality in the year preceding the merger. MERGER_2_EQUAL—a merger of two more equal municipalities, in which the smaller has at least 50% of the number of inhabitants of the larger municipality in the year preceding the merger. MERGER_3_MIXED—a merger of three or more municipalities of mixed size, in which the smallest has less than 50% of the number of inhabitants of the largest municipality in the year preceding the merger. MERGER_3_EQUAL—a merger of three or more municipalities of more equal size, in which the smallest municipality has more than 50% of the number of inhabitants of the biggest municipality in the year preceding the merger.
Findings
Table 2 presents the outcomes of the index for local party system nationalization as an average score for all Dutch municipalities (for c, see last row in Table 1). The index (presented at row h) can take values between 0 and 1, with 0 indicating that only local parties elected in the local election and 1 indicating that all national parties and no local parties are elected in the local election.
Calculation Index of Local Party System Nationalization (LPSN).
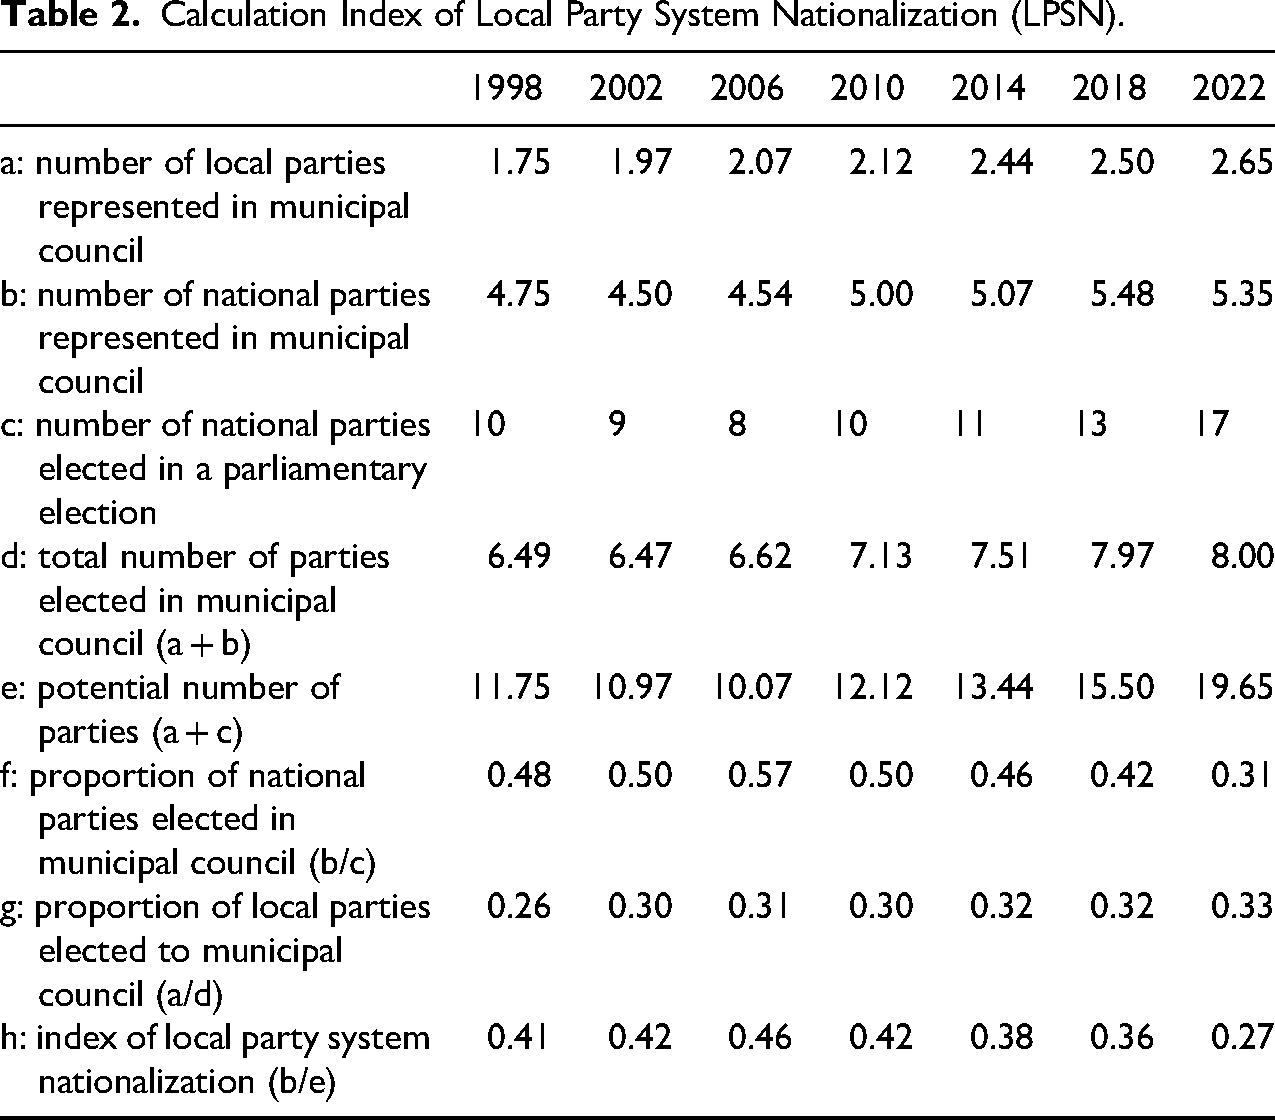
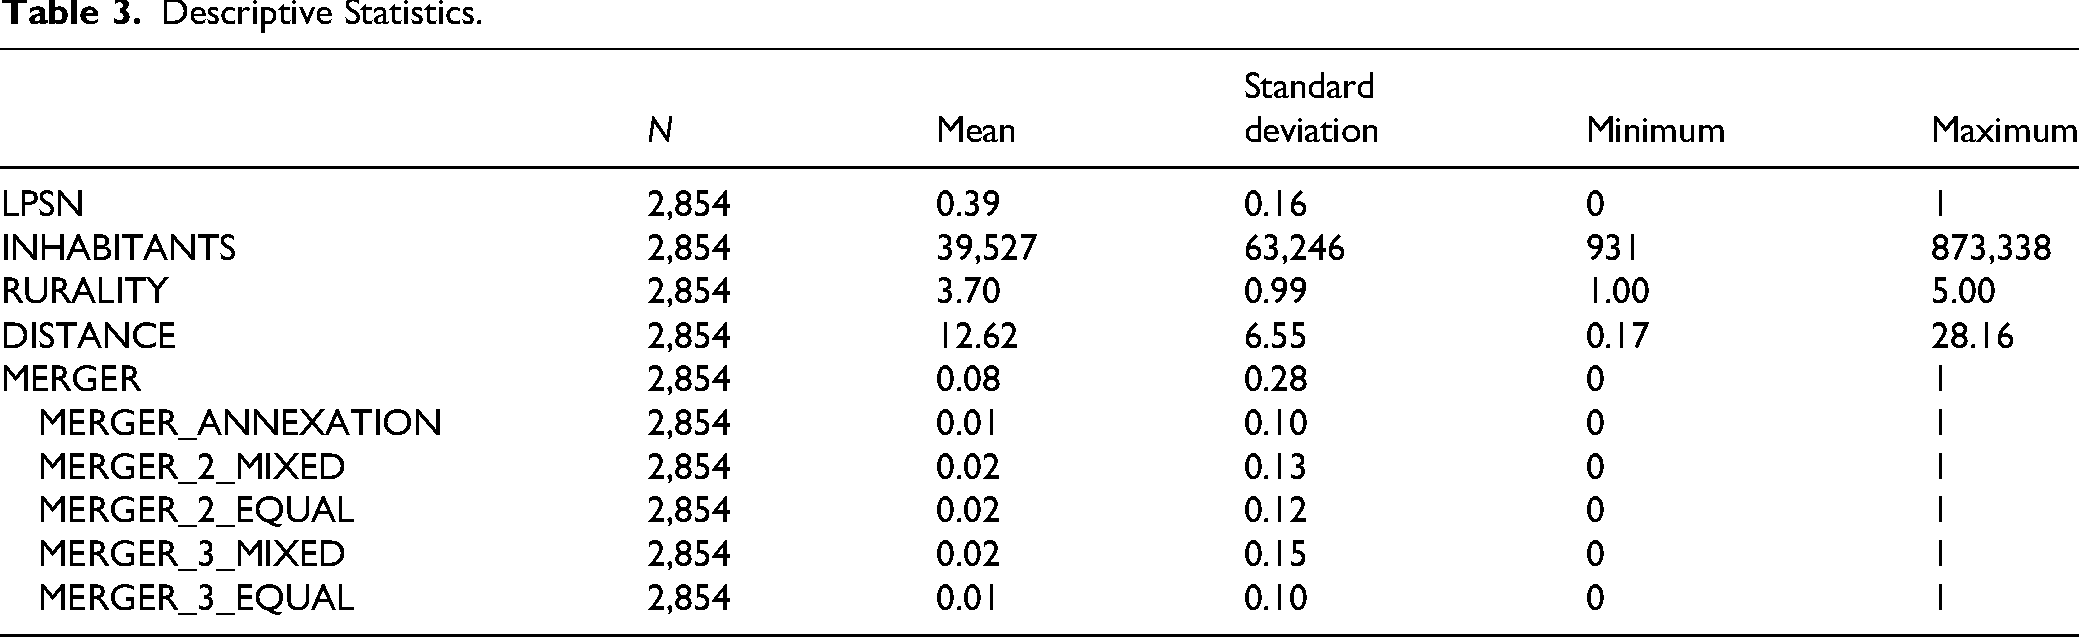
Table 2 shows that in the period 1998–2006, the index increased from 0.41 to 0.46, i.e., more nationalization, and decreased from 2006 to 2022 from 0.46 to 0.27. Interestingly, the number of municipalities with a fully nationalized council (row h = 1) is 0 and with a fully local council (row h = 0) is between 2 and 4. Table 3 shows the descriptive statistics for our sample. The number of observations is 2,854.
Descriptive Statistics.
For the regression results of these two models, see Table 4. For the merger variable, there are no indications that the causality runs the other way. Notably, the provincial government plays a key role in amalgamation, and the final decision is taken by the House of Representatives. Therefore, we assume that decisions about mergers come from outside the municipalities and, therefore, the use of OLS seems to be appropriate. Additional tests and analyses showed that the various assumptions for doing a multiple regression analysis are met. 10 In addition, there are no indications of multicollinearity issues. 11
Estimation Results of Local Party System Nationalization Index (LPSN).
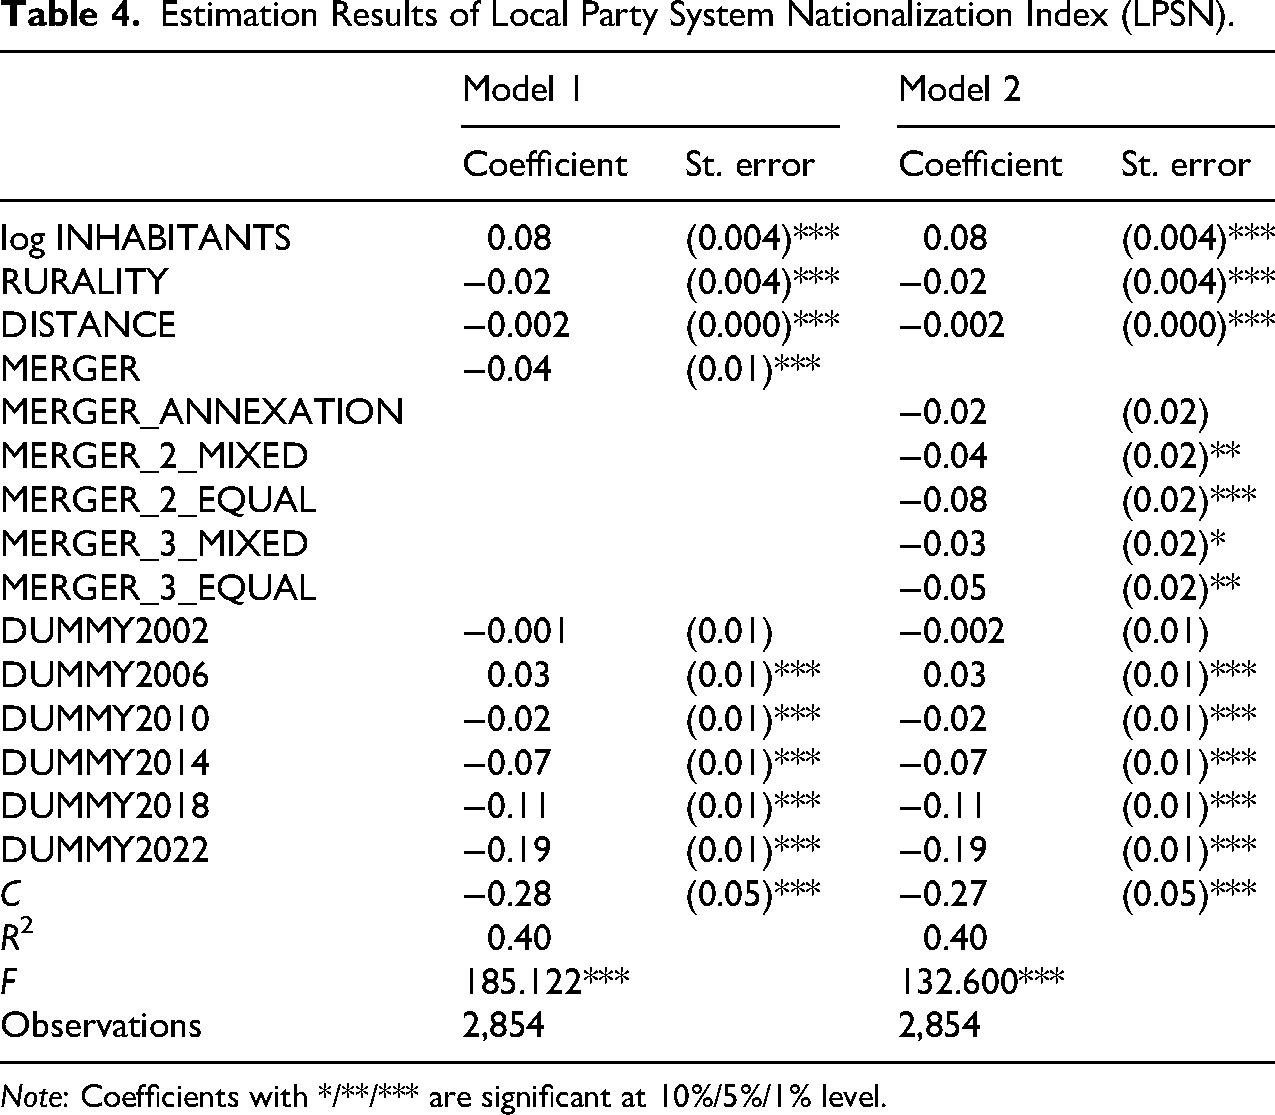
Note: Coefficients with */**/*** are significant at 10%/5%/1% level.
At the first estimation (H1), the index increases as municipal size increases and is highly significant. Interestingly, the size of the coefficient for inhabitants in logarithms with 0.08 is like that in Ennser-Jedenastik and Hansen (2013). In all other estimations, similar results occur for the inhabitants. The estimation of rurality is negative with −0.02 and highly significant (at 1% level) as well. This also gives a clear explanation for the rural hypothesis (H2). In a rural municipality (with indicator 5), the index is expected to be 0.08 lower and therefore have approximately two local parties more than in strong urban areas (with indicator 1). We also found strong evidence for the periphery hypothesis (H3). The estimation of the distance to the political center is negative with −0.002 and highly significant (at 1% level). This coefficient has a clear and intuitive explanation, e.g., if a municipality is more than 200 km from The Hague (in the provinces in the North or Limburg), the index is expected to be 0.04 lower. 12 If the number of national parties is ten and the actual average is 5, municipalities at such a distance from The Hague will have one local party extra. Interestingly, we also found that the index decreases by 0.04 if a merger took place during the previous five years, which is also a clear indication of the merger hypothesis (H4). 13 So, merged municipalities have approximately one local party extra. Finally, most election year dummies are significant (against the benchmark 1998) and decreasing (except for 2006, which is positive, and 2002, which is not significant).
If we distinguish between different types of mergers in the second model, we find statistically significant effects for all types (most at p < .01), except for the annexations, i.e., a case when a small municipality with less than 20% of inhabitants is merged into a larger one. The latter is consistent with our H4a, and a possible explanation is that the number of voters living in the smaller municipality is too small to have an influence on the election results. We also find proof for H4b indicating that if municipalities of mixed sizes are merged, the nationalization index will be lower. However, whereas we hypothesized that if municipalities of more equal size are merged, this would not result in a lower nationalization index, we find the opposite result. A possible explanation is that the inhabitants of all jurisdictions involved may fear that their own interests and local identities are threatened. Furthermore, given the more equal size of the municipalities, the number of votes from inhabitants from the former jurisdictions is high enough to have an impact.
In addition, the election years dummies show a significant and positive effect, meaning a lower nationalization index over time. A possible explanation could be that the role of municipalities in the Dutch administrative system increased over time, partly because of extensive decentralization measures of the welfare state that took place in 2007 and 2015. 14 As a robustness check we estimate the model without election years dummies (see Appendix III). In order to analyze whether our findings in 2022 are overly influenced by the increase in the number of national parties in the preceding national election (from 13 in 2018 to 17 in 2022), we did a robustness check in which we held the number of national parties in the House of Representatives constant at the number in 2018. As this gives similar results, we conclude that local parties’ lists drive the results (see Appendix VI).
Conclusion and Discussion
The Dutch index for local party system nationalization decreased from 0.41 in 1998 to 0.27 in 2022. When explaining this trend, we find size, mergers, rurality, and center-periphery differences are important determinants of this localization. Municipalities of a larger size show a higher nationalization index. We estimate that a larger distance to the political center in the Netherlands and more rurality are associated with less nationalization. In addition, more localization is observed if municipalities were recently part of a merger, except for annexations. It seems that the way the Netherlands organizes its amalgamation process stimulates localization of the party structure, especially in peripheral areas.
In future research, there are many avenues to explore. First, we would encourage exploration of the relationship between the index for local party system nationalization and size, rurality, and peripherality for other European countries. Notably, Bolgherini, Grimaldi, and Paparo (2021) show for Italy and Spain that local elections are more likely to be impacted by national politics in central, large municipalities, while local politics is more likely to prevail in peripheral, smaller municipalities. Second, it would be worthwhile to dive deeper into the question of the ideology of independent local parties (Otjes 2023), for example, by applying tools from manual content analysis to better understand issues raised at a local level and how polarized this is. Third, by comparing 11 European countries and two German states, Gendźwiłł and Kjaer (2021) show that the Dutch national-local turnout gap is 25.6%, which is the highest from this group, while Tavares and Raudla (2018) show that non-partisan candidates in local elections in Portugal are associated with higher turnouts. Therefore, it would be interesting to investigate whether independent local parties are better equipped to mobilize voters. Fourth, political representation may influence municipal spending; therefore, the way this representation is given shape at a local level (i.e., by representatives of local or national parties) is relevant from this perspective. Sebõ, Gradus, and Budding (2024) provide some evidence that Dutch municipalities with independent local majorities indeed differ in terms of local spending, specifically by spending more on categories of local public administration, public health and environment, and sport policy and activation, which are arguably more local-oriented.
Footnotes
Funding
The authors received no financial support for the research, authorship, and/or publication of this article.
Declaration of Conflicting Interests
The authors declared no potential conflicts of interest with respect to the research, authorship, and/or publication of this article.
Notes
Author Biographies
Appendix I: Distance to Amsterdam
In this appendix, we measure DISTANCE by calculating the distance (in 10 km or 6.2 (international) miles) between the Concertgebouw Area in Amsterdam and the townhall of the municipality.
Appendix II: Mergers in the last 10 years.
In this appendix, we include a MERGER dummy when a municipality is part of a merger in the previous ten years (instead of five years).
Appendix III: Without election years dummies.
In this appendix, we run the model again without election years dummies.
Appendix IV: Multicollinearity tests.
In this appendix, the VIF (variance inflation factor) of all variables and bivariate Pearson's correlations are given to explore multicollinearity.
Appendix V: Frequency table of independent local parties
Number of municipalities with the number of independent local parties.
| 1998 | 2002 | 2006 | 2010 | 2014 | 2018 | 2022 | |
|---|---|---|---|---|---|---|---|
| 0 local parties | 84 | 42 | 28 | 20 | 11 | 7 | 4 |
| 1 local party | 168 | 159 | 137 | 131 | 91 | 76 | 61 |
| 2 local parties | 130 | 136 | 142 | 132 | 115 | 108 | 92 |
| 3 local parties | 64 | 73 | 78 | 75 | 88 | 97 | 115 |
| 4 local parties | 25 | 22 | 33 | 43 | 58 | 47 | 47 |
| 5 or more local parties | 28 | 32 | 23 | 18 | 22 | 21 | 25 |
Appendix VI: Number of national parties in 2022 constant at the number of 2018.
In this appendix, we hold the number of national parties in the House of Representatives in 2022 (17) constant at the number of 2018 (13).