
Abstract
How does gentrification impact household demand for policing? Previous research finds that gentrification is associated with more calls to the police but cannot show which types of residents make these calls or evaluate explanations for why these calls occur. My household-level approach allows me to test ethnographic findings about gentrifiers’ demand for policing. Using a within-subject design that matches 2014–2021 voter file data with call records from Austin, TX, I show that gentrifiers make more calls to the police than long-term residents in gentrifying neighborhoods and that this increasing call volume is associated with the act of moving. Specifically, I show that gentrifiers demand more policing when they move into spaces with relatively greater poverty and more non-White residents net changes in crime. These findings highlight the impact of race and class in shaping how privileged citizens wield power in gentrifying contexts.
Introduction
Every Sunday, Chicano Park, on the east side of Austin, TX, transforms into a hub for brightly colored lowriders and vintage cars blasting music out of their stereos. After a few loops of the park, the drivers, mostly young Black and Latino men, join families and friends to pass the rest of the afternoon in the park. These Car Club gatherings have been taking place every Sunday since the nineties, but recently, residents of the Weaver, a new luxury apartment near the park, have lodged numerous complaints. While the Weaver’s website promises renters access to a “community that is rich in history and tradition,” at a recent gathering, a White tenant pleaded with police officers to disband the celebration, calling it “scary” (Holley 2021). This tension between long-term residents and newer residents over the use of neighborhood space is not unique to Austin. Cities across the country are grappling with increased demand for policing by newer residents to gentrifying areas.
Gentrification is traditionally defined as “the in-migration of middle-and upper-income households into existing lower income urban neighborhoods” (Griffith 1996, 241). As is the case in Austin’s east side, gentrification typically brings greater numbers of more affluent, White residents (gentrifiers) into lower-income, previously disinvested neighborhoods that are often majority Black or Latino (Ellen and O’Regan 2011; Hyra 2008; Wyly and Hammel 2008). Scholars argue that this influx of more socially privileged and empowered individuals into disadvantaged neighborhoods often leads to increased policing (Laniyonu 2018; Sharp 2014) at times driven by citizen demand (Beck 2020; Harris, Rigolon, and Fernandez 2020; Herring 2019). However, there is considerable disagreement between scholars about why these increased demands occur.
Traditional criminology research links increased demand for policing to heightened crime (Bursik Jr and Grasmick 1993; Sherman, Gartin, and Buerger 1989; Warner and Pierce 1993), but prior qualitative work finds that gentrifiers often demand policing to curb behaviors they link to criminality or neighborhood disorder such as homelessness, late-night gatherings in public spaces, or unauthorized home repairs (Cybriwsky and Levy 1980; Pattillo 2010). In this scenario, gentrifiers behave as more affluent residents, wielding political power to maintain and increase the economic status of their property and the surrounding neighborhoods (Hankinson 2018; Yoder 2020).
Similarly, theories of racial threat predict that it is privileged Whites’ response to more ethno-racial diversity within neighborhoods that increases demand for policing. Since gentrification often brings large numbers of White residents into historically Black or Latino neighborhoods, racial threat theories predict that the often White gentrifiers’ will perceive the mere presence of non-White residents as evidence that a neighborhood is dangerous absent objective measures of safety (Parekh 2015; Quillian and Pager 2001; Ramírez 2020). These racial stereotypes then generate a heightened demand for policing.
Testing explanations of gentrifier behavior is key to understanding how privileged citizens wield power in gentrifying areas and its impact on city politics. However, empirical studies on policing demand in these neighborhoods are rare and limited in explaining which residents demand policing and if this demand relates to their movement into gentrifying spaces. Most studies linking gentrification and policing demand are qualitative case studies of single neighborhoods (Muñiz 2015; Parekh 2015; Pattillo 2010), quantitative analyses using aggregate data (Beck 2020; Collins, Stuart, and Janulis 2022; Legewie and Schaeffer 2016), or surveys (Nelsen, Ramanathan, and Ogorzalek 2023). While case studies offer rich detail, they are highly specific and limited to single neighborhoods or a few individuals. Quantitative studies using aggregate data cannot identify which residents make police calls and those using surveys rely on self-reported measures. Additionally, they cannot assess how changes in crime, socio-economic status (SES), and racial composition relate to gentrifier demand for policing.
To address these limitations, I test the relationship between gentrification and household demand for policing. I conduct this test within the city of Austin, TX, one of the most rapidly gentrifying cities in the country (Kimble 2022; Maciag 2015). Leveraging large-scale administrative data on 310,393 voters between 2014 and 2021, I use household addresses to identify distinct types of within-city movers. This allows me to compare the behavior of gentrifier households, those that move from wealthy neighborhoods into gentrifying spaces, to other types of urban movers and non-movers. Matching these addresses to over two million 911 calls and 311 requests from the same time period, I test (1) if gentrifier households make more calls to the police relative to non-gentrifier households in gentrifying areas, (2) if gentrifier households increase their demand for policing after moving into a gentrifying area net changes in crime, and (3) if gentrifier households make more calls when moving into predominantly non-White spaces.
I find evidence that gentrifier households make more calls to the police than long-term households in gentrifying spaces. I then show that moving into gentrifying tracts is associated with increased calls to the police net changes in crime. Gentrifier households are also more likely to demand order maintenance policing (OMP), the policing of low-level, non-violent behaviors such as homelessness, loitering, or public intoxication. I further find that this behavior is most pronounced among gentrifier households moving into spaces with high proportions of Black and Latino residents.
This paper establishes citizen demand for policing as a component of the existing relationship between policing and gentrification. Building on the work of sociologists, it provides evidence that gentrifier demand for policing is not exclusively tied to crime, but to a discomfort with living among greater poverty and non-White residents. Ultimately, demand for policing is a key element to the politics of gentrification as it helps explain how newer residents cultivate power and control within gentrifying contexts.
Background and Theory
Since the 1950s, U.S. cities have faced de-industrialization, weakening manufacturing, and heavy industry. To maintain a robust tax base (Peterson 1981), city governments have increasingly pursued urban amenities to attract professional workers. This has led to more higher-earning, educated professionals moving into previously lower-income neighborhoods, a process defined as gentrification (Florida 2002; Griffith 1996; Wyly and Hammel 2008).
Traditional class-based definitions, however, often overlook the persistent marginalization, segregation, and discrimination faced by urban Black and Latino communities in the U.S., leaving them vulnerable to the demands of wealthier White residents (Betancur 2002). Gentrification typically increases the proportion of college-educated, professional, and higher-income residents (Brown-Saracino 2009; Wyly and Hammel 2008; Zuk et al. 2018), and also the White population (Hwang and Lin 2016; Rucker 2024; Smith 1996). Racially mixed neighborhoods often gentrify more rapidly than majority Black ones (Hwang and Sampson 2014). Even so, gentrifiers’ racial and socio-economic profiles make them distinct from traditional residents, who, due to systemic racism, poverty, and institutional disinvestment, are often less educated, have lower incomes, and are frequently people of color.
Gentrification and Demand for Policing
As new residents move into gentrifying spaces, scholars have found concurrent increases in policing, especially the policing of homelessness, or behaviors such as loitering, or public intoxication (Collins, Stuart, and Janulis 2022; Laniyonu 2018; Sharp 2014). This type of policing practice, commonly referred to as OMP, is deployed in neighborhoods that have been politically or socially construed as disordered and is designed to intervene in low-level activity before it escalates to more serious crime. Yet the people and neighborhoods who are routinely the targets of these practices become functionally criminalized via heightened contact with police even as no criminal activity has transpired at the point of contact.
One explanation for this rise in policing and OMP in gentrifying neighborhoods is greater citizen demand. Legewie and Schaeffer (2016) find that calls to New York’s 311 1 hotline increase during gentrification and Laniyonu (2018) finds slight increases in 311 calls in neighborhoods adjacent to gentrifying spaces. Beck (2020) finds that 311 calls to the police increase as a neighborhood’s middle-class population increases and Nelsen, Ramanathan, and Ogorzalek (2023) detail how gentrifiers report a higher likelihood of calling the police about quality-of-life issues relative to their neighbors.
There are theoretical reasons to expect that gentrifiers—typically more well-resourced and often White—will demand more services. Research shows marginalized communities, especially Black and Latino communities, exhibit lower trust in local government due to higher discrimination (Giulietti, Tonin, and Vlassopoulos 2019; Heideman 2020). Empirical evidence has shown that neighborhoods or housing complexes with more Black and Hispanic residents are less likely to use municipal services, like 311, while wealthier ones over-report issues (Cavallo, Lynch, and Scull 2017; Kontokosta, Hong, and Korsberg 2017). This suggests gentrifiers, often higher-resourced, may be more likely to perceive service deficiencies and demand improvements.
Despite these expectations, empirical evidence of differential levels of demand between resident types is limited. However, aggregate analyses cannot pinpoint call sources, making it difficult to link gentrifiers’ characteristics to distinct behaviors. Even studies such as Nelsen, Ramanathan, and Ogorzalek (2023), which identify gentrifiers through surveys, rely on self-reported police call data and cannot assess changes in calls over time. Examining only neighborhood-level trends could lead observers to conclude that all residents are making equal demands and that these demands reflect a universal decline in safety. Missing the variation in household-level behavior could therefore lead to imprecise or unsuitable policy responses that misinterpret the factors driving increased demand.
Explanations for Heightened Demand
A common explanation for why gentrifiers demand policing is that it is a direct response to heightened levels of crime in gentrifying neighborhoods (Bursik Jr and Grasmick 1993; Warner and Pierce 1993). Due to the high correlation between poverty and crime (Gaitán-Rossi and Velázquez Guadarrama 2021; Sharkey, Besbris, and Friedson 2017), movement into gentrifying areas may expose gentrifiers to higher rates of crime. The rational offender theory (Cornish and Clarke 1989) argues that potential offenders choose their targets based on a rough cost/benefit calculus and predicts that gentrification will be linked to rising property crimes in the early years of transition. Covington and Taylor (1989) find some evidence of this in Baltimore between 1970 and 1980. This increased direct exposure to more crime is a traditional explanation for increased calls.
In contrast, findings from ethnographies of gentrifying neighborhoods provide alternative explanations: that demand for policing is a result of gentrifiers’ response to the greater levels of poverty and larger non-White populations, particularly Black populations, in their new neighborhoods. Qualitative research finds that long-term residents and gentrifiers hold distinct ties to the community leading to different conceptions of public safety and the use of public space (Chaskin and Joseph 2013; Cybriwsky and Levy 1980; Freeman 2006). This can generate conflicts between newer and older residents over everyday factors such as where to barbecue, fixing cars on the street, porch sitting, honking horns, or unauthorized home repairs all of which can increase gentrifier demand for the informal and formal policing of the behavior of long-term residents (Pattillo 2010).
Alongside class and also directly linked to it, race has also been shown to be a salient force in driving local political behavior (Hajnal and Trounstine 2014) with racial threat having particularly powerful effects (Enos 2016; Hamel and Wilcox-Archuleta 2022; Trounstine 2018). Traditionally, the racial threat hypothesis posits that members of the dominant group will perceive increases in the size of the Black population nearby as threatening and will take action to reduce this threat (Blalock 1967). However, for gentrifying neighborhoods, traditional group size dynamics have been inverted as the numeric racial majority groups are non-White and the dominant group, White gentrifiers, is the growing population. Another complication is that to some degree, White gentrifiers self-select into more ethno-racially diverse neighborhoods (Ellen and O’Regan 2011). How well then does the racial threat hypothesis hold for gentrifiers?
Existing ethnographic research indicates that in fact, theories of racial threat still influence the behavior of gentrifiers. Grier and Perry (2018) coin the phrase “faux-diversity,” to describe how even as gentrifiers express a desire to live in a diverse community, their consumptive preferences and attitudes exclude long-term residents and undermine any potential for true diversity. In the gentrifying Tremé district of New Orleans, Parekh (2015) interviews two residents on their attitudes toward neighborhood safety. Long-term resident June, an African American woman in her forties, describes how the purportedly “nosy grandmothers sitting on their porches” were constantly watching what was going on in the street. For June, this meant that criminal activities were thwarted by the surveillance created through the eyes of a network of older women, “eyes on the street” that improved neighborhood safety and community (Jacobs [1961] 1992). Meanwhile, Ellen, a middle-class, White woman who had recently moved to Tremé from a predominantly White suburb, describes how she “was fearful of going out on the street, and she felt afraid when she saw ‘too many’ people hanging out on their porches” (Parekh 2015, 209). Parekh (2015) highlights the racialized nature of Ellen’s perceptions, noting that the use of public space by residents “led Ellen to feel fearful not only since she was unfamiliar with it, but also because of the blackness of the bodies she encountered in public space” (p. 210). This evidence suggests that gentrifiers’ perceptions of their neighborhoods are heavily influenced by racial biases, and thus moving into more non-White spaces could increase their demand for policing.
To evaluate the potential explanations, I analyze the demand for policing at a household-level and test how different factors vary with changes in calls to the police. From a methodological standpoint, this paper develops an approach to identify households that move within urban spaces that can be applied in a variety of ways to study how neighborhood context and urban movement shape politics. Substantively, it provides insight into how gentrifiers behave in their new neighborhoods and how race and class dynamics of urban spaces shape demand for policing.
Argument and Hypotheses
Drawing on the existing literature on gentrification and policing, I expect that within gentrifying neighborhoods, gentrifier households will exhibit a greater demand for policing than non-gentrifier households in these neighborhoods.
In addition to demanding greater policing relative to non-gentrifiers in gentrifying neighborhoods, I argue that gentrifiers’ movement into gentrifying areas will be associated with increases in household demand for policing. Gentrifiers, accustomed to residing in more affluent, Whiter neighborhoods, will perceive gentrifying neighborhoods as spaces of greater disorder because of the more visible signs of poverty or their own racial stereotypes about areas with greater proportions of non-White residents. Furthermore, qualitative research establishes that gentrifiers are likely to engage police in ways that are distinct from long-term residents of the same spaces, because as ascriptively privileged citizens, they have a different relationship with the police. Thus gentrifiers will demand greater policing to remedy said perceived disorder that is not fully explained by objective measures of the level of crime.
I further expect that these dynamics will be most apparent in requests for OMP style intervention, as they aim to clean-up neighborhoods and preempt crime, rather than responding to actualized criminal behavior.
Finally, because both gentrification and policing are highly racialized, I expect the racial context of gentrifying neighborhoods to influence gentrifier household demand for police, specifically for White gentrifier households. When gentrifiers enter more non-White spaces, particularly those with substantial populations of Black and/or Latino residents, this activates racial bias and prejudice increasing their sense of the neighborhood as dangerous and disordered. To remedy this sense of fear and establish control within these spaces, I predict that gentrifier households will increase their demand for policing.
The Case: Austin, TX
I test my hypotheses in the context of Austin, TX. While previous studies of gentrification have primarily focused on New York City, Chicago, Washington, D.C., and San Francisco, Austin provides the opportunity to study a southern city that has gentrified more recently, and rapidly (Bresnan 2021), but where gentrification is still highly racialized. In the past thirty years, the population of Austin has doubled, growing to over 1 million people in 2023 (City of Austin 2023). Alongside population growth, over the past ten years, the median household income in the Austin area has risen from $73,200 to $122,300 (City of Austin 2022) and median housing prices have doubled, from $220,000 to $501,507 (Texas A&M Real Estate Research Center 2023). These drastic changes have made Austin a prime example of a rapidly gentrifying urban area (Delco 2019; Marin 2022). Additionally, the speed at which Austin is gentrifying provides variation within a smaller time frame as opposed to slower growth across multiple decades.
Like many other urban contexts, gentrification is highly racialized in the context of Austin. In the early twentieth century, city officials passed Austin’s 1928 Master Plan, a plan that fundamentally shaped the growth of Austin over the next century and “institutionalized racism in the capital city” (Austin PBS 2021). The plan determined that despite the existence of Black communities in all sections of the city, African Americans should be forced to live in only one section of the city, “east of East Avenue and south of the City Cemetery” (present-day east and southeast of IH-35), and then zoned that area as the location for “undesirable industry” (Council Austin City 1928). In order to push Black residents out of their original neighborhoods, the city government denied these historically Black neighborhoods city services, from public schools to utilities. As a result of these decisions and other discriminatory practices, Austin’s east side saw high levels of poverty and institutional disinvestment.
This history forms the bedrock of gentrification in Austin today. The city’s “Smart Growth Plan” in the late 1990s, incentivized private developers to build new housing close to downtown and drew wealthy, largely White individuals, into historic Black and Latino communities on Austin’s east side (KUT, Austin 2021) resulting in high levels of displacement of Black residents, even when compared to other gentrifying cities (KUT, Austin 2021). Practically, Austin also provides the necessary data with which to conduct a household-level analysis. Therefore, Austin’s rapid development, its racial segregation, and the available data make it a particularly apt case to test the relationship between gentrification and demand for policing.
Research Design
In order to assess the impact of gentrification on household demand for policing, I create an original data set combining yearly snapshots of voter file data, 311 requests, 911 calls, American Community Survey (ACS) data, and crime data for the city of Austin from 2014 to 2021. Below, I detail my approach to creating the final data set and then outline the limitations of my approach.
Matching Calls
I begin by geolocating the voter file, gathering longitude and latitude coordinates for each voter’s address, and I prepare the 311 and 911 calls for each year by hand-coding the unique descriptions to identify those related to OMP. Next, I match the call addresses with the voter file address for each year, aggregating the number of calls by address for 911 and 311 calls and those non-OMP and OMP-related. 2
Gathering Household Characteristics
Since the Texas voter file does not include information about racial or ethnic background, I employ Bayesian Improved Surname Geocoding (BISG) which uses an individual’s surname and location to estimate the probability that they are of a given racial category (Barreto et al. 2022; DeLuca and Curiel 2023) to impute the race or ethnicity of each of the voters in the voter file based on the probability of each racial category. 3 I predict the race of each voter in my set of matched calls, but given that multiple voters can have the same address, I create a household race variable based on the race of all individuals at an address in a given year. Households where all voters are in the same racial category are classified as a single racial category, whereas if voters in a household are of different races, the household is classified as multi-race. I use this same approach to include data on household age and gender.
Identifying Movers
Next, given that calls cannot be traced to specific units within multi-unit properties, I separate the data between single-unit and multi-unit addresses. To identify movers, I separate the single-unit, matched call data into three-year bins. Then, for each time range, for example, 2014 to 2016, I match the voters by voter ID in 2014 to 2015 and identify those that have new addresses in 2015. 4 Then I match the 2014 voters with the 2016 voters, so I have a set of voters from 2014 to 2016 with some that moved in 2015 and others who did not. I do this for the following ranges: 2014–2016, 2015–2017, 2016–2018, 2017–2019, 2018–2020, and 2019–2021. At this point, I filter the data to only include unique addresses within each three-year range, that is, if multiple voters reside at the same address, they are counted only once as a single household with the three-year ranges. These households are the unit of analysis throughout the study. Within the total sample, 56% of the households have only one voter, while the remaining 44% house more than one voter. Thus while the results chiefly provide insight into household-level behavior, for over half of the households, they also provide insight into individual-level behavior.
Classifying Tracts
To identify gentrification status, I calculate changes in ACS from 2014 to 2022, using Laniyonu’s (2018) criteria to classify census tracts as eligible or ineligible to gentrify in 2014. While there is no consensus on how to measure gentrification, most studies use census data to track socio-economic changes. The debate continues over whether race should be included in these measures (Fallon 2021; Lee and Velez 2024; Nelsen, Ramanathan, and Ogorzalek 2023). Although race is central to gentrification due to historical racial inequity and spatial segregation, I focus solely on socio-economic changes so that I can isolate and test the role of racial demographic shifts in my third analysis. Additionally, with my household-level analysis, about 11% of households are mixed-race, complicating theoretical expectations for these gentrifiers.
I choose Laniyonu’s (2018) measure because it originates from a direct study of the relationship between gentrification and policing. For robustness, I re-run my analysis using Freeman’s (2005) criteria. 5 Tracts below the city-wide median income and rent in 2014 are classified as eligible to gentrify. These tracts are then divided into three categories based on changes in the percentage of college-educated residents and median rent. 6 Tracts in the top tercile of eligible tracts for these increases, or those with rent increases above the city median, are classified as gentrifying. 7 Tracts that are eligible in 2014 but do not meet the gentrifying threshold by 2021 are classified as low SES. Tracts never eligible to gentrify are classified as high SES. 8
Figure 1 maps the gentrification status of each tract in 2014 and 2021. The vast majority of gentrification-eligible tracts in 2014 are located on the east side of the city, historically majority Black and Latino neighborhoods. From the 2021 map, it is clear that the bulk of gentrification (the darkest colored tracts) has also occurred on the east side with some clusters also stretching north and south of the city downtown. These patterns are mirrored in other reports of gentrification, such as the one done by the Uprooted Project (Way, Elizabeth, and Wegmann 2018), and many Austin residents themselves are keenly aware of the areas undergoing the most rapid gentrification, namely the neighborhoods of East Austin and Mueller in Northeast Austin (Beasley 2023; Rucker 2024).
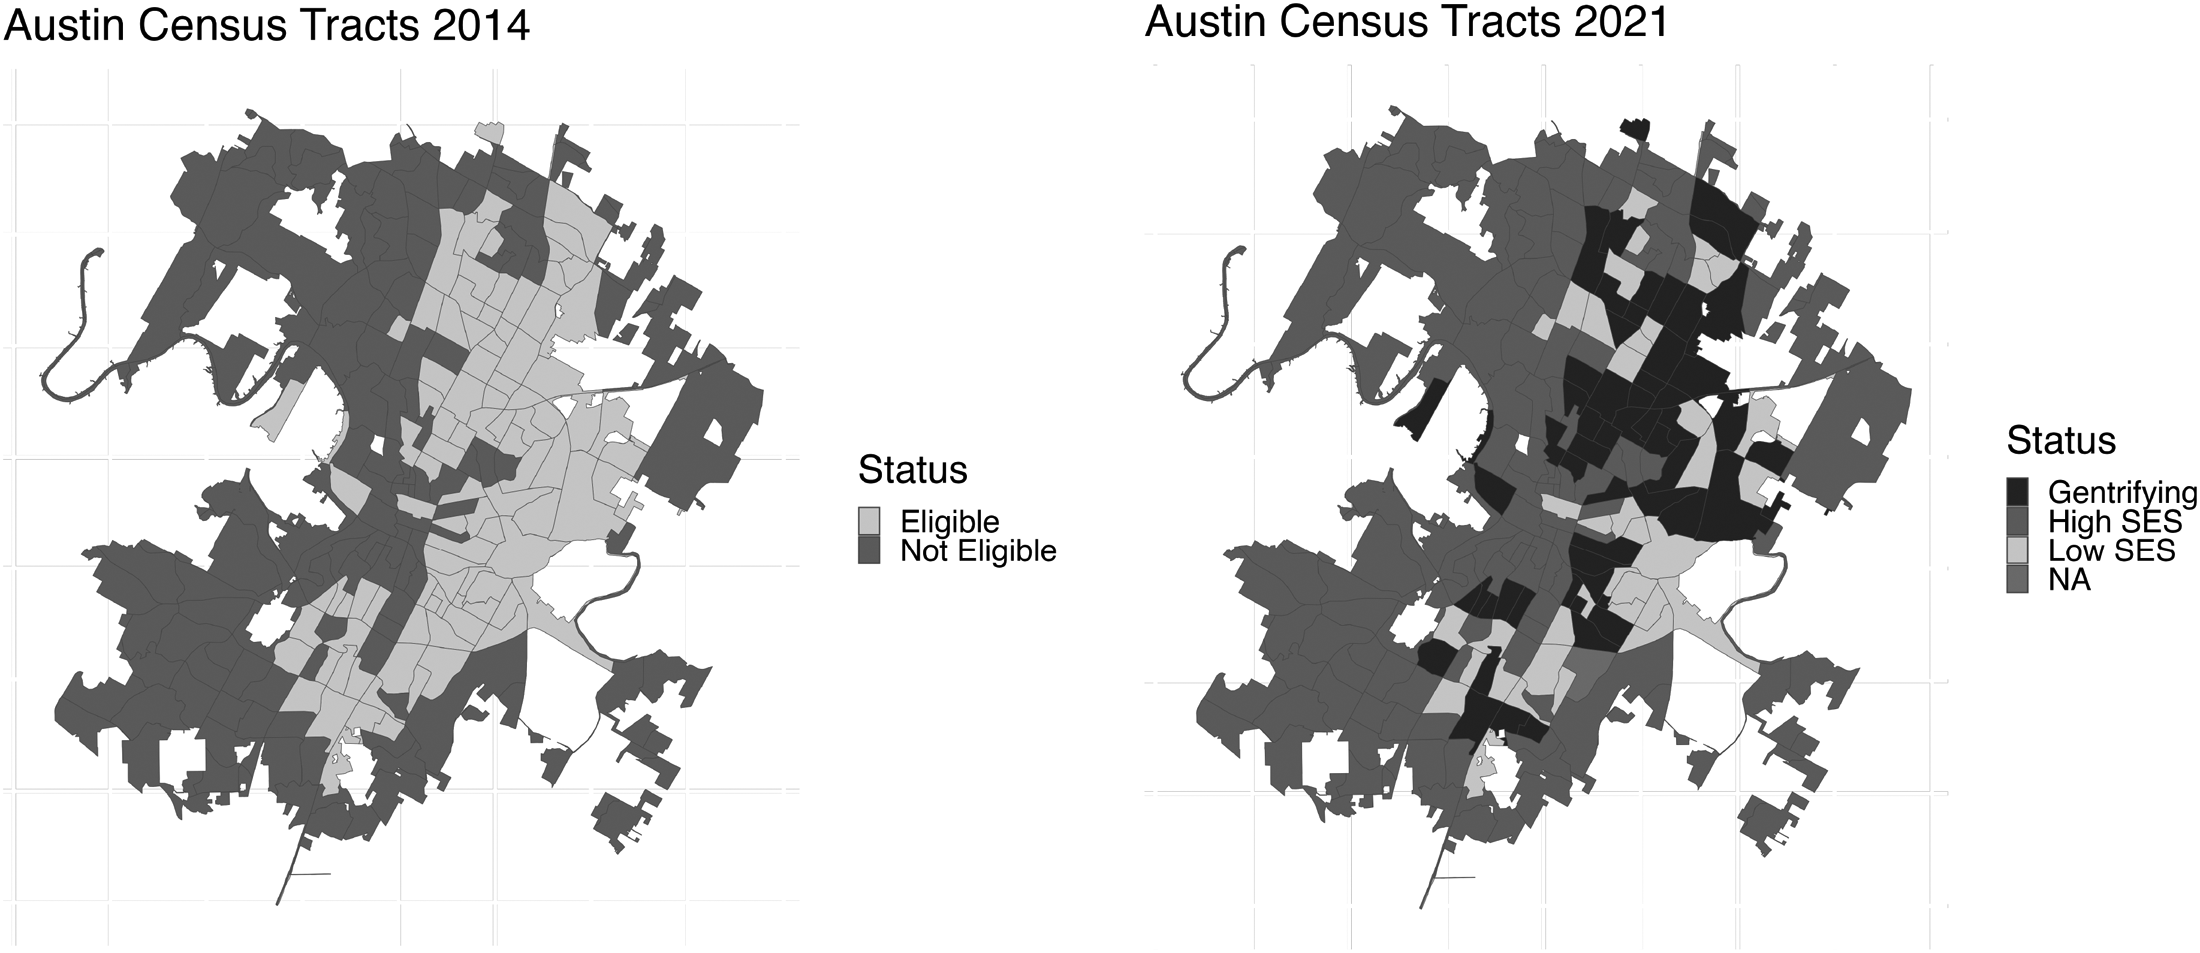
Gentrification in Austin 2014–2021.
Categorizing Movers
I next place each household into a distinct category based on the census tract classification of the first and third year of the three-year bin. For households that moved (movers), this is based on the tract classification that they moved from and the classification of the tract they moved into, while for households that did not move (non-movers), it is the tract classification over all three years. I then re-stack all of the three-year bins with an indicator of the time span for each observation. The final dataset contains 730,096 observations including 32,018 within-city movers. 9
Limitations
Overall, this is a novel approach that expands the range of uses for voter file data and allows for the more granular study of geographic mobility, but still, limitations exist. The first stems from the reliance on voter file data, which excludes certain types of individuals such as those under-18 and those not registered to vote. Administrative data can also yield systemic under-representation of populations due to different participation rates among subgroups (Ansolabehere and Hersh 2014; Shino et al. 2020). For the purposes of this paper, I compare the representativeness of voter file data to the over-18 population in Austin and to the population of gentrifying tracts. As Appendix A.1 in the Supplemental Material demonstrates, the sample demographics are largely similar with the exception of racial demographics where Black and Latino individuals are underrepresented in the voter file data. However, this should not dramatically bias the results as (1) the main group of interest in my study, gentrifiers, tend to be much whiter on average than the general population, and (2) this still allows me to make key comparisons between gentrifiers and other non-movers and movers who may be similar demographically but who do not move into gentrifying areas.
Another limitation in the approach is that not all calls match residential addresses as many come from non-residential locations or lack specific addresses. The average match rate was 51% for 311 requests and 21% for 911 calls. 10 Additionally, the matching process cannot match specific units in multi-unit housing complexes, so my final dataset includes only matched calls from single-unit properties. To test for similar patterns in multi-unit properties, I conducted a separate analysis, wherein the results comport with those derived from the single-unit property analysis and are found in Appendix K in the Supplemental Material.
Given that the police call data is only for the city of Austin, the analysis is limited to within-city movers. Although over half of movers tend to stay within their county (Merten 2024), this still presents a challenge for external validity. However, looking at only within-city movers actually creates a harder test of the hypotheses. Within-city movers are unique in that they (1) already live in a metropolitan area and (2) live specifically in Austin. For movers from non-metropolitan areas, the shock of moving to an urban environment with the potential for greater noise, ethno-racial and economic diversity, exposure to crime, etc. likely increases their likelihood of calling the police. For example, Appendix O in the Supplemental Material, displays the relative levels of the White non-Hispanic population, violent crime, and property crime for Travis County relative to adjacent counties. As Table O20 in the Supplemental Material illustrates, Travis County has more ethno-racial diversity, greater crime, and a larger population relative to even its neighboring counties. Thus, the findings may actually represent a conservative estimate of the correlation between gentrifier households and demand for policing with the possibility that within-city movers already have a baseline level of exposure to factors traditionally correlated with increased calls to the police relative to other types of movers.
The most serious limitation of my approach is the assumption of symmetry between the socio-economic status of a census tract and that of a household within that tract. That is, the assumption that households that move from higher-status to lower-status tracts are themselves higher-status households. I therefore take a theoretical and a methodological approach to mitigate concern about potential ecological fallacy. Theoretically, while gentrifier households are conceptualized as affluent, their key characteristic is being affluent relative to surrounding households. Even if they move from higher-status tracts because they can no longer afford the cost of living there, they may still be affluent relative to existing households in their new, lower-status tracts. Nonetheless, in order to guard against potential issues of ecological inference, I follow King (2013) and use a Bayesian regression model to calculate a probability distribution for the median income of each household using tract-level data. Using these predictions, I calculate the distance between the household’s predicted median income and the median household income of the gentrifying tract that they move into, divide this distance by the median household income of the tract to normalize it, and then use the scaled distance to create a probability measure between 0 and 1 (for more details on the process see Appendix P in the Supplemental Material). This approach helps to guard against issues of ecological inference by incorporating an element of uncertainty around household-level characteristics and avoiding the homogeneity that exists in the broader categories of tract-level SES.
Dependent Variables
My dependent variable is household demand for policing. I conceptualize this variable as citizen-initiated 911 calls and 311 requests related to policing. 311 requests related to policing include those that are routed directly to the Austin Police Department and other OMP demands such as noise complaints or reports of neighborhood code violations, those that represent attempts by residents to “clean-up” their neighborhood or monitor the behavior of fellow residents. 11 This is meant to distinguish 311 requests that represent a demand for neighborhood surveillance from other non-emergency requests such as inquiries about recycling pick-up. To measure the change in demand for policing, I calculate the difference between the number of household calls in the final year and the first year of the three-year windows. This allows me to compare changes in the behavior of movers with non-movers over the same three-year periods (Table 1).
Household Types.
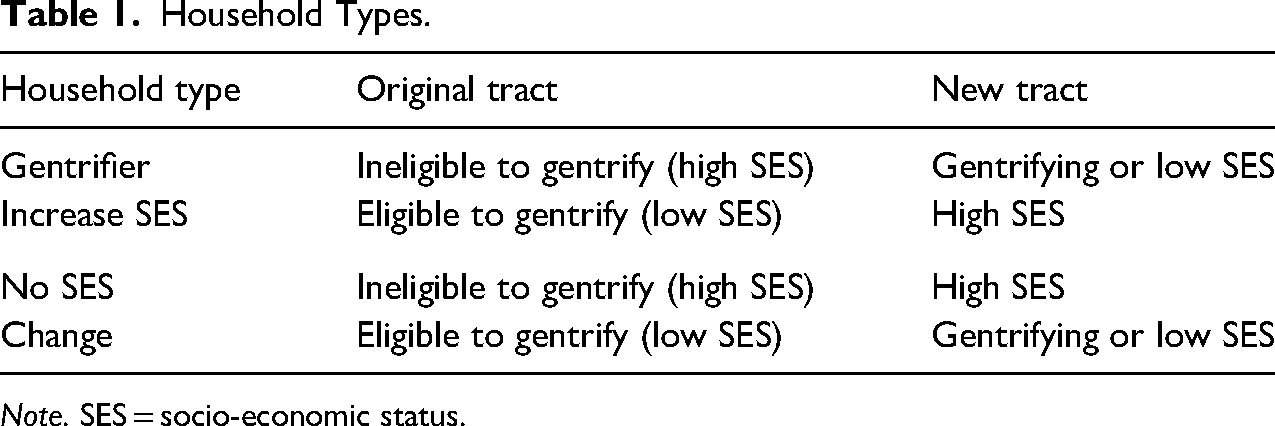
Note. SES = socio-economic status.
Explanatory Variables
Household Type
My key explanatory variable is the categorical variable: household type, which contains four categories. The criteria for inclusion in each of the categories are listed in Table 1. 12 Each category is mutually exclusive. Gentrifiers, following the traditional class-based definition in the literature, are higher-income households that move into previously lower-income neighborhoods. This measure makes an important contribution to studies of gentrification as it can identify households that have moved into gentrifying contexts by their physical movement instead of relying on self-reported metrics or socio-demographic characteristics to classify residents as gentrifiers.
Table 2 presents the sample averages across key variables for gentrifier households as compared to other household types. Consistent with the gentrification literature, gentrifier households are typically younger and move from higher SES, Whiter neighborhoods into lower SES, more non-White neighborhoods. The last three columns provide information on the variable’s scale, the data source, and whether it measures change over the three-year range.
Average Sample Characteristics by Household Type.
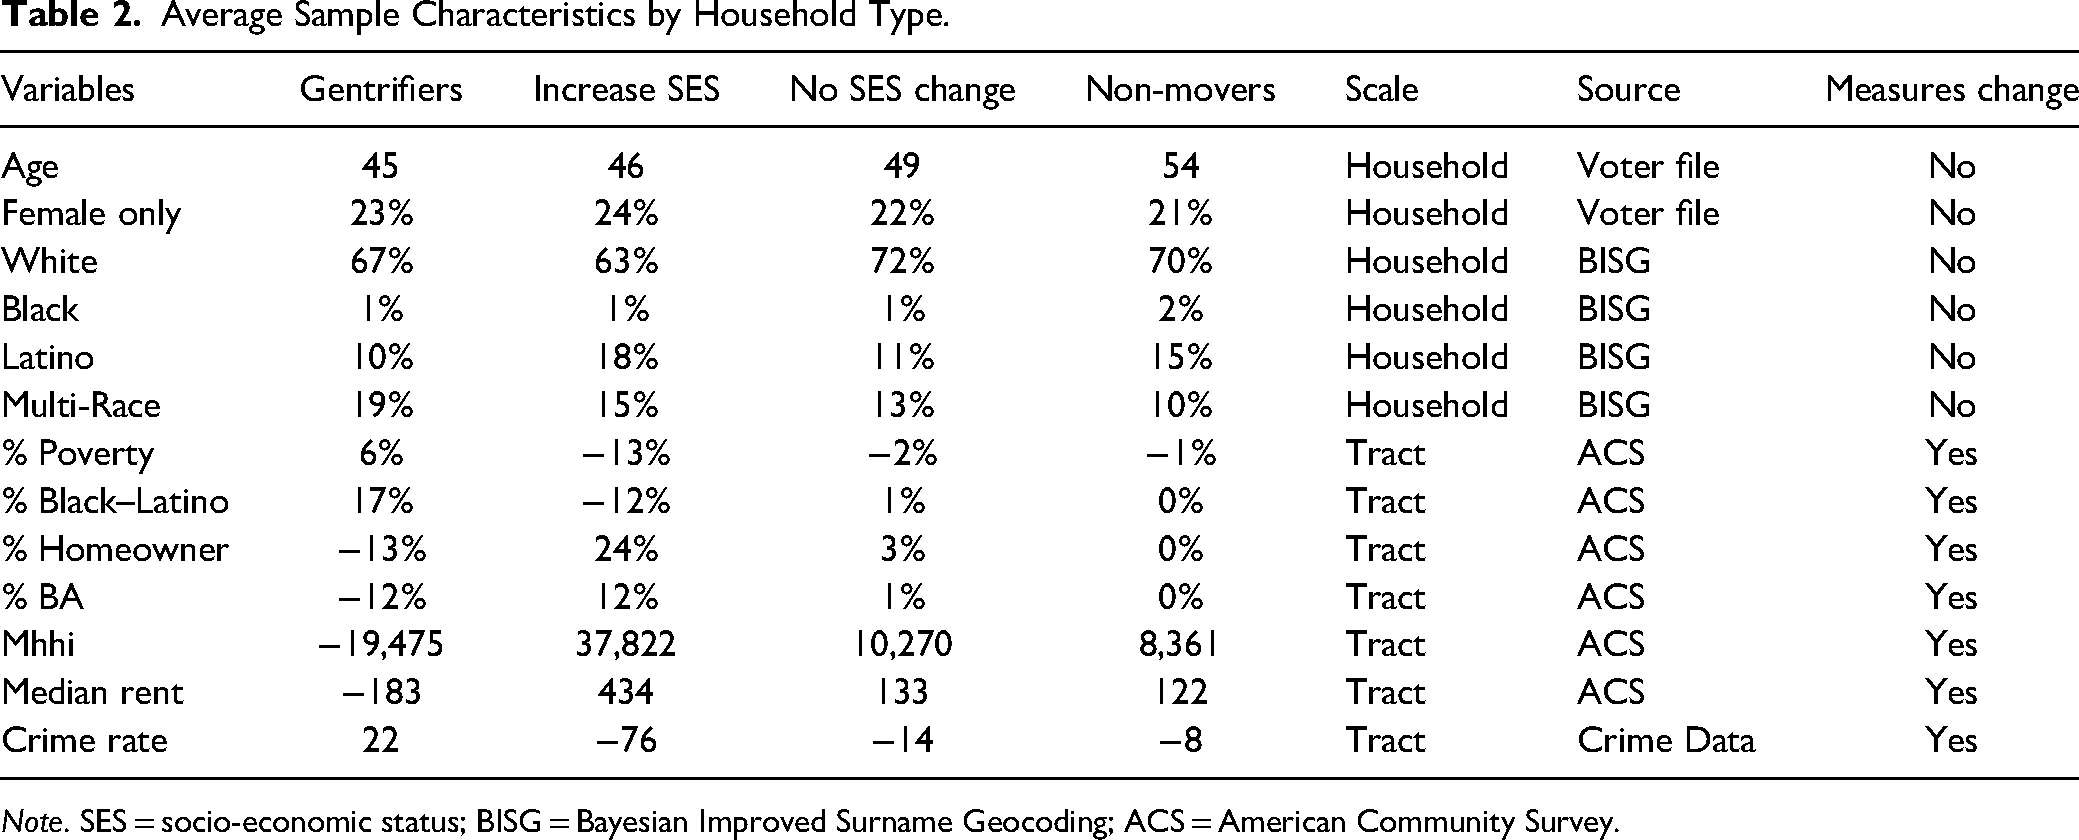
Note. SES = socio-economic status; BISG = Bayesian Improved Surname Geocoding; ACS = American Community Survey.
Crime
My next key explanatory variable is crime. As Table 2 demonstrates, there are on average greater levels of crime in gentrifiers’ new neighborhoods compared to their original neighborhoods. To fully account for crime in my models, I include controls related to the prevalence of certain types of crime as well as conduct sensitivity analyses with changes in violent crime and property crime as bounding variables. The crime data is from the Austin Police Department for 2014–2021. I hand-code each crime within the data based on the type of crime committed. Following the FBI’s Uniform Crime Reporting, 13 I distinguish first between violent crime and non-violent crime, and then between three types of crime (1) against persons; (2) against property; and (3) against society. These three types are exclusive, but there is overlap between the two buckets, that is, crimes in all three categories can be classified as violent or non-violent. I then aggregate the crime data to the census tract level. The final models control for changes in the number of violent crimes and changes in the number of property crimes.
Percent (%) Black and Latino
My final main explanatory variable is the percent of the population that is Black and Latino. For gentrifiers and other types of movers, this is the percent Black and Latino of the tract they move into, whereas for non-movers it is the percent Black and Latino of their census tract in the third year of the time span. I select these two groups specifically because of there strong historical presence in gentrifying neighborhoods and the lack of a long-term Asian population in Austin’s gentrifying neighborhoods. Furthermore, the racialization and stereotypes of Black and Latino, especially men, as dangerous or threatening are more prevalent and entrenched than they are for Asian Americans.
Estimation Strategy
I use generalized least squares (GLS) models with clustered standard errors to test my hypotheses. My dependent variable, change in calls to the police, generally follows a normal distribution; however, it has a very high frequency of zeros. 14 One potential approach to this type of distribution is to use a zero-inflated model, however, this assumes that the data-generating process for zero and non-zero values is distinct whereas in the context of my data, whether someone makes no calls to the police or a number of calls to the police stems from the same data-generating process. Poisson or negative binomial regression models are another approach since they are adept at handling data with excess zeros, but they require a dependent variable with all non-negative values. Since my key dependent variable, changes in calls to the police contains negative values, I instead use a GLS model.
A GLS model better handles heteroskedasticity and potential auto-correlation within households stemming from repeated observations of the same household across different time spans and correlation across time than traditional ordinary least squares (Greene 2012; Wooldridge 2010). 15 I also cluster my standard errors by unique household to account for potential auto-correlation within households.
The models I use to test each of my hypotheses all follow a similar format but have slight differences. Below I present the model used to test Hypothesis 2, and then articulate the slight differences for testing Hypotheses 1, 2a, and 3.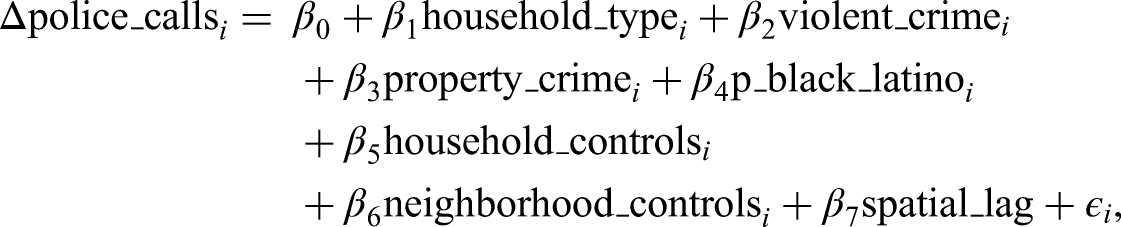
For all continuous variables, I use min–max normalization, scaling continuous variables between 0 and 1 to ensure that the units are standardized along with other independent variables in the regression. Putting continuous variables on a common scale ensures that the GLS algorithm does not assign more importance to variables with larger scales thus reducing the possibility of biased coefficients (Hox, Moerbeek, and Van de Schoot 2017; Montgomery, Peck, and Vining 2021). It also makes the coefficients more comparable across variables simplifying interpretation (Hastie et al. 2009; Hox, Moerbeek, and Van de Schoot 2017).
For testing Hypothesis 1, the dependent variable is the total number of calls to the police in the last year of the three-year window for household
Findings
Who Calls the Police in Gentrifying Neighborhoods?
My first analysis compares the demand for policing between gentrifier households and non-gentrifier households within gentrifying neighborhoods. Figure 2 plots the predicted annual calls to the police for gentrifiers vis-a-vis non-gentrifiers. The predicted calls to the police for gentrifiers are just under a call a year or 0.90 calls per year as compared to 0.83 calls for non-gentrifier households. While this difference may appear small, it is a statistically significant difference 16 and reflects that gentrifier households make about 13% more calls to the police per year than non-gentrifier households.
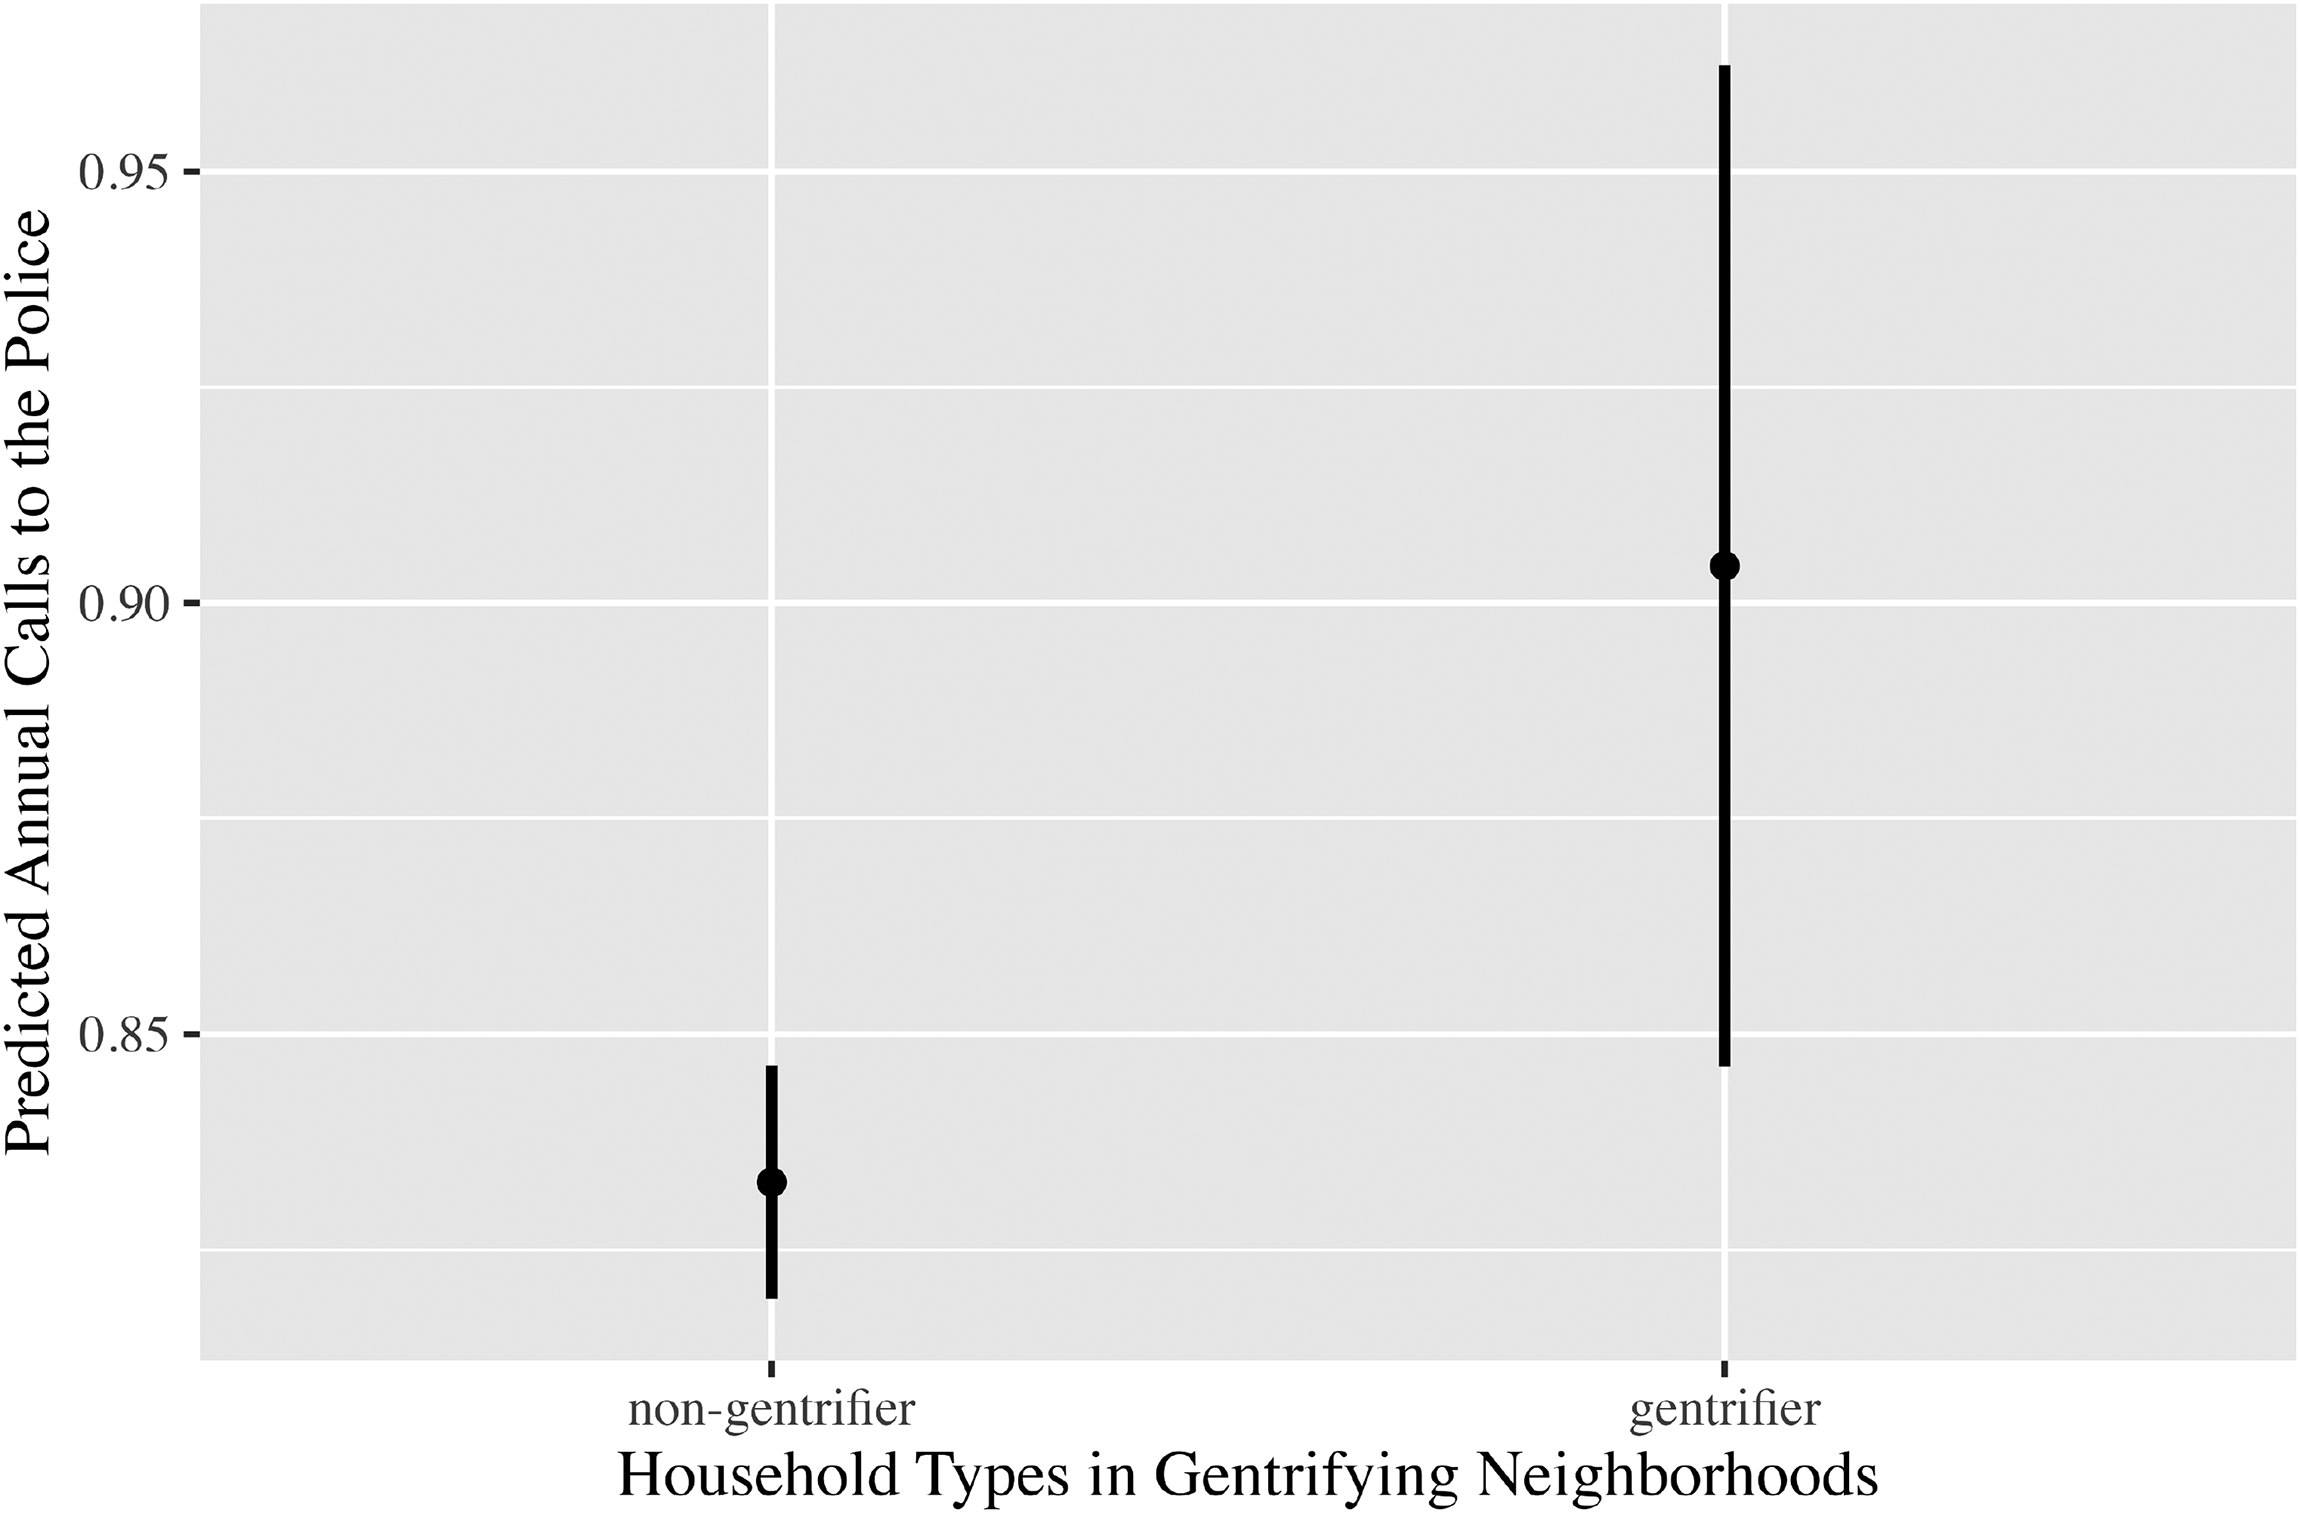
Demand for policing in gentrifying neighborhoods. X-axis are household types in gentrifying tracts.
These results demonstrate support for Hypothesis 1, gentrifier households demand greater policing compared to non-gentrifier households in gentrifying neighborhoods. Even taking into account neighborhood socio-economic conditions, racial demographics, and crime rates, gentrifiers are still significantly associated with greater numbers of calls to the police than non-gentrifiers. Furthermore, these results provide quantitative evidence to support the assumption present in previous qualitative and quantitative work that gentrifiers are a source of demand for policing within gentrifying neighborhoods. Yet it is still unclear whether this pattern is a reflection of gentrifier households being more likely to call the police than existing households in gentrifying areas or whether movement into a gentrifying area itself is related to greater demand for policing. Additionally, the results do not rule out the possibility that greater calls are simply a result of moving itself and being new to a neighborhood. The next analysis evaluates these potential explanations by testing the relationship between movement into differently resourced neighborhoods and changes in demand for policing.
Movement Into Gentrifying Areas and Demand for Policing
In order to more fully assess the relationship between gentrifiers and demand for policing, I conduct a second analysis testing the influence of movement into gentrifying tracts on changes in calls to the police. As the results in Figure 3 demonstrate, movement by gentrifier households is strongly and significantly associated with an increase in demand for policing. In support of Hypothesis 2, gentrifiers have a predicted increase of 0.32 police calls per year after moving into a gentrifying tract. This is even when taking into account changes in violent crime. The size of this predicted increase in calls is greater than both other types of urban movers and non-mover households. No SES change movers are associated with a small positive and significant increase while an increase in SES movers and non-movers is associated with decreases in annual calls to the police.
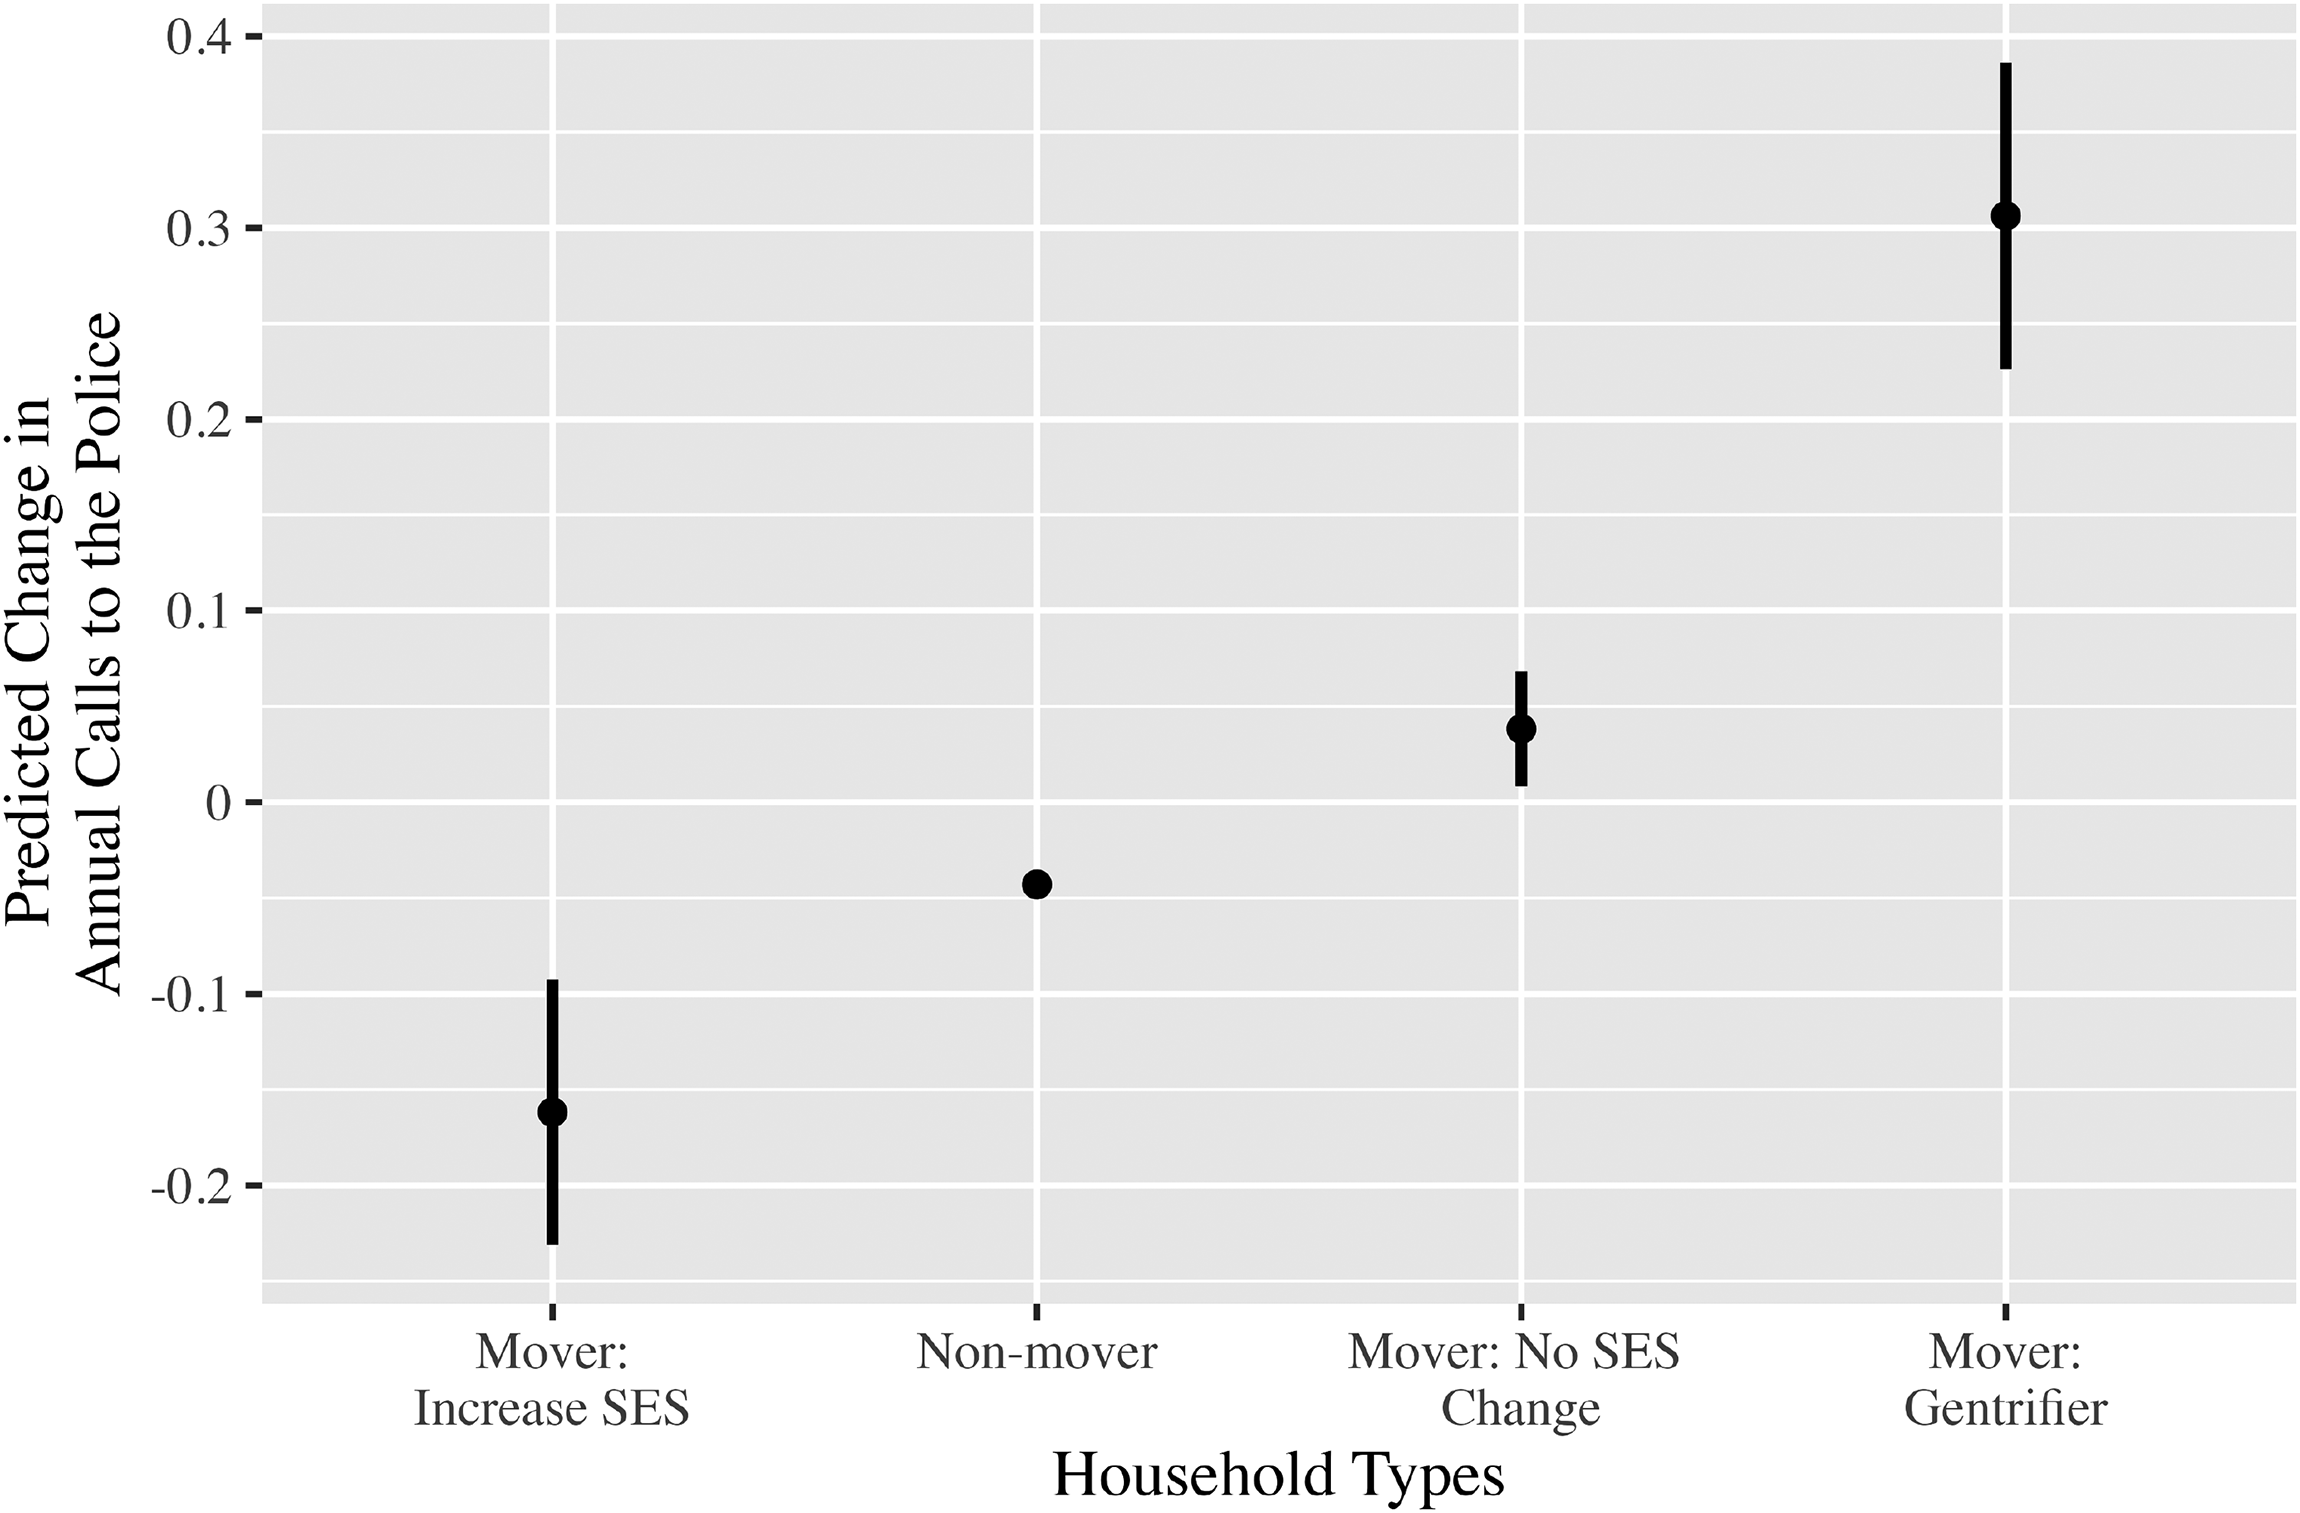
Urban movement and changes in demand for policing. X-axis are household types. Y-axis are the predicted change in annual calls to the police. Estimates from fully specified GLS regression models with controls at means. 95% CIs displayed. Associated regression estimates can be found in Appendix G7 in the Supplemental Material. Note. GLS = generalized least squares; CI = confidence interval.
These results provide support for Hypothesis 2, that for gentrifier households, movement into a gentrifying tract is associated with greater demand for policing. They also indicate a lack of support for the theory that increasing calls is simply related to movement into a new neighborhood. If movement itself was significantly correlated with increased police calls, the expected change for the other mover categories would also be positive and significant relative to non-movers, but this is not the case. Furthermore, the pairwise comparisons for gentrifier households relative to each of the household types, see Appendix H1 in the Supplemental Material, reveal a significant difference in changes in gentrifier demand for policing relative to not only non-movers, but also to each of the other household types.
The findings from this analysis also indicate that moving into a gentrifying area is positively and significantly associated with greater calls to the police even when taking into account changes in crime. Results from the fully specified model include controls for changes in violent crime and changes in property crime. As the results in Appendix G7 in the Supplemental Material indicate, changes in property crime are most prognostic for increases in annual calls to the police, however, even when controlling for changes in both property crime and violent crime, there is a significant relationship between gentrifiers and greater demand for policing. Moreover, when conducting sensitivity analyses with changes in property crime and violent crime as bounding variables, I find that in order to attenuate the positive relationship between gentrifier households and increases in demand for policing, an omitted variable would need to be forty-six times as influential as changes in violent crime and eighty-seven times as influential as changes in property crime. For sensitivity analyses with the bounding variables as the change in violent crime and change in property crime, see Appendix I in the Supplemental Material. This demonstrates the robustness of the finding that movement by gentrifiers into gentrifying areas is significantly correlated with increases in calls to the police. Thus, I do not find evidence for the theory that crime alone explains demand for policing, but rather that changes in crime cannot fully explain the relationship between gentrifiers and greater demand for policing.
One additional consideration is that the results may be driven by “super-callers,” a small subset of gentrifier households that make an abundance of calls to the police. To investigate whether this is the case, I use a
In order to further analyze differences in call behavior between gentrifier households and other urban households, I run additional models testing the influence of the household mover category on making order maintenance (OMP) versus non-order maintenance 311 and 911 requests (non-OMP). This allows for a deeper understanding of the nature of household demand for policing as it relates to the mode of police contact and the type of request.
Within Figure 4, the panel on the left plots predicted change in 311 requests by request type for each household type. These results demonstrate that there is a positive and significant relationship between gentrifier households and OMP 311 requests after moving into a gentrifying tract, but no significant relationship between gentrifiers and non-OMP 311 requests. This contributes to the body of evidence from prior work linking gentrification to specifically OMP. Interestingly, this same relationship does not hold for other household types as there is no significant relationship for the other categories and increases in 311 OMP calls after moving.
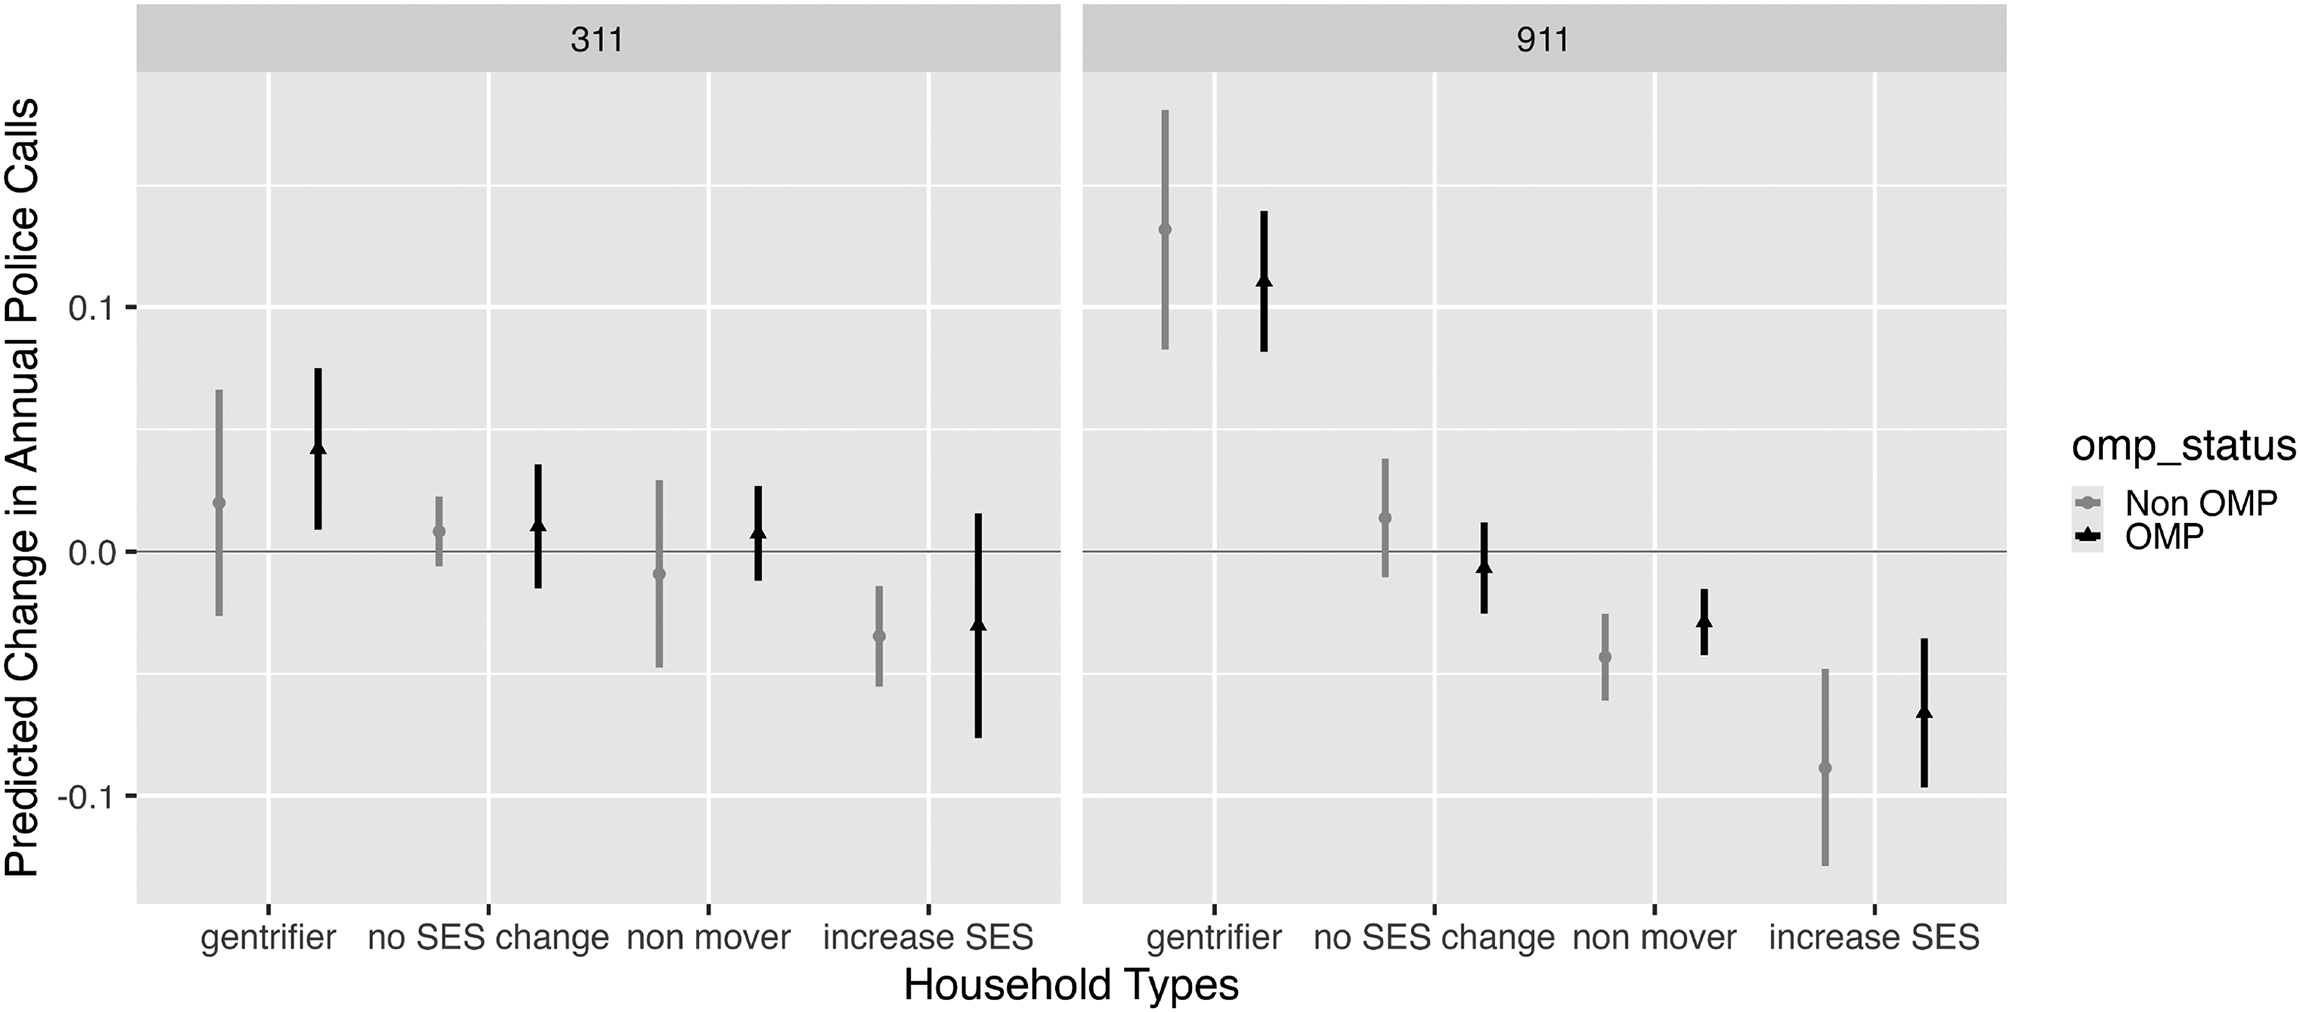
Urban movement and changes in demand by request type. X-axis are the different mover types. Y-axis are the changes in predicted annual requests. Panels represent 311 and 911 requests. Circles and light gray error bars denote estimates for all types of requests. Triangles and black error bars denote estimate for OMP requests. Estimates from fully specified GLS regression models. 95% CIs displayed. Associated regression estimates can be found in Appendix G8 in the Supplemental Material. Note. OMP = order maintenance policing; GLS = generalized least squares; CI = confidence interval.
Like the 311 requests, for 911 calls, there is a positive and significant relationship between gentrifier households and OMP 911 calls, but this same relationship holds between gentrifiers and non-OMP 911 calls. This could be related to the more pro-active nature of OMP requests leading gentrifiers to make them through the 311 hotline, typically used for non-emergencies. It also could be the case that gentrifiers perceive an overall heightened sense of danger and report OMP-related requests as more serious offenses when making 911 calls. Of note is that for the other household types, there is no significant positive correlation with 911 OMP calls, suggesting that although gentrifiers are generally making more 911 calls overall, they also still exhibit a unique relationship to OMP calls relative to other types of movers.
These results provide additional evidence that gentrifier demand for policing is not exclusively a response to greater levels of crime in gentrifying areas but also to gentrifiers’ perceptions of the quality of life and sense of order in their new neighborhoods, perceptions that are more subjective in nature and as previous research has shown, often influenced by racial stereotypes. In order to more directly interrogate the role of race, I conduct a third analysis testing how neighborhood racial demographic context relates to gentrifier demand for policing (Figure 5).
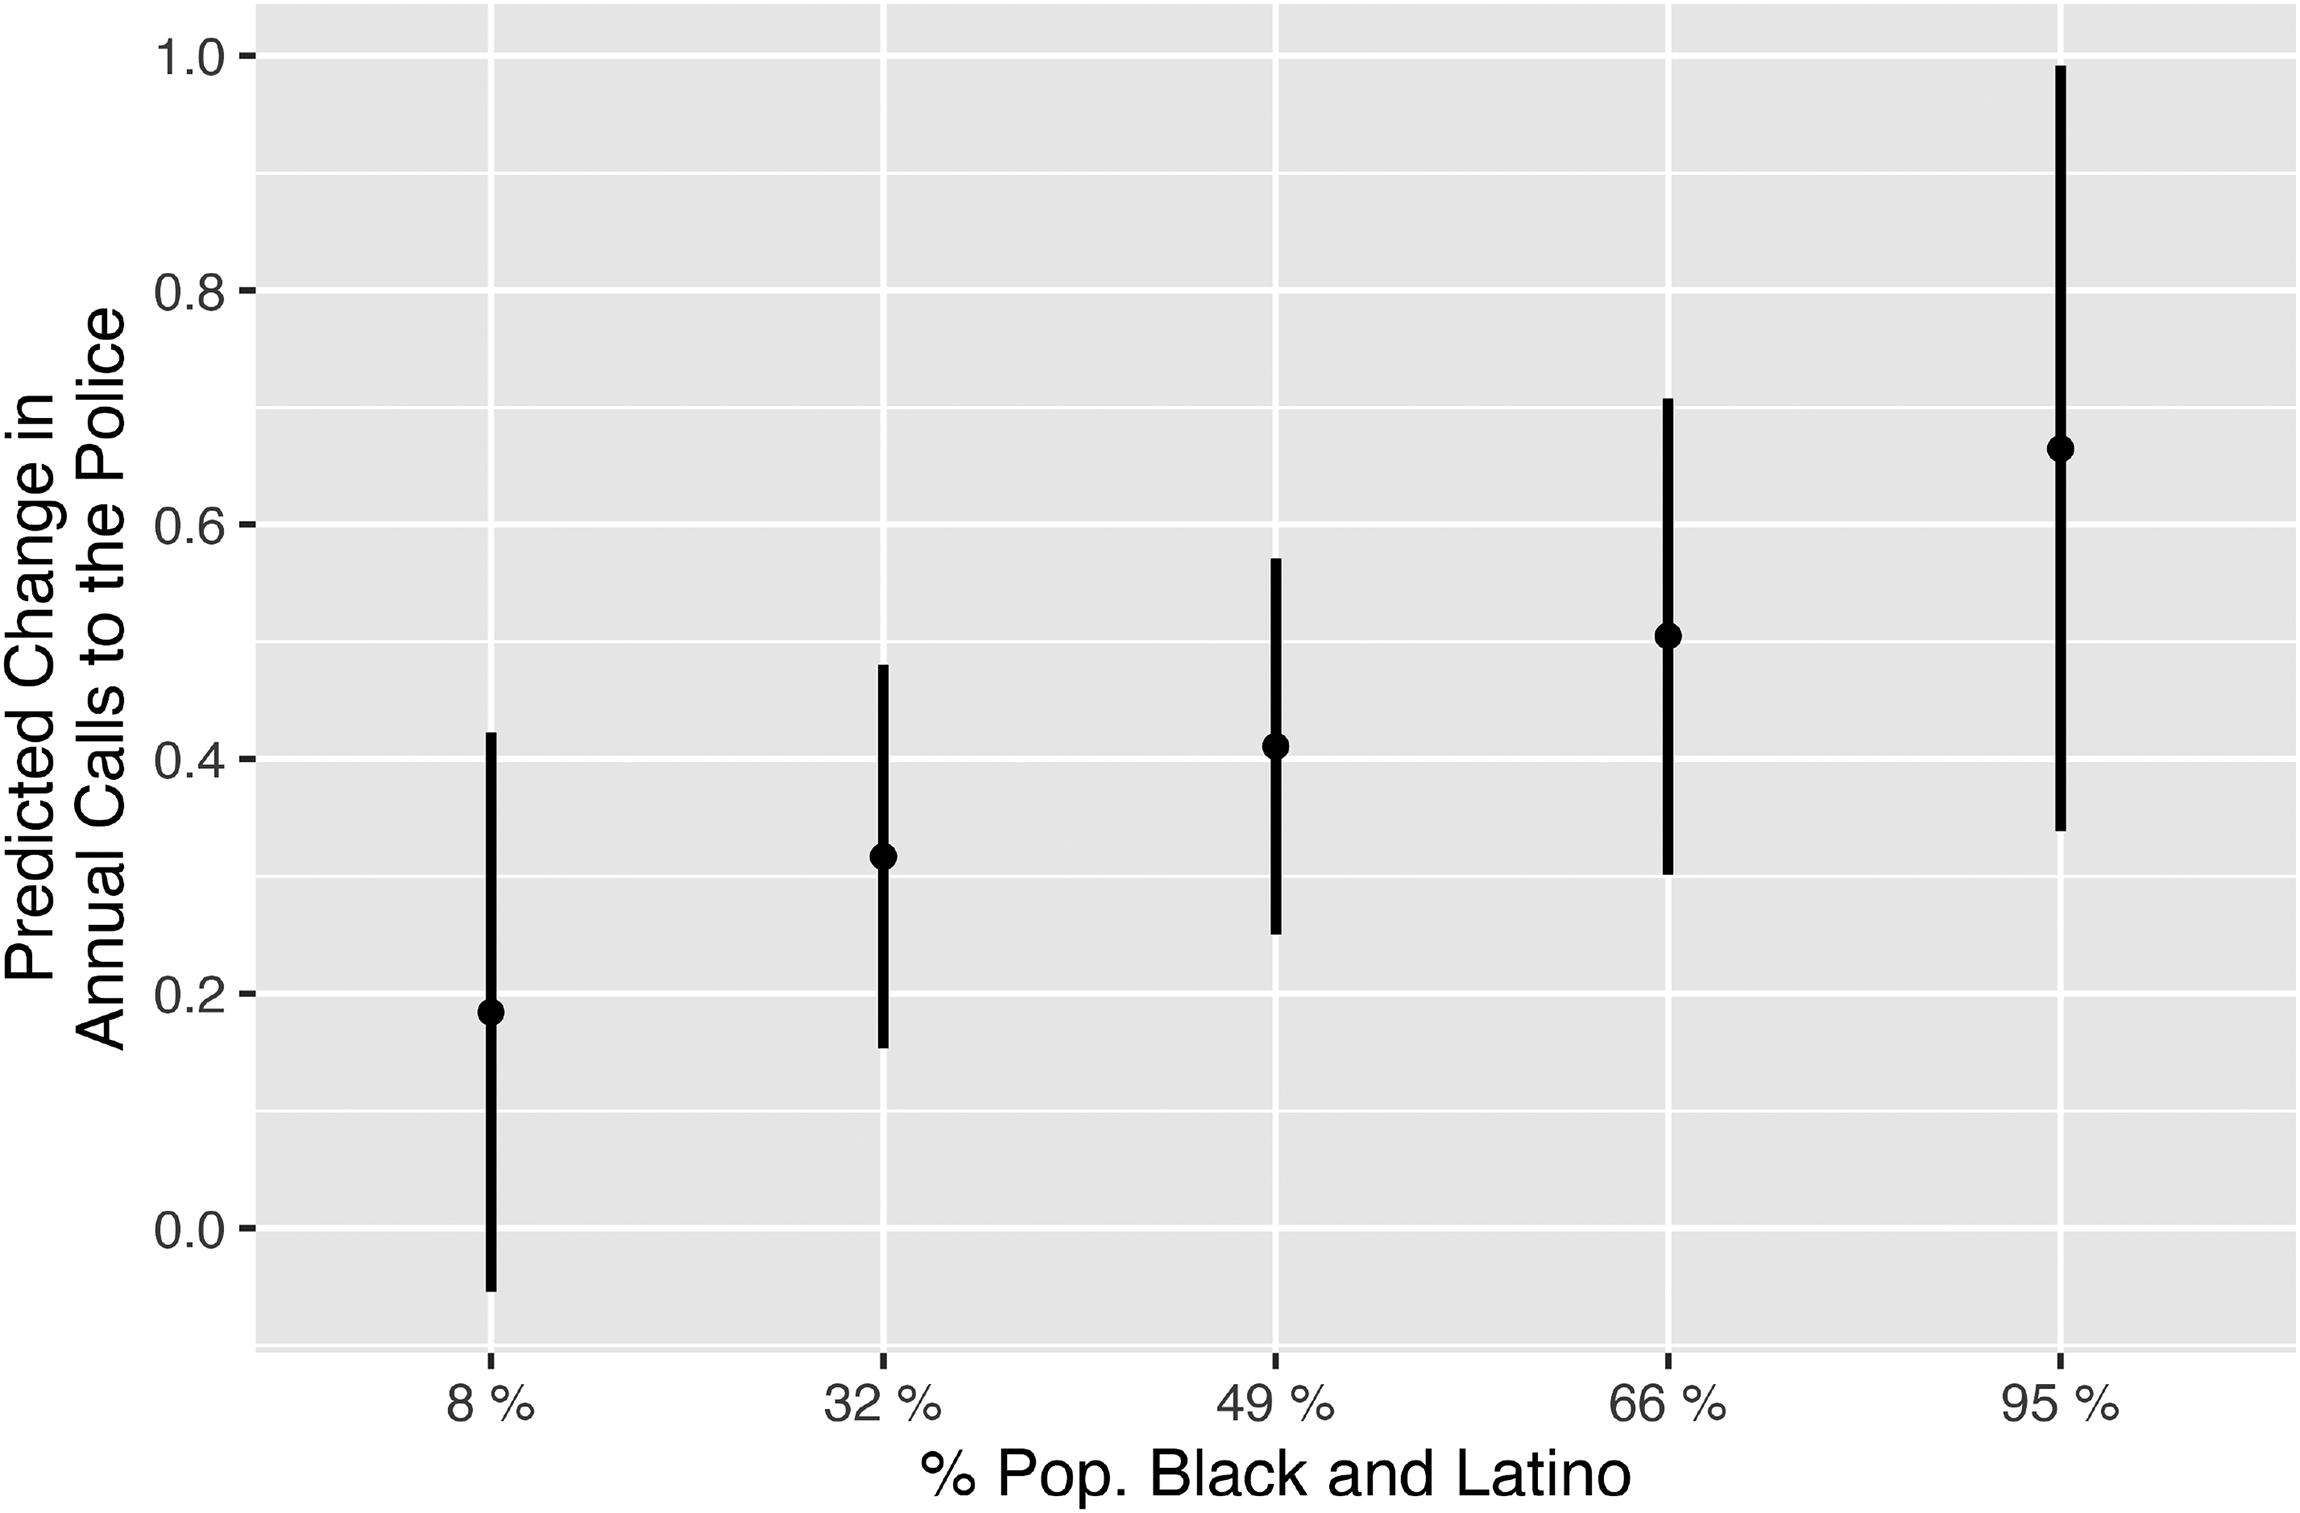
Among gentrifier households: change in demand for policing by % Black-Latino. X-axis is the % of the population that is Black and Latino. Y-axis is the predicted change in annual calls to the police. Estimates from fully specified GLS regression models with controls at means. 95% CIs displayed. Associated regression estimates can be found in Appendix G9 in the Supplemental Material. Note. GLS = generalized least squares; CI = confidence interval.
Neighborhood Racial Context and Gentrifier Demand for Policing
To assess whether gentrifier households’ demand for policing is exacerbated when moving into heavily non-White spaces, I first test the correlation between the percent of the population that is Black and Latino and increases in demand for policing among only gentrifier households. This allows me to test the relationship between gentrifier demand for policing and neighborhood racial composition, holding a general level of socio-economic change (the changes associated with gentrification) constant.
Figure 5 displays the results from this test, indicating support for Hypothesis 3, that gentrifier households that move into neighborhoods with greater proportions of Black and Latino residents demonstrate relatively greater demand for policing. For example, gentrifiers who move into a neighborhood where 49% of the population is Black and Latino (the mean for gentrifying tracts) have a predicted change of 0.41 calls per year compared to those who move into a neighborhood where 66% of the population is Black and Latino (1 standard deviation above the mean) who have a predicted change of about 0.51 calls per year, a 24% increase. Since I use a solely class-based measure of gentrification, these findings demonstrate that changes in neighborhood SES do not fully account for the relationship between gentrifiers and demand for policing. Gentrifier households that move into majority Black and Latino tracts are associated with greater annual calls to the police than gentrifiers that move into Whiter tracts. This evidence supports the theory that gentrifiers, largely White households within my sample (see Table 2) associate greater Black and Latino populations with greater levels of neighborhood disorder or danger and respond by calling the police.
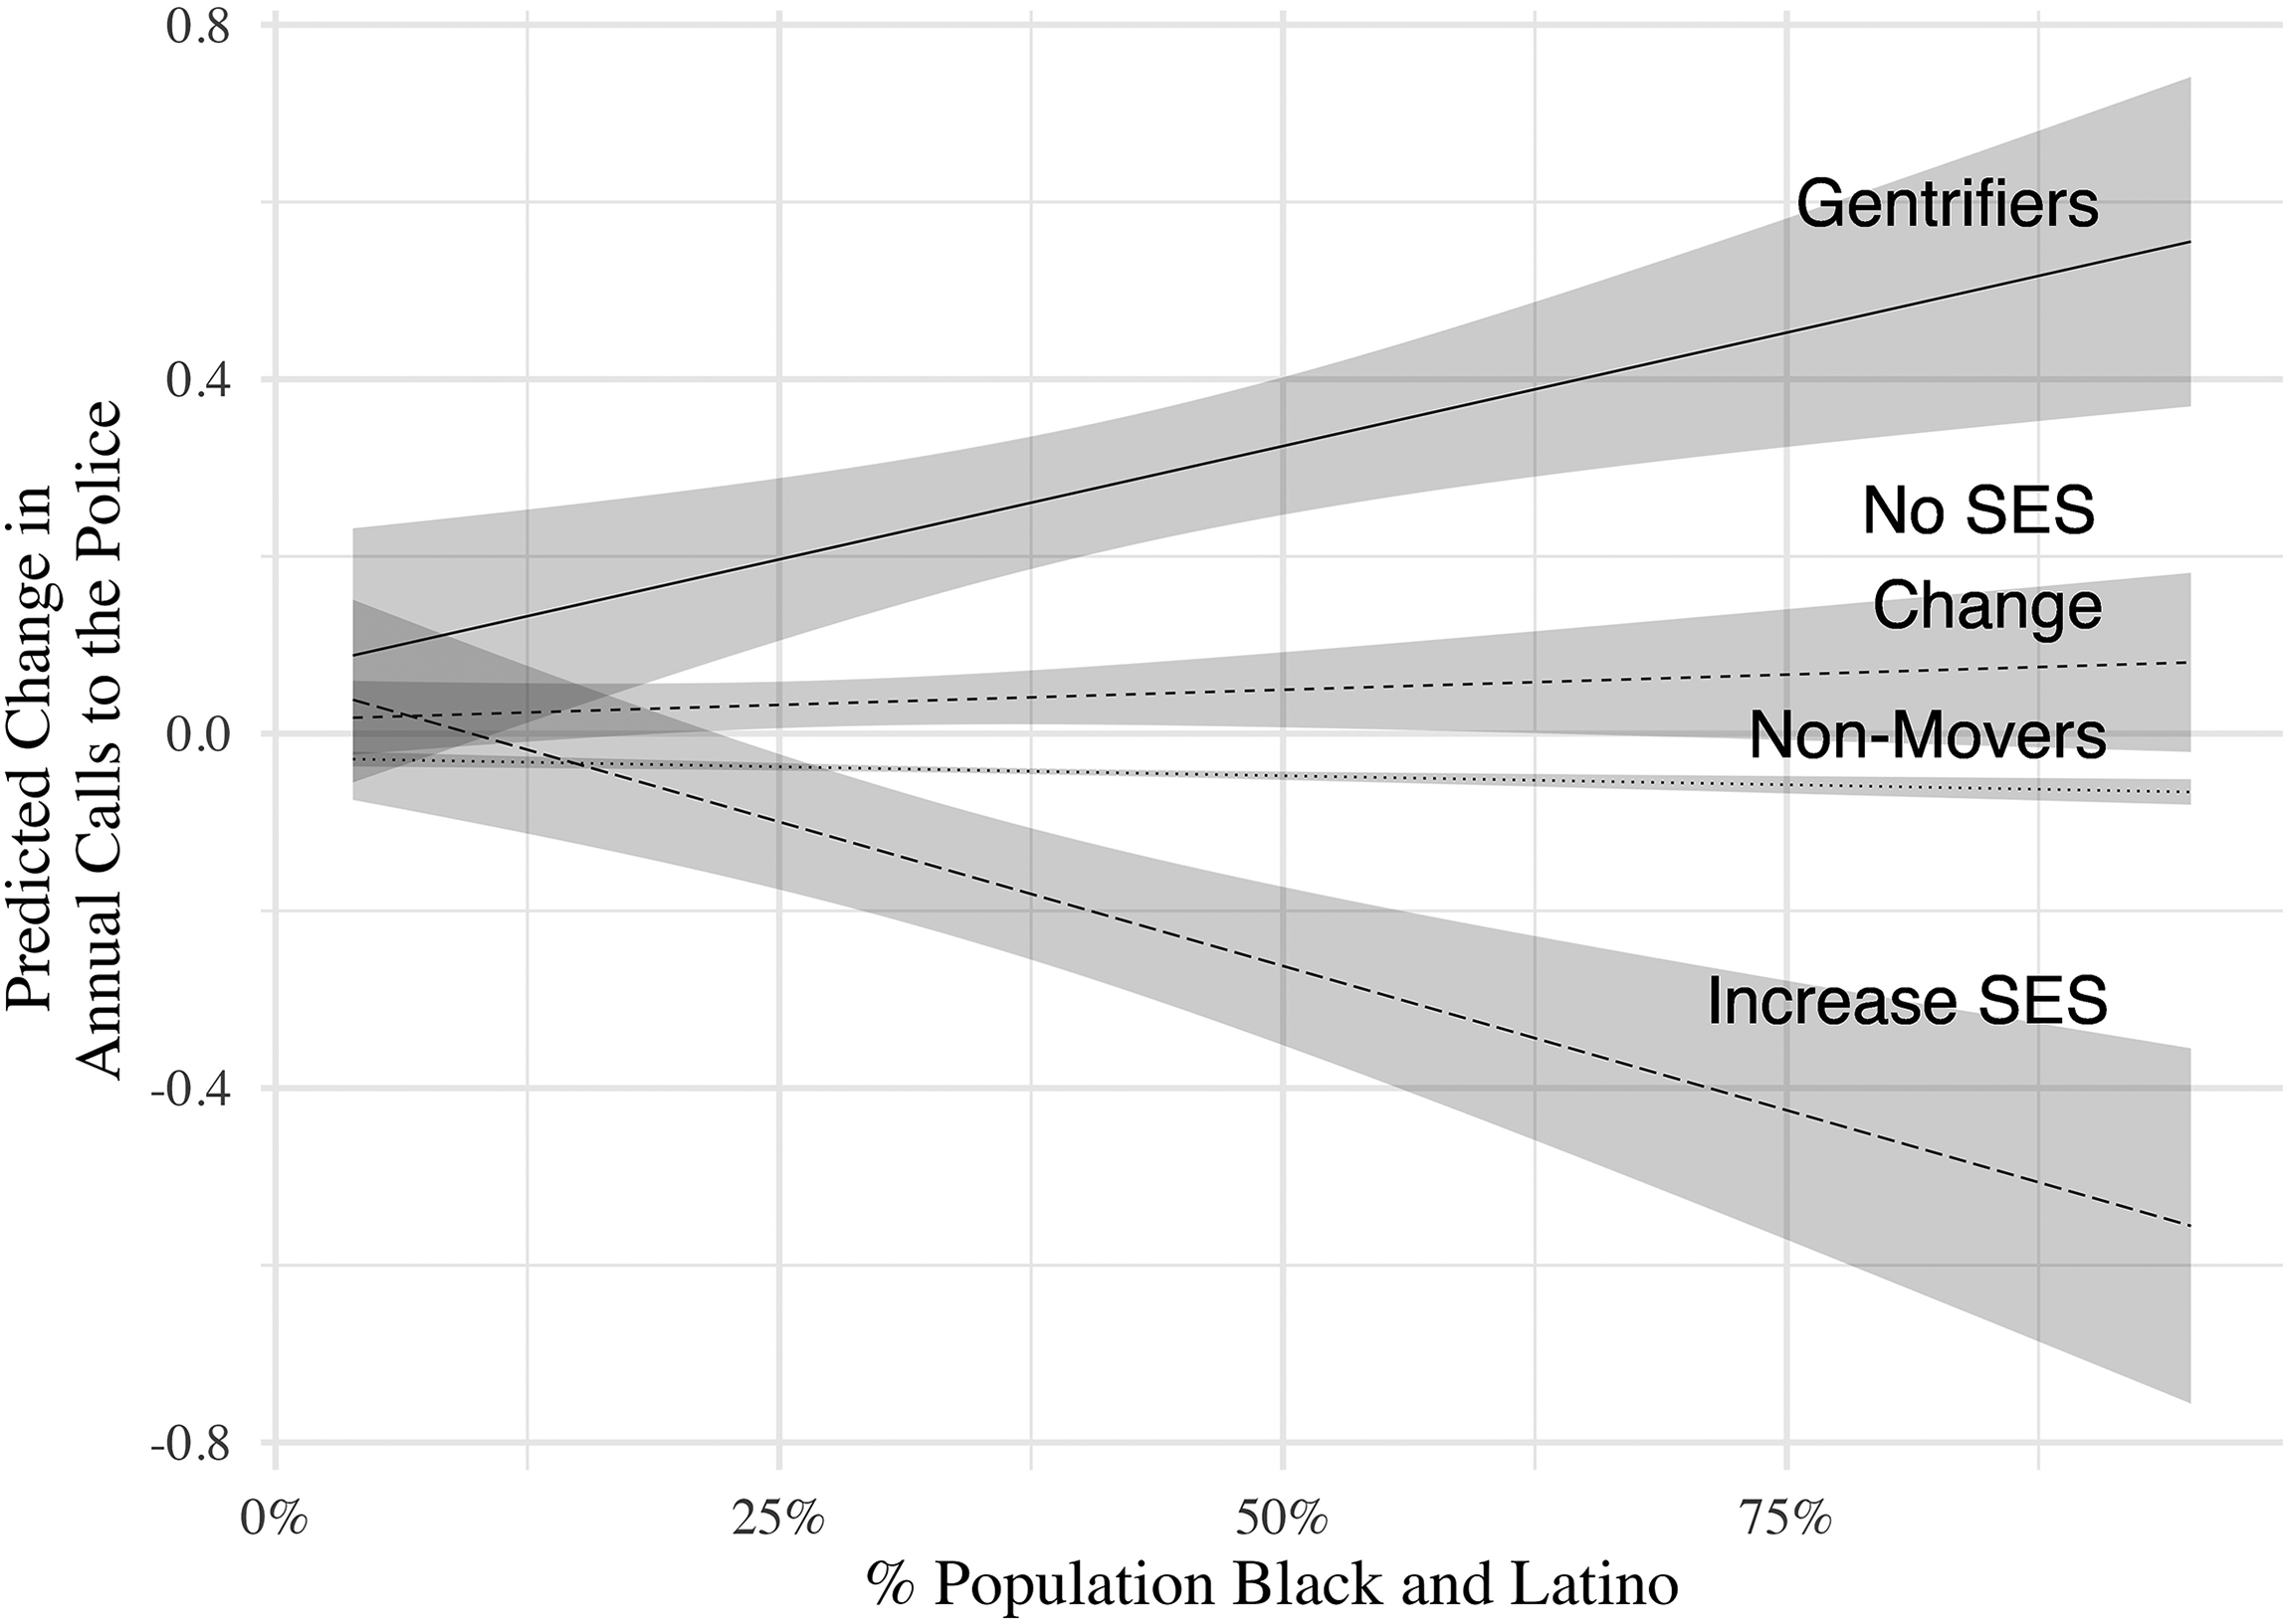
Among all households: change in demand for policing by % Black-Latino. X-axis is the % of the population that is Black and Latino. Y-axis is the predicted change in annual calls to the police. Estimates from fully specified GLS models. 95% CIs displayed. Associated regression estimates can be found in Appendix G10 in the Supplemental Material. Note. GLS = generalized least squares; CI = confidence interval.
The results in Figure 5 suggest that movement into more non-White spaces plays a role in amplifying gentrifier demand for policing, however, it remains unclear whether this is a story specific to gentrifiers or whether all residents increase their demand for policing when living in areas with greater proportions of Black and Latino residents. To evaluate the relationship between racial demographic composition and demand for policing for gentrifiers relative to other types of households, I conduct a moderation analysis interacting the percentBlack and Latino 17 with each household type.
Figure 6 displays the marginal effects from my model interacting household type with the percent of Black and Latino residents in the neighborhood. The results indicate that the strongest relationship exists between gentrifier households and demand for policing as the percent Black and Latino increases. No SES change movers also have a positive relationship between movement into more non-White tracts and calls to the police, however, the change in predicted annual calls is smaller than it is for gentrifier households, while for both non-movers and increased SES movers, there is a negative relationship between increases in the non-White population and calls to the police.
In order to assess whether this pattern exists among all racial subgroups or is specific to the White households in my sample, I conduct a subgroup analysis. Among only White households, the interaction for gentrifier households and percent Black and Latino is again positive and significant but so too is the interaction of no SES change and percent of Black and Latino unlike in the full sample. 18 This suggests that White households outside of those that are gentrifiers are behaving similarly when moving into more non-White contexts. Among Latino households, I find similar results among gentrifiers but not among other types of movers, whereas for Black and Asian households, there are no significant effects for either of these groups (although among Asian households, there is a positive and significant relationship with increase SES movers and percent Black and Latino).
This suggests that the results in the full sample are being driven largely by White and Latino gentrifiers, and that demand for policing among these groups may be particularly influenced by the percent Black and Latino in the neighborhood they move into, but for non-White groups, this relationship does not persist for other movers and non-movers. The null results among Black households could be due to a unique relationship between Black Americans and the police due to past and current experiences with police discrimination and state violence. However, it could also be an indication of an anti-Blackness that extends beyond White gentrifiers to Latino gentrifiers and potentially Asian households even moving into higher SES neighborhoods. It is important to note that the BISG method for imputing race often misclassifies Black individuals in wealthier, Whiter neighborhoods (Argyle and Barber 2024) and may be misclassifying potential Black gentrifiers. Nonetheless, these results suggest that Black gentrifiers may behave in categorically distinct ways from other gentrifiers. Greater scholarly attention is needed to assess the relationship between racial identity and gentrifier behavior, particularly with regard the Black individuals or households that move into gentrifying areas.
Ultimately, the influence of neighborhood racial demographics on demand for policing could be a consequence of the fact that of the household types, the tracts gentrifiers move into have on average the greatest percentage of Black and Latino residents relative to each of the other resident types. Therefore, it could be the case that all White residents behave similarly in demanding more policing after moving into non-White spaces, but that gentrifiers are most likely to move into more non-White neighborhoods. Greater research is necessary to tease out the mechanism behind gentrifiers’ greater demand for policing when moving into non-White spaces. Regardless of the precise psychological factors behind this increased demand, these results indicate that the relationship between gentrification and policing is racialized with gentrifiers greatly increasing their demand for policing after moving into more non-White spaces. Future research should attempt to better unpack the role of race in gentrifier identity and behavior as this has major implications for the future study of gentrification.
Conclusion and Implications
This paper examines whether and how gentrifiers increase their demand for policing. By introducing a novel, household-level approach to the analysis of gentrification and policing, I pinpoint the source of increased demand for policing in gentrifying neighborhoods and establish the relationship between neighborhood-level poverty and ethno-racial composition on gentrifier behavior.
Contrary to traditional theories, increased demand for policing by gentrifiers is not simply related to greater crime. Instead, gentrifier demand for policing is strongly related to exposure to higher levels of poverty and more Black and Latino residents. More specifically, gentrifiers increase their demand following movement into gentrifying contexts, particularly demand related to OMP. As they increase their 311 requests and 911 calls, gentrifiers simultaneously demand greater government attention and investment while policing who receives the benefits.
Substantively, a rise in calls to the police carries potentially pernicious consequences for Black and Latino residents. Research finds that greater citizen-initiated calls are associated with a greater police presence in the area and even higher rates of future pro-active policing (Braga et al. 2019; Geller and Fagan 2019; Oglesby-Neal, Stern, and Pettit 2020). Thus, greater gentrifier demand for policing may heighten the risk of police-encounters for traditional residents of gentrifying neighborhoods, with potentially detrimental consequences for Black and Latino residents who face greater risks of police use-of-force (Omori, Lautenschlager and Stoler 2022), and fatal encounters (Mitchell and Chihaya 2022), particularly when living nearby or moving through majority White spaces (Gaston 2019; Zhao, Tse-Chuan, and Messner 2019). The potential for heightened police activity could also further entrench racial and class inequalities in urban centers as long-term residents face not only the threat of economic displacement but also the threat of increased surveillance and criminalization.
This paper takes an important step in empirically establishing that gentrifier demand for policing is a component of increased policing in gentrifying areas. It further provides evidence that gentrification matters for the behavior of urban residents. Outside of interactions with the state, gentrification likely has implications for numerous avenues of political behavior from voting in local elections to joining neighborhood organizations. Canonical work in local politics ascribes the greatest power and influence to homeowners or wealthy, largely White residents of suburbs outside of central cities. How might this be changing as increasing numbers of well-resourced White residents move into central city areas? Furthermore, how should scholars consider the influence of race in gentrifier identity, as more affluent, non-White residents move into gentrifying neighborhoods? Future research should investigate the extent to which gentrifiers hold distinct political preferences and behaviors relative to both long-term residents and the types of voters that traditionally hold influence in local politics.
Gentrification also has the power to shift the political behavior of existing communities. To the extent that gentrification breaks down existing community ties and institutions, it may be politically demobilizing for long-term residents, particularly lower-income residents or communities of color. Conversely, if long-term residents anticipate the effects of gentrification in their neighborhoods, we may see growing political counter-mobilization. Delving into the politics of gentrification presents a promising avenue for political scientists, offering the opportunity to unveil intricate dynamics shaping the interactions between the mass public, private actors, and government officials within urban landscapes.
Supplemental Material
sj-pdf-1-uar-10.1177_10780874251330255 - Supplemental material for New Faces, Changing Spaces: How Gentrification Shapes Household Demand for Policing
Supplemental material, sj-pdf-1-uar-10.1177_10780874251330255 for New Faces, Changing Spaces: How Gentrification Shapes Household Demand for Policing by Allison Verrilli in Urban Affairs Review
Footnotes
Declaration of Conflicting Interests
The authors declared no potential conflicts of interest with respect to the research, authorship, and/or publication of this article.
Funding
The authors received no financial support for the research, authorship, and/or publication of this article.
Supplemental Material
Supplemental material for this article is available online.
Notes
Author Biography
References
Supplementary Material
Please find the following supplemental material available below.
For Open Access articles published under a Creative Commons License, all supplemental material carries the same license as the article it is associated with.
For non-Open Access articles published, all supplemental material carries a non-exclusive license, and permission requests for re-use of supplemental material or any part of supplemental material shall be sent directly to the copyright owner as specified in the copyright notice associated with the article.