
Abstract
Is local politics shaped by groups and interests or party and ideology? Classic literature posits that local politics differs from national politics and centers on groups and interests rather than ideology, especially in settings with nonpartisan elections. A separate literature casts doubt on this, finding a connection between partisan voting, local ideology, and policy mimicking the federal level and without reference to groups and interests. In this paper, I use a large original dataset on the professional backgrounds of city councilors to provide a link between the evidence for both theories. I look at city council candidates from all 477 cities in California between 1996 and 2021, observing both candidates' career histories through their ballot designations and party affiliations through their public voter records. I find that liberal cities have more career politicians, non-profit workers, and service-based professionals running for and holding office, while conservative cities have more military and law enforcement workers and business types running for and holding office. Career politicians, non-profit workers, and service-based professionals are more likely to be registered as Democrats and military and law enforcement workers and business types are more likely to be registered Republicans. In this case group membership and party affiliation are tightly coupled.
A traditional view holds that local politics is different from national politics and centers on groups and interests not ideology, especially in settings where local officeholders are elected in nonpartisan elections. Anzia (2021) writes that “much of what is most important about local politics is probably not well explained by nationally forged partisan and ideological commitments.” In this traditional view, scholars emphasize the importance of candidate identities beyond party, including occupation (Carnes 2013; Kirkland 2021), homeowner status (Einstein, Glick, and Palmer 2019; Hankinson 2018), race (Barreto 2007; Hajnal and Trounstine 2014), and gender (Holman 2014).
Some issues of local importance like zoning and city services do not have clear national parallels. In support of the traditional view of local politics are surveys that specifically ask questions about local policy areas and find that Republicans’ and Democrats’ local preferences can look more similar than dissimilar (e.g., Jensen et al. 2021; Marble and Nall 2021). Some studies show the partisanship of local elected officials does not drive various policy outcomes (e.g., Ferreira and Gyourko 2009; Thompson 2020).
A differing view casts doubt on this, finding a connection between partisan voting, local ideology, and policy mimicking the federal level and without reference to groups and interests. Warshaw (2019) writes that “it is now clear that partisanship and ideology have played important roles in local politics for at least the past few decades.” This view emphasizes that in nonpartisan races candidates signal their party (Ferreira and Gyourko 2009) and learning about issue positions affects vote choice (Sances 2018). Cities elect politicians and policies that represent their ideological character (Tausanovitch and Warshaw 2014) and scholars have shown that local politics has nationalized in the sense that national party labels hold more sway in local politics than they once did (Hopkins 2018). Some studies show the partisanship of local elected officials does in fact drive policy outcomes (e.g., de Benedictis-Kessner, Jones, and Warshaw 2025; de Benedictis-Kessner and Warshaw 2016; Einstein and Kogan 2016).
To what extent can we separate candidates’ party affiliations from their group memberships and personal interests? This article uses one particular local group and identity, occupation prior to office, to show that partisanship and background are tightly correlated and often inseparable. While there are many local groups and interests, I use occupation prior to office because it is a salient identity for local elected officials and recent research shows it weighs heavily in municipal politics (e.g., Atkeson and Hamel 2020; Carnes 2013; Kirkland 2021; Kirkland and Coppock 2018). Relative to other traits elected officials hold, occupation is understudied because of sparse data availability. Finally, recent research on amateurism shows candidates are increasingly elected with no prior experience, which could put more emphasis on whatever it is they did for work before running (Porter and Treul 2025).
I expect there to be a strong correlation between city partisanship and the occupations of emergent candidates for three reasons. First, general models of candidate emergence and strategic candidate entry suggest that individuals consider the benefits of holding office, their probability of winning, and the costs or risks associated with running (Jacobson and Kernell 1983; Osborne and Slivinski 1996; Schlesinger 1966). People will be more likely to run for city council when they expect to win. Therefore individuals from occupations that are strongly associated with one party should be more likely to run in cities where the party is dominant. Second, existing work on political ambition separates this key attribute into expressive ambition, which is the rational ways people navigate political opportunity structures and decide which higher level offices to pursue, and nascent ambition, which determines whether or not someone considers candidacy in the first place. Nascent ambition is the component of political ambition that applies to city council. The most significant factor in nascent ambition is self-perceived qualifications for office. Richard Fox and Jennifer Lawless surveyed thousands of individuals from various careers with objectively similar qualifications for office, but those who perceived themselves as being qualified were much more likely to run (Fox and Lawless 2005). People with careers that represent the dominant party's policy priorities will be more likely to feel qualified to hold office because they have a representative descriptive trait. Third, and finally, people actively choose their sphere of work and choose their political party to align with their values and these sociological affiliations are mutually reinforcing (Egan 2020).
To speak to the theoretical debate and mixed empirical evidence, I analyze an original panel dataset with hundreds of cities and thousands of California candidates. I observe candidates’ occupations prior to office as well as their party affiliations. These are difficult traits to observe at scale in nonpartisan, local races. Candidates’ occupations are coded based on their ballot designations. Ballot designations, required of all California candidates and meant to create a more informed electorate, must faithfully designate the candidate's primary occupation in a few words. Party affiliation is observed by looking up candidates in public voter files. I validate results on a smaller, cross-sectional national sample of large cities.
I find that the party character of the city is predictive of the career types who run and win; specifically, liberal cities have more career politicians, non-profit workers, and service-based professionals running for and holding office, while conservative cities have more military and law enforcement workers and business types running for and holding office. At the same time, the career type of the candidate is predictive of their individual party affiliation. Career politicians, non-profit workers, and service-based professionals are more likely to be registered as Democrats, whereas military and law enforcement workers and business types are more likely to be registered Republicans. In sum, any study that argues for a causal effect of electing an occupational class will struggle to rule out the effects of party, and any study that argues for a causal effect of electing a party member will struggle to rule out the effects of occupation. While this fact may not seem surprising, it has gone overlooked, and bringing data to this link synthesizes divergent theory.
Descriptive Results and Data
California Elections Data
The sample of California cities uses the California Elections Data Archive (California Elections Data Archive (CEDA) 2003). This database contains all city council candidates on the ballot in California between 1996 and 2021 and lists their ballot designations. Ballot designations in California offer candidates a few words to convey their most recent occupation. State law requires that candidates report faithfully on their most recent employment. There have been legal challenges to proposed ballot designations (Nemerovski 2021). Strategic self-representation by candidates complicates the process of obtaining reliable occupation data from any source. For instance, candidates can lie or paint themselves in a favorable light on their websites or LinkedIn pages with no oversight, so gathering occupational data from these sources would likely be less reliable than the ballot designation. Even though the ballot designation has legal oversight, measuring candidate occupation using the ballot designation has the potential to introduce measurement error. The CEDA data runs from 1996 to 2021 offering occupational information on over 26,000 bids for seats on council in 477 cities both large and small. 1 Using the ballot designation to categorize candidates by occupation has precedent in the local politics literature (Atkeson and Hamel 2020) and has the advantage of using the same information voters see when profiling the candidates themselves during the course of the election.
Categorizing Occupation
To classify candidate occupations, I use the coding schema developed by Carnes (2013). The nine categories that I use are politician or staff member (incumbent, Congressional staffer, and city clerk), business owner/executive (CEO, small business owner, and financial advisor), business employee (insurance agent and realtor), service-based professional (nurse and teacher), technical professional (engineer), military or law enforcement (police, fire, and retired Navy), non-profit worker (management and employees), lawyer (private practice and public defender), and laborer/worker (waiter and carpenter). I omit the category of farm owner from the Carnes (2013) coding because of my focus on cities and the natural bucketing of farm owner into business owner. I add in the category of non-profit worker because of its frequency in the data and the close relationship between city governments and non-profits for local public goods provisioning (Mathews 2020). These nine categories are ideal for my analysis because they have precedent in the literature and strike a balance between being general enough to capture large segments of the sample but not too general so as to obscure the information that was on the ballot designation to begin with. 2 More detailed examples of each category are available in the Supplemental Appendix.
Descriptive Results
Many city council candidates come from a political job. Politician or staff member is by the most frequent category in the California sample in Table 1. The incumbency advantage—well documented at the city council level (Trounstine 2011)—is on display in these data. 3 Some, like Paul Krekorian in Los Angeles, come to city council from the state legislature. Some work their way up through the ladder of city government, for example, Mitch O’Farrell first worked as a staff member for then-councilmember Eric Garcetti before running his own campaign.
California City Councils Occupational Category Frequency.
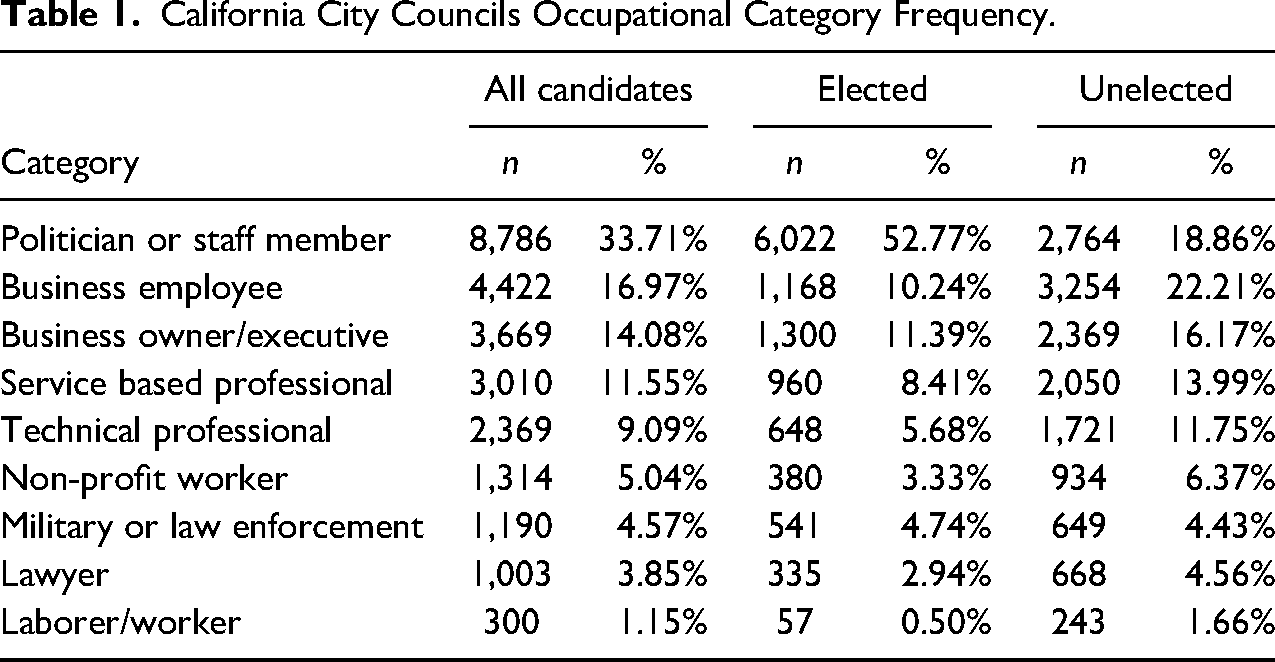
Many city councilmembers can be considered business employees and executives. The rate is over 21 percent in the elected sample. This is slightly lower than the 32 percent rate at which elected mayors are business executives in recent samples (Kirkland 2021). There are far fewer self-advertised lawyers on city council than in Congress. Over 30 percent of the 118th House are lawyers, and conditional on running lawyers are twice as likely to win a seat in Congress than people with other backgrounds making lawyer the most common prior occupation in Congress (Bonica 2020). However, the data in Table 1 suggest a different story at the city council level. More people on council come from service-based professions, like nursing or teaching, for example, than come from the legal profession.
These descriptive results are notable on their own because they show the breadth and diversity of pathways to city council. However, the question at hand is whether these categories appear at differential rates in cities depending on how Republican or Democratic those cities are. In the next section, I measure, for each city, the fraction of candidates and officeholders who fall into the nine career categories and plot those fractions against measures of city-level partisanship and ideology.
Candidate Occupation by City Ideology
Raw Data Visualization
Figure 1 shows the distribution of occupations on the y-axis and city-level Democratic voteshare from the 2020 presidential election along the x-axis. The figure demonstrates the trends of occupational categories across municipal partisanship. The graphs on the top row display three career categories that negatively correlate with Democratic partisanship and the graphs on the bottom row show three categories that positively correlate.
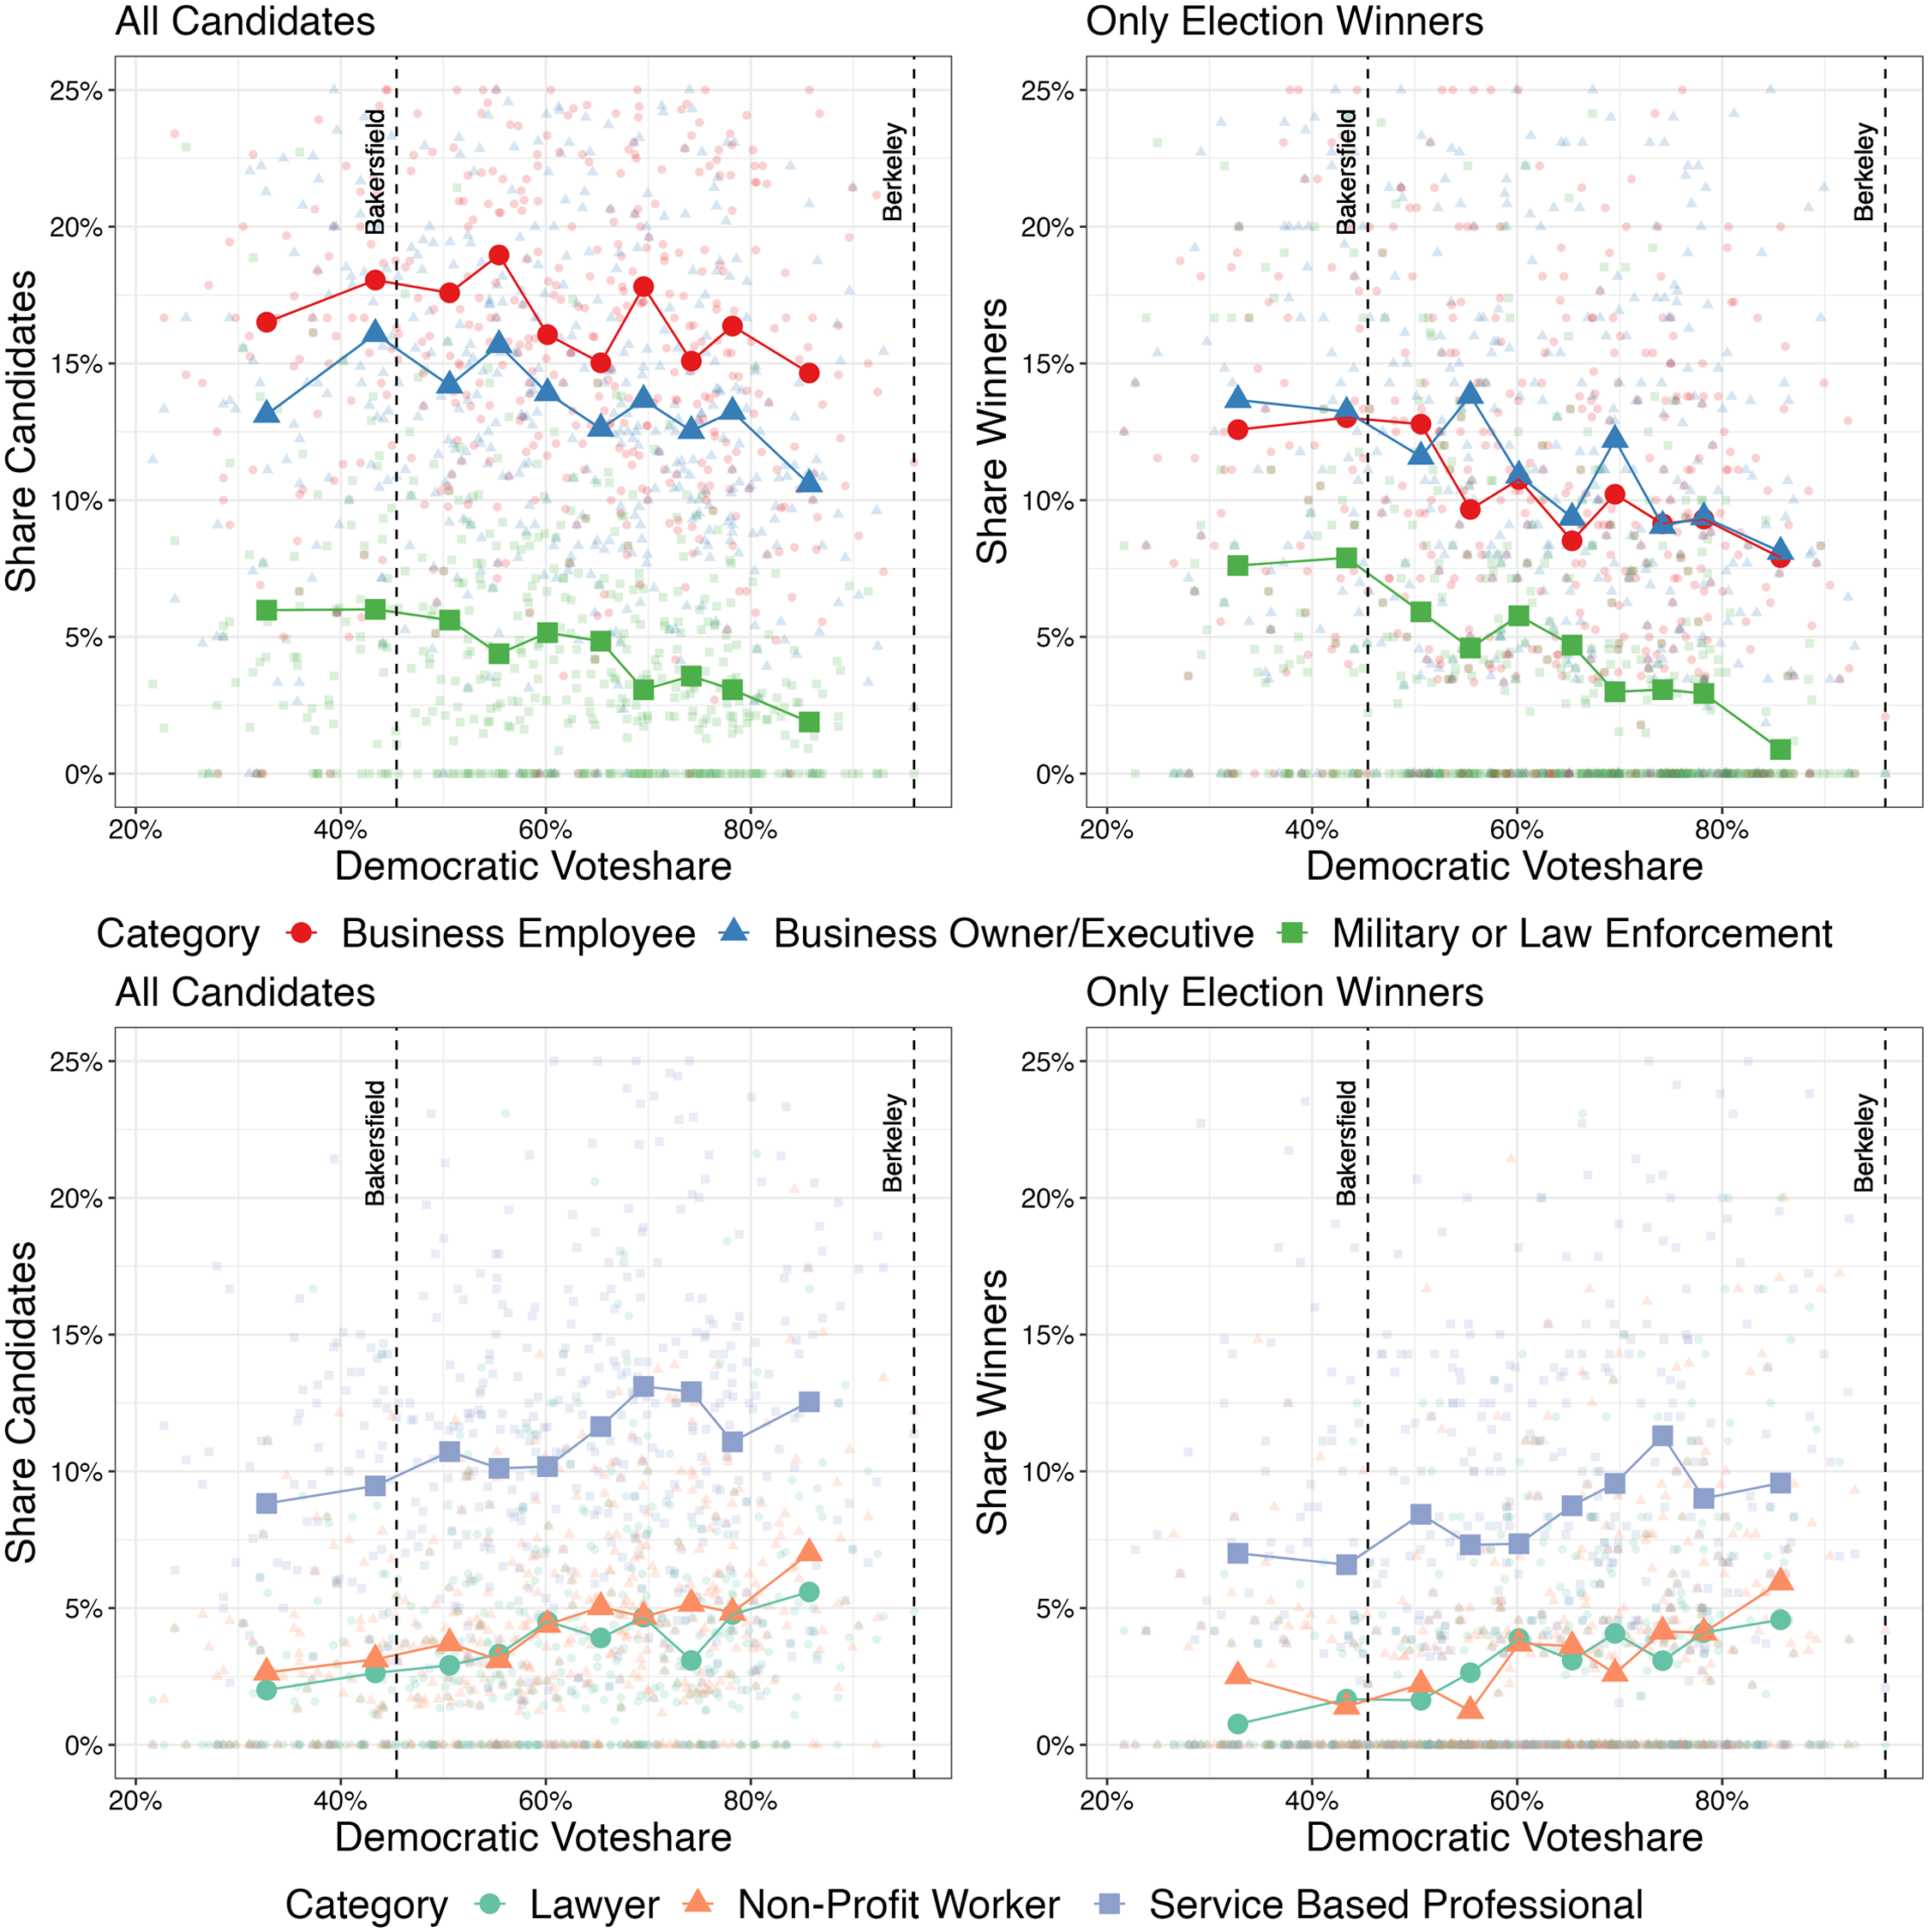
California cities’ distributions of occupations prior to running for city council. Graphs on the left (“All Candidates”) use city data from 26,821 candidacies between 1996 and 2021. Graphs on the right (“Only Election Winners”) filter down to only the 11,411 winners. Each large point is a voteshare-decile average of cities’ proportions of candidates or officeholders with a given career label. Three career categories appear in the top row of graphs (trending down with Democratic voteshare), and three categories below (trending up). For the three labels in neither set of figures, see the Supplemental Appendix.
To make things more concrete, consider the city of Berkeley. About 95 percent of the two-party vote in Berkeley went to Democrats in 2020. Between 1996 and 2021 there are 123 candidates from Berkeley in the data. Fourteen of them (11.4%) have a business employee ballot designation, three of them (2.4%) have a business owner background, and zero are from military/law enforcement. There are small transparent red, blue, and green points displaying those proportions in the upper left graph in Figure 1. Fourteen (11.4%) are service-based professionals, fifteen (12.2%) are non-profit workers, and six (4.9%) are lawyers—all on display in the bottom left graph in Figure 1. There are 477 cities of data on display, with each occupation category in each city displayed by a small translucent point. The larger, dark points are voteshare-decile averages for each occupation across the whole sample. The left side graphs (“All Candidates”) complete this exercise for all candidates and the right side graphs (“Only Election Winners”) use only the officeholders to calculate proportions of council belonging to each career category.
Figure 1 shows that certain career backgrounds show up more in California's more liberal cities and certain other career backgrounds show up more in California's more conservative cities. The next section models and formalizes this relationship to rule out some potential sources of confounding. To see the same trends using alternate measures of city-level ideology, see the Supplemental Appendix.
Modeling
The raw data suggest occupational trends that follow the partisan composition of the city. But one concern is that the trends reflect the composition of the city residents and availability of careers more than they reflect varied preferences or differential candidate entry between cities.
I use a multinomial logistic regression to model the share of each occupational category on the city's ideology and controls—including the citywide occupational distribution—to validate the patterns in the raw data. I measure city ideology using 2020 two-party Democratic voteshare. I include a host of city-level controls. For i indexing the 26,821 classified city council candidates, c indexing 477 cities, and t indexing year I estimate:
Figures 2 and 3 show results from using the model fit to predict the share of city council candidates in each occupational category across different city-level Democratic voteshares. On both plots, I display the predicted levels of candidates from politician or staff member and lawyer categories. For clarity I display predicted levels of Republican-favored occupational categories that decrease across the running variable in Figure 2 and, separately, Democratic-favored categories that increase in Figure 3.
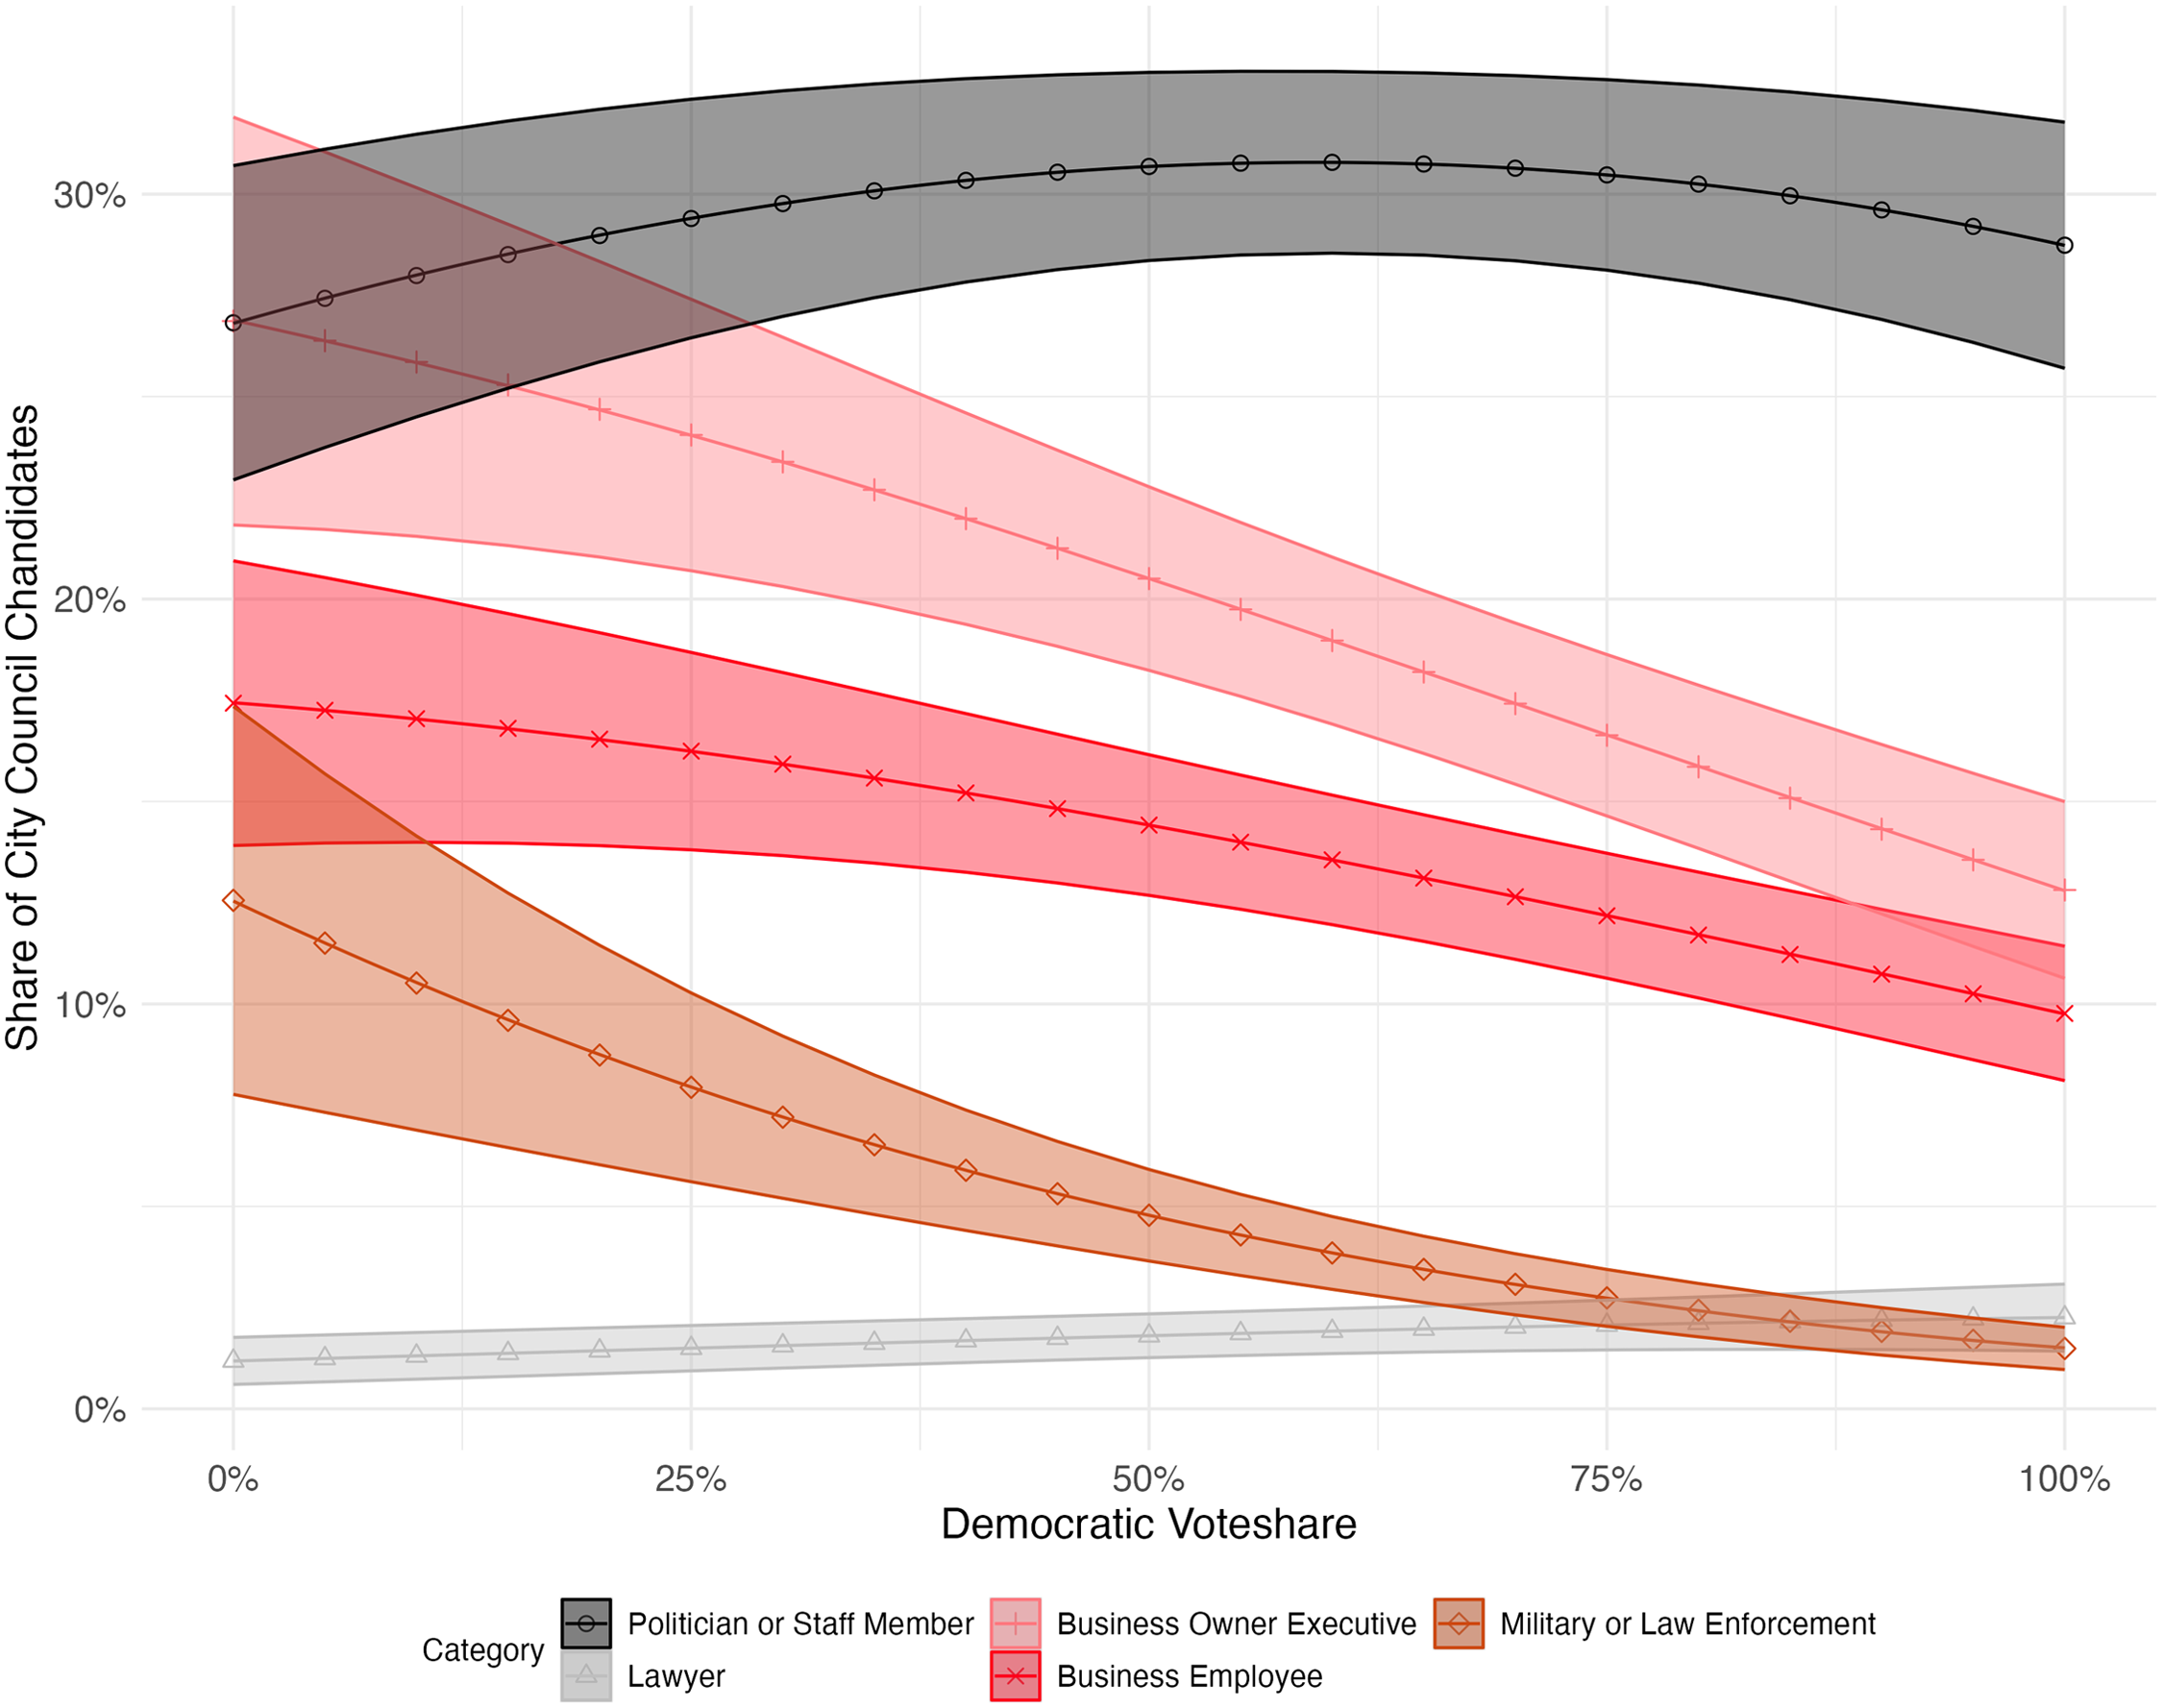
Predicted candidate shares for California cities (republican favored careers). All controls set to median, year set to 2020. Democratic voteshare takes its full theoretical range. Model fit on 26,821 candidacies from 477 cities in California. Shading indiciates a 95 percent confidence band. For plain tabular regression coefficients see the Supplemental Appendix.
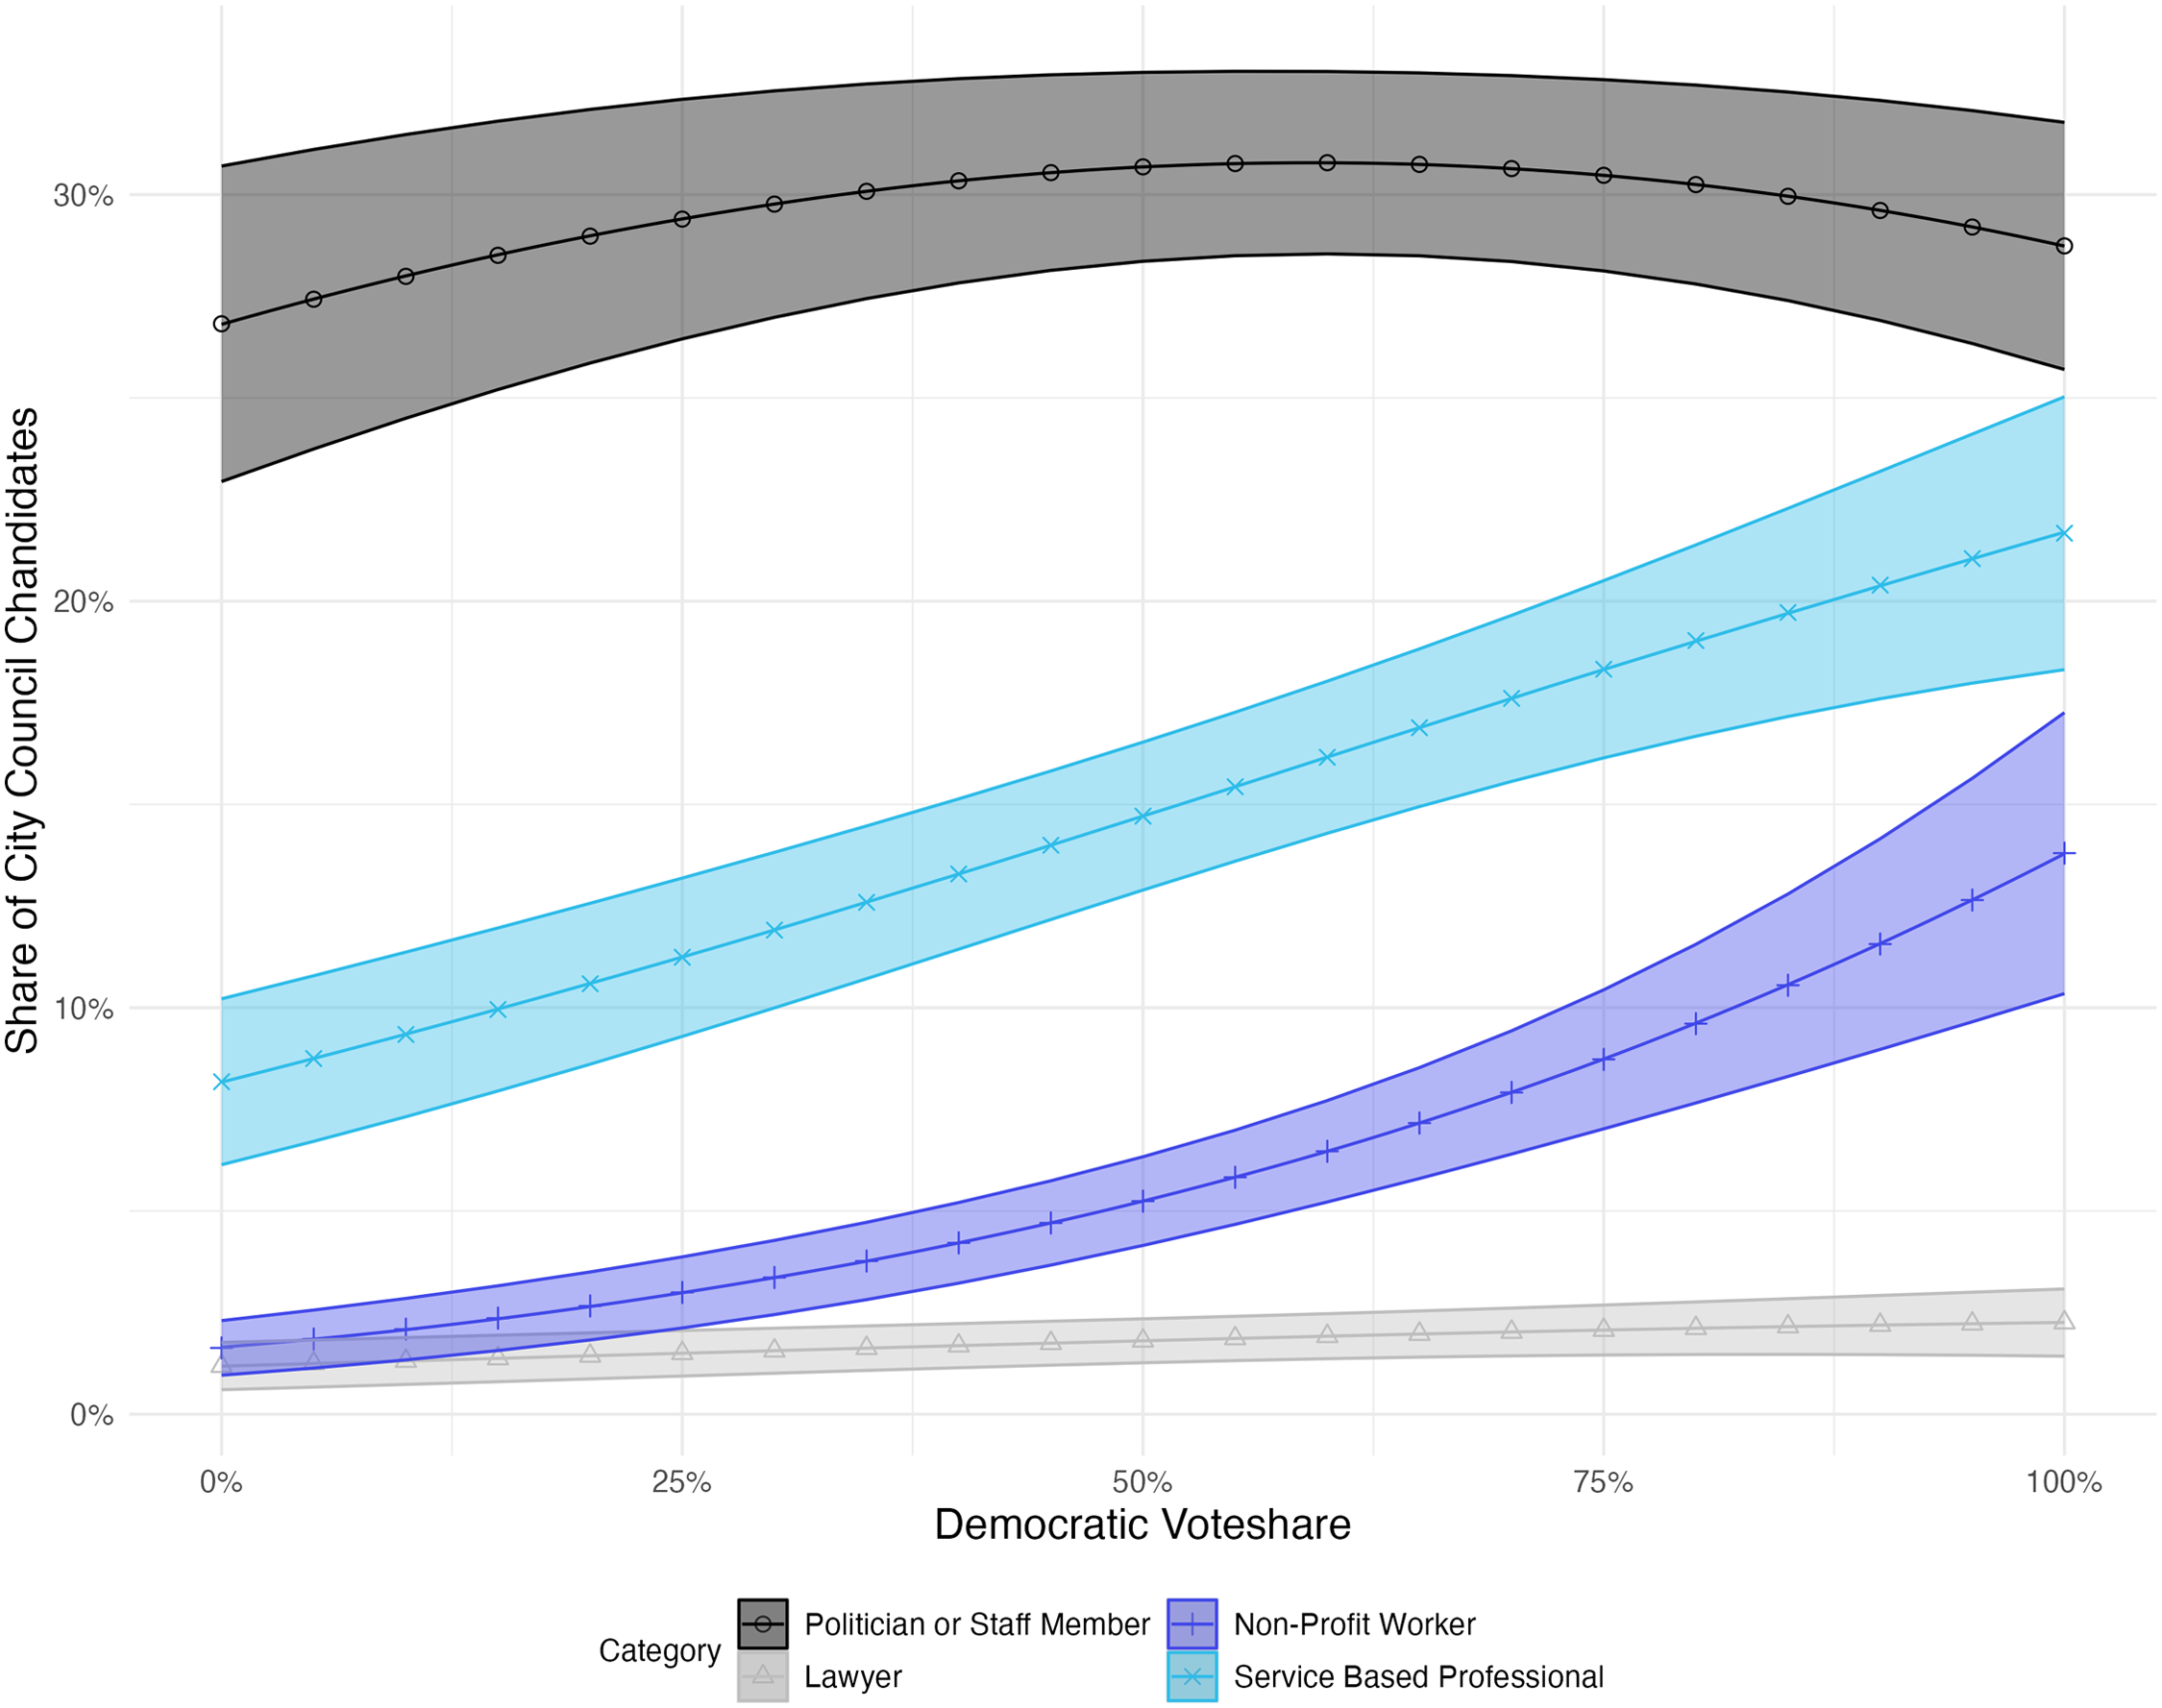
Predicted candidate shares for California cities (democratic favored careers). All controls set to median, year set to 2020. Democratic voteshare takes its full theoretical range. Model fit on 26,821 candidacies from 477 cities in California. Shading indicates a 95 percent confidence band. For plain tabular regression coefficients see the Supplemental Appendix.
The trends in the raw data in Figure 1 become more pronounced after adding in city-level controls. Business type candidates (owners and employees) and candidates coming from military and law enforcement are predicted to be relatively more abundant in California's more Republican cities. These three career labels show up less among candidates running in more Democratic cities. On the other hand, non-profit workers and service-based professionals appear on the ballot more frequently in California's more Democratic cities and less frequently in Republican cities.
This exercise shows that the ballot designated occupations do not show up in a way that is consistent with occupation-based descriptive representation. This aligns with research that shows poor descriptive representation in local politics along many dimensions (Ferreira and Gyourko 2014; Vogl 2014). These results suggest that knowing something about the ideological character of a place tells us something about the careers we’ll be more likely to see in the pipeline to city council.
Candidate Party Affiliation by Candidate Occupation
Even if in the aggregate the partisanship of a city has occupational patterns associated with it, a remaining question concerns the party affiliations of the candidates themselves. In this section, I ask whether knowing something about the occupational background of a candidate tells us something about their likely party affiliation. In the nonpartisan local election environment it is reasonable to think that voters will be looking to any available information to infer candidate party affiliation. Existing work using experimental and observational evidence shows that party identification is a major consideration across partisan and nonpartisan ballot formats (Bonneau and Cann 2015), and indeed, voters do make inferences based upon career experience when making their decisions (Atkeson and Hamel 2020; Kirkland and Coppock 2018). This section uses data to probe how accurate those inferences are.
I look up California city council candidates in the L2 voter file to determine the party they affiliate with. The information I have on candidates is their first and last name and the city in which they run for city council. I merge in partisanship based on looking up each candidate in the full list of city voters. If I find a unique match, the process is done. If I find multiple name matches for a candidate in the city, I impute partisanship only if all name matches share the same partisan identification. This allows me to observe partisanship for 14,369 candidacies, or 53.6 percent of the sample. 4 See the Supplemental Appendix for identical results that observe party affiliation by matching candidates to the local government elections database (de Benedictis-Kessner et al. 2023).
Table 2 shows data on the party-observed candidates: the percent of each occupational category that is Democratic, Republican, and Non-Partisan. Figure 4 presents the same information visually.
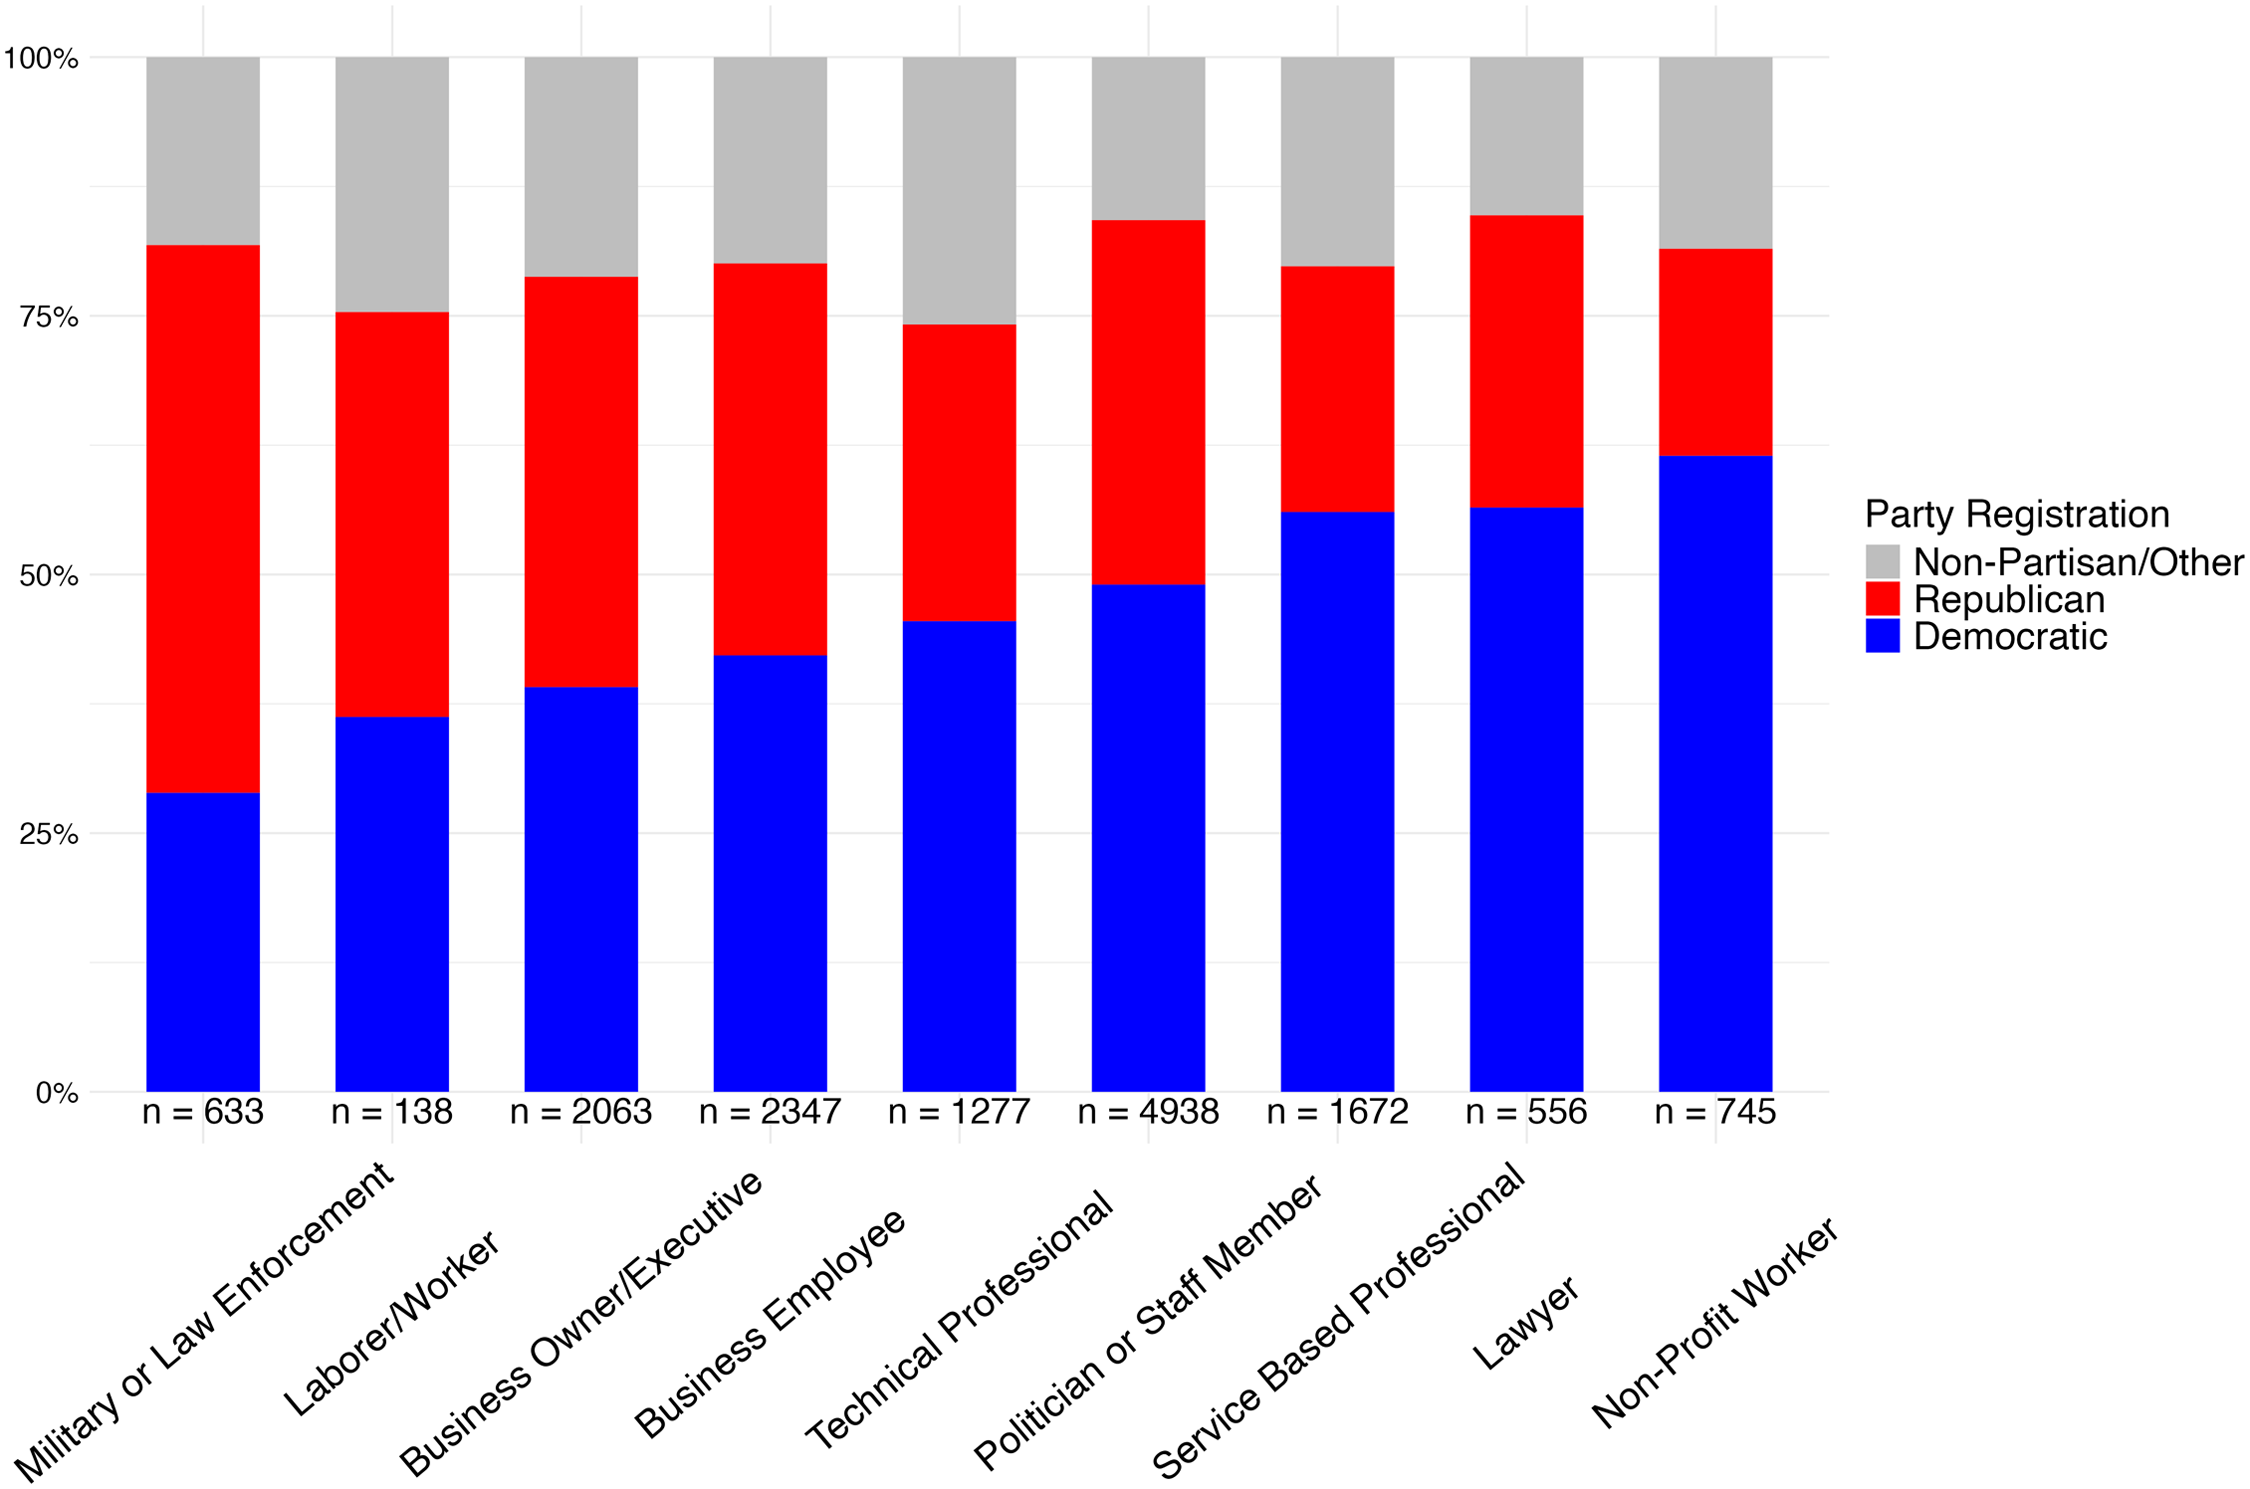
Voter file partisanship lookup. All candidates in California sample for which reliable party information was available in the L2 voter file.
Voter File Partisanship Lookup.
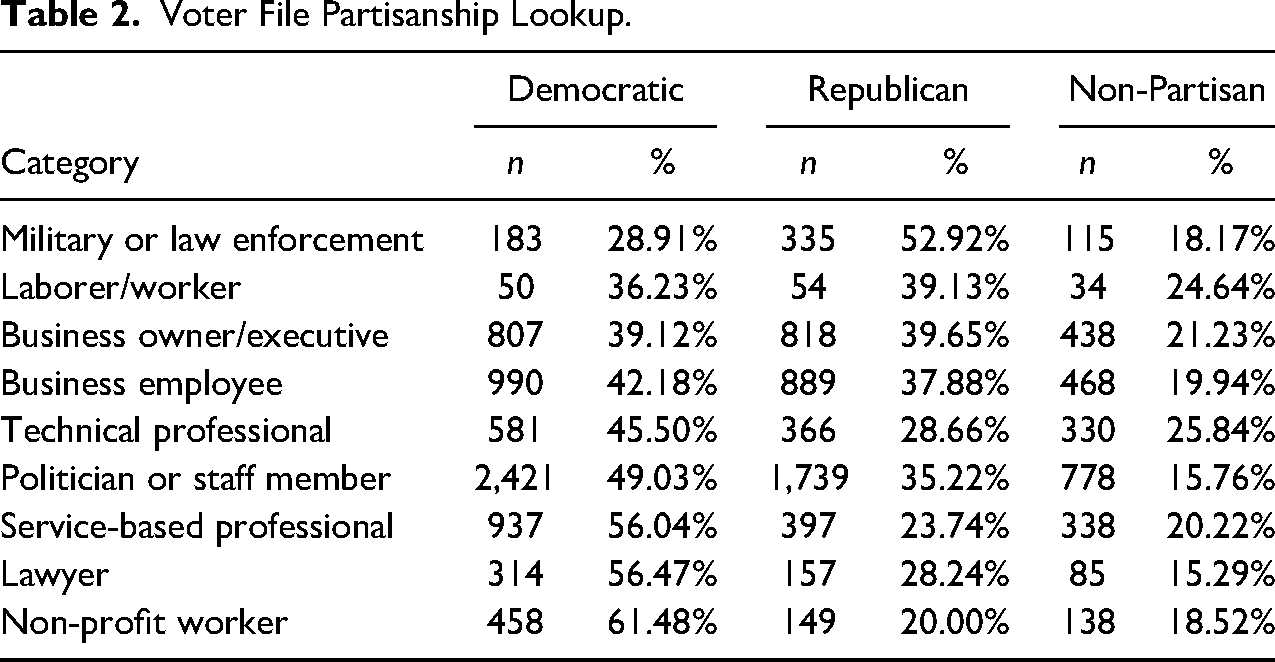
Conditional on knowing a candidate's occupation, voters can make a better guess about that candidate's partisan identity. The distributions of party affiliations within each career category are significantly different (χ2(16) = 447.49, p-value < 2.2 × 10⁻¹⁶). Military or law enforcement candidates tend to be more Republican and non-profit candidates tend to be more Democratic. When a business candidate appears on the ballot, voters do not suddenly become certain of their partisanship. However, compared to the distribution of party across say, service-based professionals, voters can guess Republican for the business candidate with more confidence.
In sum, knowing a candidate's occupation offers California voters some signal about the candidate's party identification. Voters use this fact (Adams, Lascher, and Martin 2021; Atkeson and Hamel 2020; Kirkland and Coppock 2018). Sourcing state voter records for candidate partisanship in nonpartisan California races allows for the powerful observation of both national partisan affiliation and occupational history. These two features of candidates are meaningfully correlated.
Validation: Large Cities (National Sample)
The results thus far have shown that in a longitudinal sample of California cities and candidates, city ideological character is predictive of aggregate occupational classes, and individual occupational classes are predictive of candidate party affiliation. In order to validate results on a national sample, I gathered data on 97 large cities that maintain websites for their councils. 5 For each member of the city council serving in 2022, I gathered their most prominent occupation prior to serving on city council. So if in their biography they mention graduating college, becoming a teacher, and then going on to finish law school and work in private practice, I categorize their pre-council career as lawyer. 6 The cross-sectional sample of large cities with occupation coded from web biographies is an effort to generalize the principal findings which come from the longitudinal sample of 477 California cities using ballot designations.
The model for the national cross-sectional data is a similar multinomial logistic regression model. In this model I can only look at city councilmembers elected to office (as opposed to the full set of candidates above) and only in one year, 2022. For i indexing the 877 classified city council officeholders and c indexing 97 cities I estimate:
There is more uncertainty because the sample size is less than 3 percent as large as the California sample and only includes officeholders, yet even in a limited, cross-sectional sample of currently serving city councilmembers a similar pattern emerges. Predicted shares for four key categories are displayed in Figure 5. Liberal cities have more people on council who come from some other political position and the non-profit sector whereas conservative cities have more business owners, executives, and military and law enforcement personnel serving on council. The results of the national modeling exercise align nicely with existing work from Kirkland and Coppock (2018), which finds in a conjoint experiment, “Republicans respond to the removal of partisan information by giving greater weight to job experience while Democrats respond by giving greater weight to political experience.” The national exercise relies on one year of data from fewer than 1,000 city councilmembers and so it is not as strong as the California evidence. However, it is suggestive that the patterns and trends shown in the main results of the paper are not unique to California.
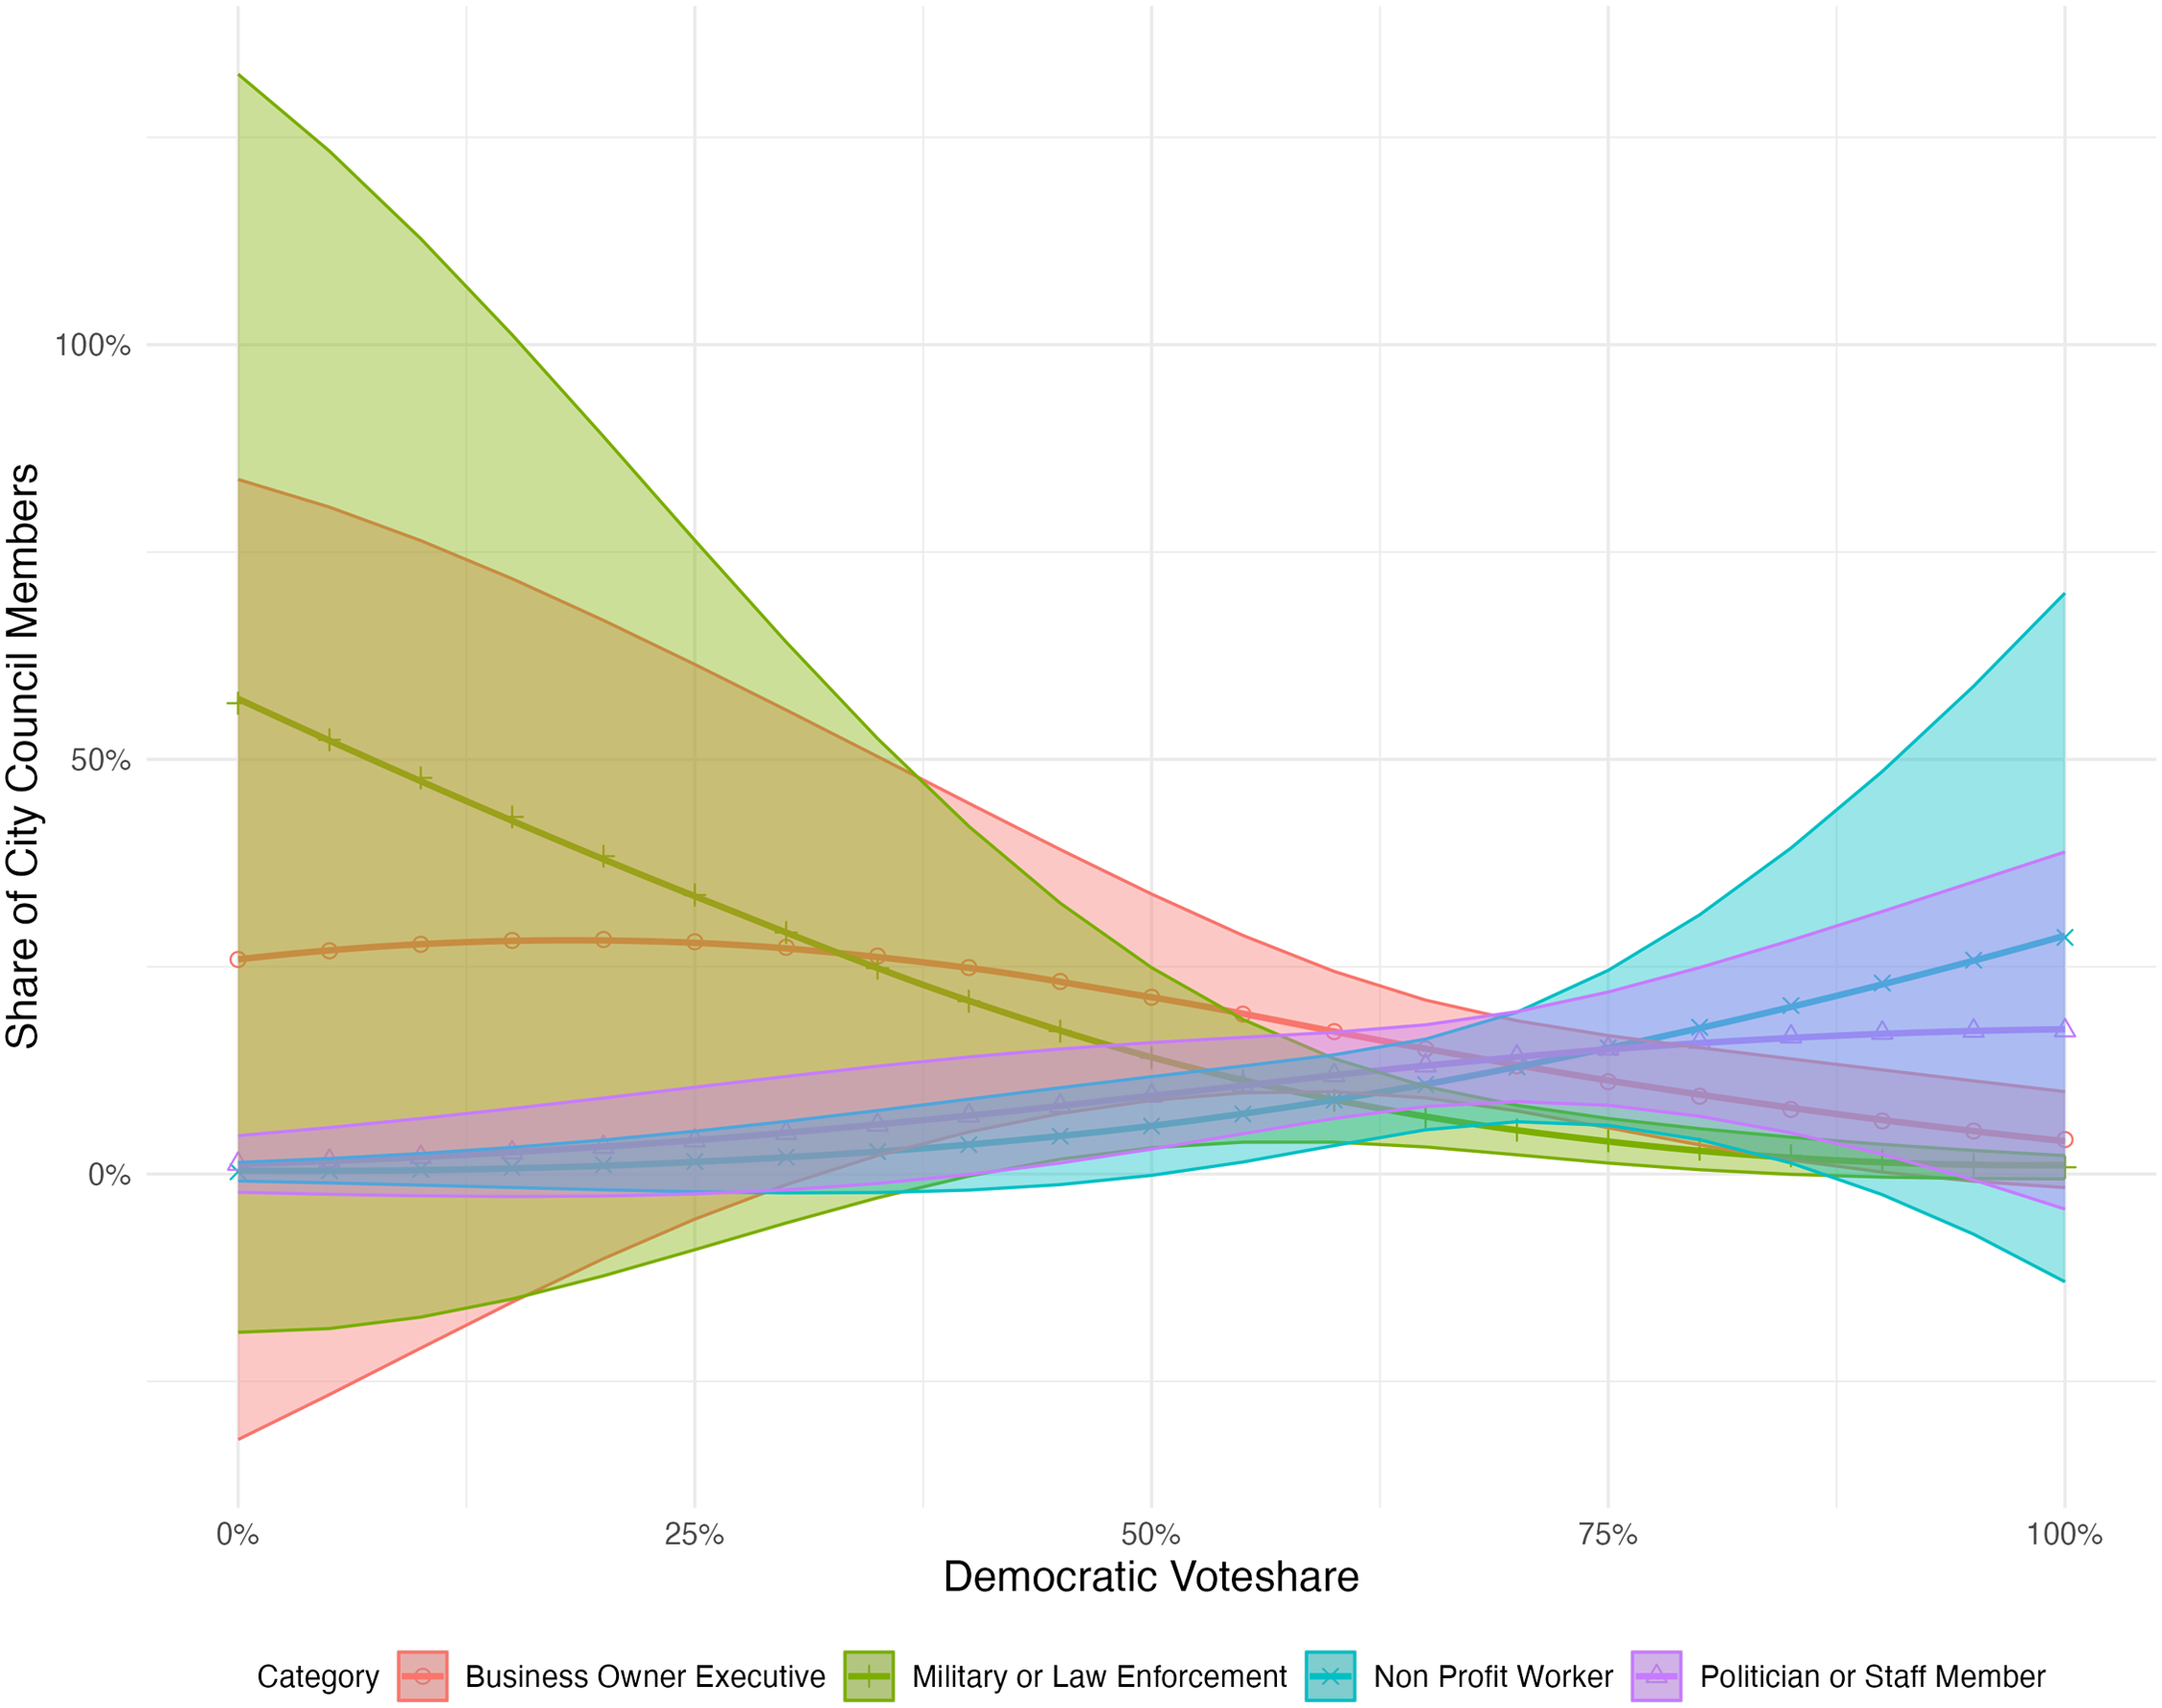
Predicted candidate shares for national sample. All controls set to median. Democratic voteshare takes its full theoretical range. Model fit on 877 candidates from 97 cities in the United States. Shading indicates a 95 percent confidence band.
Discussion
In an era of increasing amateurism in politics (Porter and Treul 2025), when voters reference other candidate qualities to evaluate competence (Atkeson and Hamel 2020; Kirkland and Coppock 2018), understanding the interactions between a group or identity like occupation and candidate party affiliation is crucial. Existing theory disagrees on the relative importance of national party labels and local group membership in explaining municipal representation and policy patterns.
This piece has shown how party and one particular group—occupation—are tightly coupled in a recent sample of thousands of city council candidates and officeholders across California. First, cities that differ ideologically attract different kinds of candidates to run on average: more liberal cities have more service-based professionals like teachers and nurses and non-profit workers running for and winning office. More conservative cities have more military and law enforcement workers and business types running for and winning office. And at the individual candidate level, career labels from ballot designations signal party affiliation.
Designs that use regression discontinuity to show how party affects local politics (de Benedictis-Kessner and Warshaw 2016; de Benedictis-Kessner, Jones, and Warshaw 2025) assume that other observed and unobserved candidate characteristics are smooth at the cutpoint; in other words, that when a Republican wins by a razor thin margin, she only differs from the Democrat who loses by a razor thin margin by party. The same is true in the opposite direction for regression discontinuity work using occupation (Kirkland 2021). Some covariates are easier to test for smoothness around the discontinuity because of data availability, like race and gender, but many are more difficult to measure and go uncontrolled for despite their impact: union membership, occupational history, prior elected experience, family status, homeowner status, and many more aspects of community that are hard to translate to data.
The documented association between occupation and party adds context to many existing findings in local political economy. Voters see candidate occupation through a partisan lens (Adams, Lascher, and Martin 2021), they weigh occupation in nonpartisan elections (Kirkland and Coppock 2018), and they punish and reward candidates based on endorsements from professional associations. For instance, police union endorsements, once an electoral boost across the board, have polarized voters in recent local elections. The police union endorsement now helps conservative candidates and hurts liberal candidates (Gaudette 2024). Future work should expand to a national analysis and examine whether places have a different idea of what a “pre-political” career is. Do the California associations in this piece hold in other states? How do occupational trends vary between nonpartisan and partisan election formats? How much strategic self-representation do local candidates engage in? Is it true that in liberal places non-profit jobs are considered political pipelines and imbued with a certain prestige whereas in conservative places military and law enforcement jobs are considered political pipelines and have elevated status? How do the jobs we have change our ideological views? Researchers ought to use more specific occupational categories to better understand how the economic backgrounds and more detailed life experiences of politicians guide their work in office.
The strong correlation between party and occupation suggests that neither theories of local politics as driven by groups and identity nor theories of strong nationalized partisanship can rule out the other. Instead, the research designs used to study local politics need to capture the rich breadth of affiliations that candidates bring to the table.
Supplemental Material
sj-docx-1-uar-10.1177_10780874251315148 - Supplemental material for The Economic Background of City Councilmembers
Supplemental material, sj-docx-1-uar-10.1177_10780874251315148 for The Economic Background of City Councilmembers by Graham Straus in Urban Affairs Review
Footnotes
Declaration of Conflicting Interests
The author(s) declared no potential conflicts of interest with respect to the research, authorship, and/or publication of this article.
Funding
The author(s) received no financial support for the research, authorship, and/or publication of this article.
Supplemental Material
Supplemental material for this article is available online.
Notes
Author Biography
References
Supplementary Material
Please find the following supplemental material available below.
For Open Access articles published under a Creative Commons License, all supplemental material carries the same license as the article it is associated with.
For non-Open Access articles published, all supplemental material carries a non-exclusive license, and permission requests for re-use of supplemental material or any part of supplemental material shall be sent directly to the copyright owner as specified in the copyright notice associated with the article.