
Abstract
This article analyzes shifts in the delivery mode of waste collection in Dutch municipalities between 1999 and 2014. In approximately half of these entities, shifts took place, with 60% toward outside production and 40% toward inside production. In recent years, the number of shifts dropped remarkably, and re-municipalization has become more important. In addition, the amount of municipalities with reverse privatization is larger than that of privatization. Based on a logit model, some evidence of an ideological motivation for changing the mode of production is found. Conservative liberals are in favor of changing, particularly toward the market and privatization, whereas social democrats, in particular, are against change. These results provide some evidence for the unemployment or scale argument for changing the mode as well. In addition, there is an indication that political fragmentation increases the ability to privatize.
Introduction
Outsourcing of municipal services has been heralded as a reform to promote efficiency and responsiveness in local government service delivery (Osborne and Gaebler 1992). In the United States and Europe, contracting out is a longstanding practice; in fact, many municipal services (especially social services) began with private delivery of such services and shifted to public provision during the twentieth century. Especially in Europe, with a large government and welfare state, some argue that renaming such contracting out or privatization was part of a broader agenda to shrink government. For local officials, however, the approach to privatization has been a rather pragmatic one, as shown by political economy papers, which have empirically studied the factors that induce or deter privatization of local services (see, for example, Warner and Hebdon 2001, for the United States; Bel and Miralles 2003, for Spain; Dijkgraaf, Gradus, and Melenberg 2003, for the Netherlands; Ohlsson 2003, for Sweden; Tavares and Camöes 2007, for Portugal). A more general finding of this political economy literature is that there do not seem to be many ideological arguments influencing politicians’ decisions, so that the privatization decision of the municipality is pragmatic and not ideological. Based on a meta-regression, Bel and Fageda (2009) points out that there is a lack of a systematic relation between local privatization and ideology. Recently, Bel and Fageda (2017) reviewed all empirical studies explaining privatization published in the last 10 years and found that most of them have no or only a weak influence of ideology. However, Hebdon and Jalette (2008) for Canada found that elected politicians reduce privatization rates and, therefore, have hesitation with a solid restructuring agenda. In addition, a recent study using Dutch local government data (Schoute, Budding, and Gradus 2017) showed that in this context, ideology plays a significant role in choices of service delivery modes, so the debate is still open.
Analysis of U.S. shifts over time shows not only that privatization and contracting out are important phenomena but also that reverse privatization and contracting in exist and become more important. Based on the five-yearly International County Management Association (IMCA) survey of U.S. local delivery of 67 services, Hefetz and Warner (2004) found that 18% of services in 1997 were new contracts, and 11% had been contracted back in since 1992. However, in the period 1997–2002, these proportions flipped and “reverse contracting,” or bringing contracted work back in-house, was preferred (see Hefetz and Warner 2007). In two more recent investigations, Warner and Hefetz (2012) and Warner (2016) showed that for the periods 2002–2007 and 2007–2012, respectively, reverse contracting and new contracting out were almost evenly matched. Girth et al. (2012) show that, nowadays, U.S. local governments tailored contractor choice to market and service needs, relying on private contractors when markets are more competitive and on intergovernmental contracting when markets are weaker.
In Europe, since the 1980s, also due to fiscal pressure, municipal provision of public services has been privatized, but in the last decade, there is an increasing evidence of trends in the opposite direction. Hall, Lobina, and Terhorst (2013) claim that at the beginning of this century, there was extensive re-municipalization in the water sector in France and the energy sector in Germany, which can be analyzed as a “pendulum” reflecting political struggles. In addition, in the United Kingdom, Finland, and recently the Netherlands, government’s cleaning contracts were brought in-house. However, this evidence is anecdotal and the authors point out that empirical studies of re-municipalization across different sectors can be helpful to advance the practical knowledge of policymakers. For Dutch waste collection, there was some evidence that contracting out or privatizing this service leads to lower costs (Dijkgraaf and Gradus 2008), although a later study showed that also cooperation between municipalities can be an efficient delivery mode (Dijkgraaf and Gradus 2013). In Gradus, Dijkgraaf, and Wassenaar (2014), a study was undertaken based on a panel data set on organizational changes in waste collection for (almost) all Dutch municipalities between 1999 and 2010. The study showed that in approximately half of Dutch municipalities, shifts took place, with two-thirds being toward outside production and one-third toward inside production. Moreover, privatization and reverse privatization (P-R) of waste collection almost equally matched in 1999–2010. However, the fiscal crisis has asked some cuts in public spending again, so it is important to investigate re-municipalization in recent years as well.
Therefore, in this article, Gradus, Dijkgraaf, and Wassenaar (2014) is extended in six directions. First, shifts for the period 2011–2014 were added. In this period, Dutch municipalities were confronted with the consequences of the (global) fiscal and European crisis. Interestingly, in this period reverse municipalization became more important, and it is investigated whether this is politically motivated. Second, other political variables are included. Instead of the election results of parties, the number of seats won are incorporated. Due to the system of proportional representation in the Netherlands, the difference will be slight except for small municipalities. 1 Moreover, as on a daily basis, aldermen form the executive board of a municipality, 2 the share of aldermen from each political party as an explanatory variable is also included. In a sense, the approach of Elinder and Jordahl (2013) is followed, and there is a distinction between general political preferences as expressed by the voters (represented by the number of seats of each political party on the municipal council) and those of the ruling parties (shown in our analysis by the aldermen). Third, based on these political data, we also test whether political fragmentation plays a role in outsourcing decisions. Warner and Hefetz (2002) and Hefetz, Warner, and Vigado-Gadot (2012) showed that in political fragmented metropolitan areas, it is more difficult to cooperate. Opposite to this, Hefetz, Warner, and Vigado-Gadot (2012) found that in political fragmented metropolitan areas, it is easier to privatize, although their results were only significant for 2002. Fourth, similar to some European countries, the Netherlands face a trend toward corporatization or municipality-owned firms (for recent overviews, see Tavares 2017; Voorn, van Genugten, and van Thiel 2017), and therefore, the reasons for such a change are investigated. Fifth, the issue of the creation of entities outside the government is included, and the reasons for such a change are investigated. For Spain, there are indications that especially left-wing governments make use of these entities to avoid the debt limits imposed on municipal administration in the aftermath of the financial crisis (see Cuadrado-Ballesteros, García-Sánchez, and Padro-Loronzo 2013). They show that these shifts are partly motivated by this argument and that left-wing local governments are more eager to increase functional decentralization linked to political pressure. Sixth, information on municipal debt levels is added, and by doing so, the hypothesis that municipalities with high debt levels will outsource more is tested.
The article is structured as follows. First, in the section “Shifts in Waste Collection Management,” we describe the shifts over time. This is followed by the “Model and the Data.” A logit analysis explaining the shifts is presented in the section “Results.” Some concluding remarks and topics for future research are offered in the section “Conclusion and Discussion.”
Shifts in Waste Collection Management
Dutch municipalities have a legal obligation to provide a waste-collection infrastructure for household waste. Municipalities may charge their citizens a waste collection tariff up to a maximum of 100% of the costs. On average, 96% of the costs are charged under this user fee. 3 The rest of the costs are funded by other income (taxes and central government grants). The municipal council, which is elected every four years by the inhabitants, and aldermen are responsible for the execution of this policy, including the determination of the tariffs and taxes. The municipal council is also the decision-making body with regard to the mode of waste service delivery. Of all observations in our 1999–2014 data set, 35% represent waste collection contracted out to a private firm and 24% to a municipal enterprise. It should be noted that municipal enterprises operate under commercial law, while their shares are owned by municipalities. Precisely, these municipal enterprises are legally and managerially autonomous from government (McDonald 2016a, 2016b). In the Dutch case, a municipal enterprise has both an independent executive and supervisory board, but both are appointed by the shareholders, which are local government representatives. Furthermore, important (investment) decisions will only be taken after consulting the shareholders. However, the executive board has decision-making authority in personnel management decisions and, therefore, can have lower labor costs than a bureaucracy. A third group of observations (15%) represents collection in cooperation with neighboring municipalities—labeled “cooperation” in the figures and tables that follow; they are organized as public WGR (Wet Gemeenschappelijke Regelingen, i.e. Law on Common Arrangements) entities, where the executive board is directed by the aldermen of participating municipalities (see Bel, Fageda, and Warner 2010). A fourth, small group of observations (3%) consists of municipalities that decided to let the task be executed by a neighboring municipality—labeled “neighbor” in the figures and tables. 4 The remaining observations (23%) represent in-house collection by municipalities themselves. In the last three cases, the services are run publicly and, thus, not under commercial law. The market shares of these five modes of Dutch waste collection between 1999 and 2014 are illustrated in Figure 1.
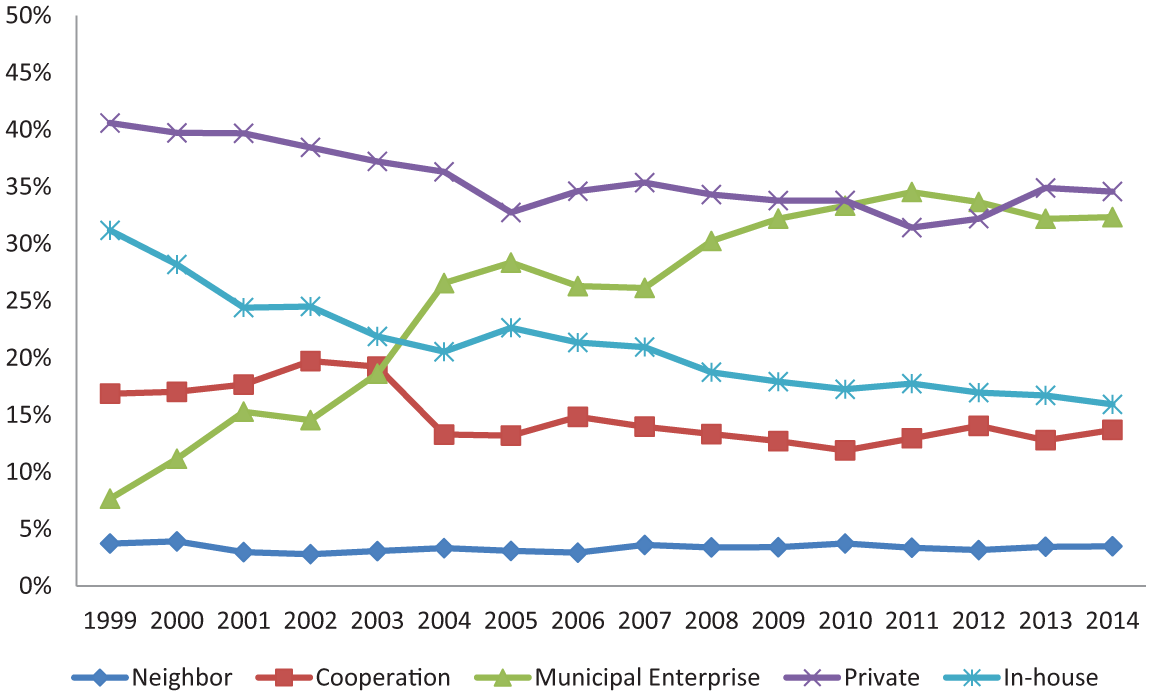
Market shares, 1999–2014, weighted by the number of municipalities.
Remarkably, the market share of municipal enterprises increased substantially from 5% in 1999 to around 33% in 2010–2014 (see Figure 1). The share of municipalities collecting in-house decreased from 31% in 1999 to 16% in 2014. In 1999, 41% of municipalities used private firms, while this percentage was 31% to 35% in 2011–2014; this decrease was at least partly the result of the merging of small municipalities, as private collectors were especially active in these environments. 5 Municipal cooperation in a WGR decreased slightly from 17% in 1999 to 12% to 14% in 2010–2014. Finally, collection by a neighboring municipality is uncommon, less than 5% in all years. So, the percentage of municipalities operating under commercial law increased in the Netherlands from 48% to 67% over the period.
Figure 2 shows the market shares weighted by the number of inhabitants for 1999–2014. The shares are much smaller for private contractors and much larger for in-house collection than the shares in Figure 1. This implies that in-house collection is found more in large cities and that private collectors are used more in small municipalities. Municipal enterprises are more active in large cities as well, and municipal cooperation is more usual in small municipalities, but the differences are less pronounced.
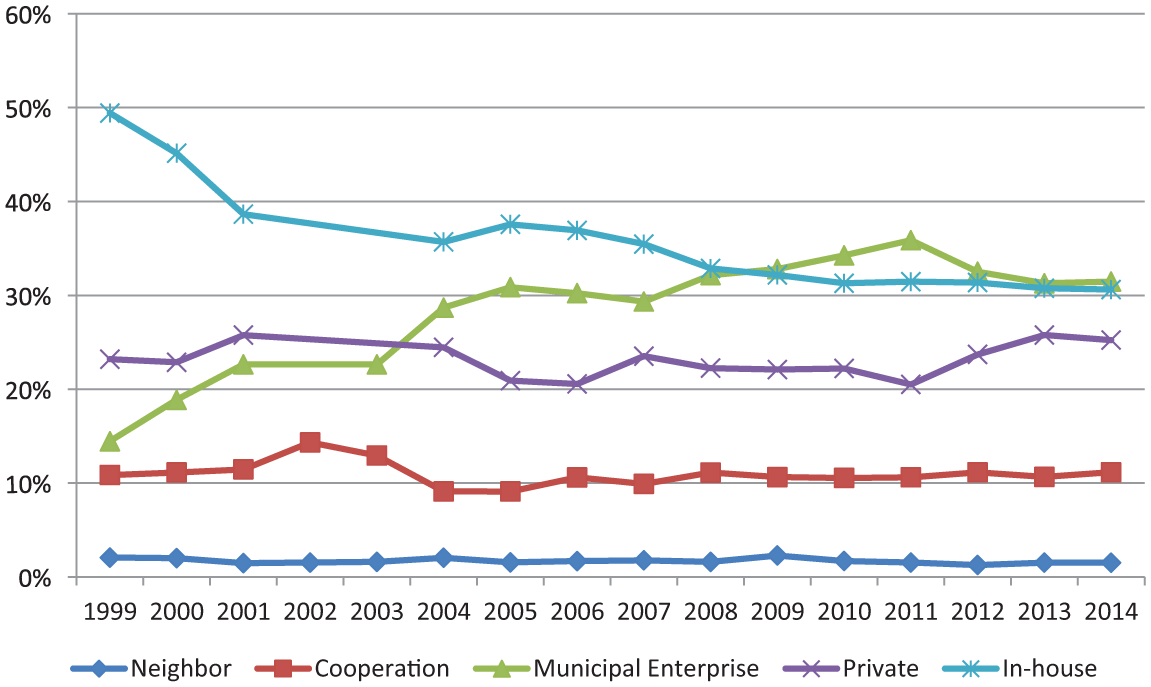
Market share, 1999–2014, weighted by the number of inhabitants.
Shifts
Our large longitudinal data set makes it possible to measure shifts over time. Similar to Gradus, Dijkgraaf, and Wassenaar (2014), a transition matrix is constructed, as shown in Table 1, where the mode of production is ordered from left to right toward outside production (see Hefetz and Warner 2004). This matrix includes all shifts, even if a municipality shifts several times in the period 1999–2014. 6 This method enables us to compare stability in forms of service delivery and to assess shifts toward outside production or toward inside production.
Number of Municipalities Switching Mode and Staying the Same, 1999–2014.
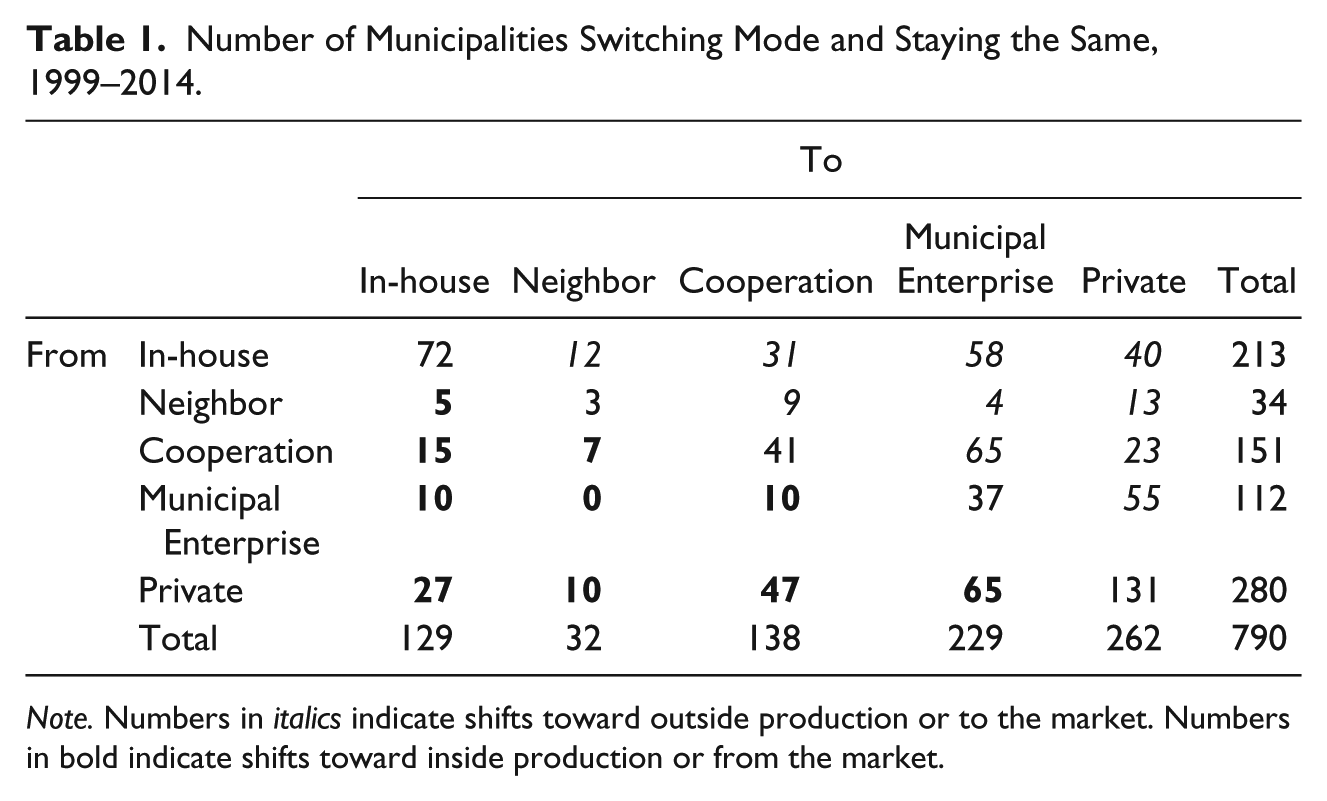
Note. Numbers in italics indicate shifts toward outside production or to the market. Numbers in bold indicate shifts toward inside production or from the market.
Data from 1999 to 2014 are available for 555 Dutch municipalities. 7 Some 271 Dutch municipalities (i.e., 49%) shifted to a different mode of production one or more times. In most of these municipalities (145), there was one shift; in 59 municipalities, two shifts took place; in 42 municipalities, there were three shifts; in 14 municipalities, there were four shifts; in seven municipalities, there were five shifts; in two municipalities there were six; and finally in two municipalities, there were seven shifts. In total, there were 506 switches, of which 310 (italics in the table) were toward outside production or to the market, and 196 (bold in the table) were toward inside production or from the market (see Table 1). Thus, 61% of shifts were toward outside production, and 39% toward inside production. Moreover, corporatization was important as 192 such shifts took place. In addition, in 284 municipalities, the mode of production did not change during the period 1999–2014 (this is the sum of the numbers on the diagonal). So the mode of production was stable over this period in approximately half of the Dutch municipalities.
Let us focus in more detail on both P-R (see the first four items in the fifth column and in the fifth row of Table 1). 8 There were 131 shifts to privatization, but there were also 149 shifts away from privatization (i.e., reverse privatization). Remarkably, reverse privatization is more common than privatization. In Gradus, Dijkgraaf, and Wassenaar (2014), P-R are found almost equally, but in recent years, reverse privatization has become more important (see Table 2). For nearly half of the municipalities (45%), it was a shift from a private to a municipal enterprise, and therefore, reverse privatization in such a case means that the shares are now owned by municipalities.
Number of Municipalities Switching Mode and Staying the Same, 1999–2010.
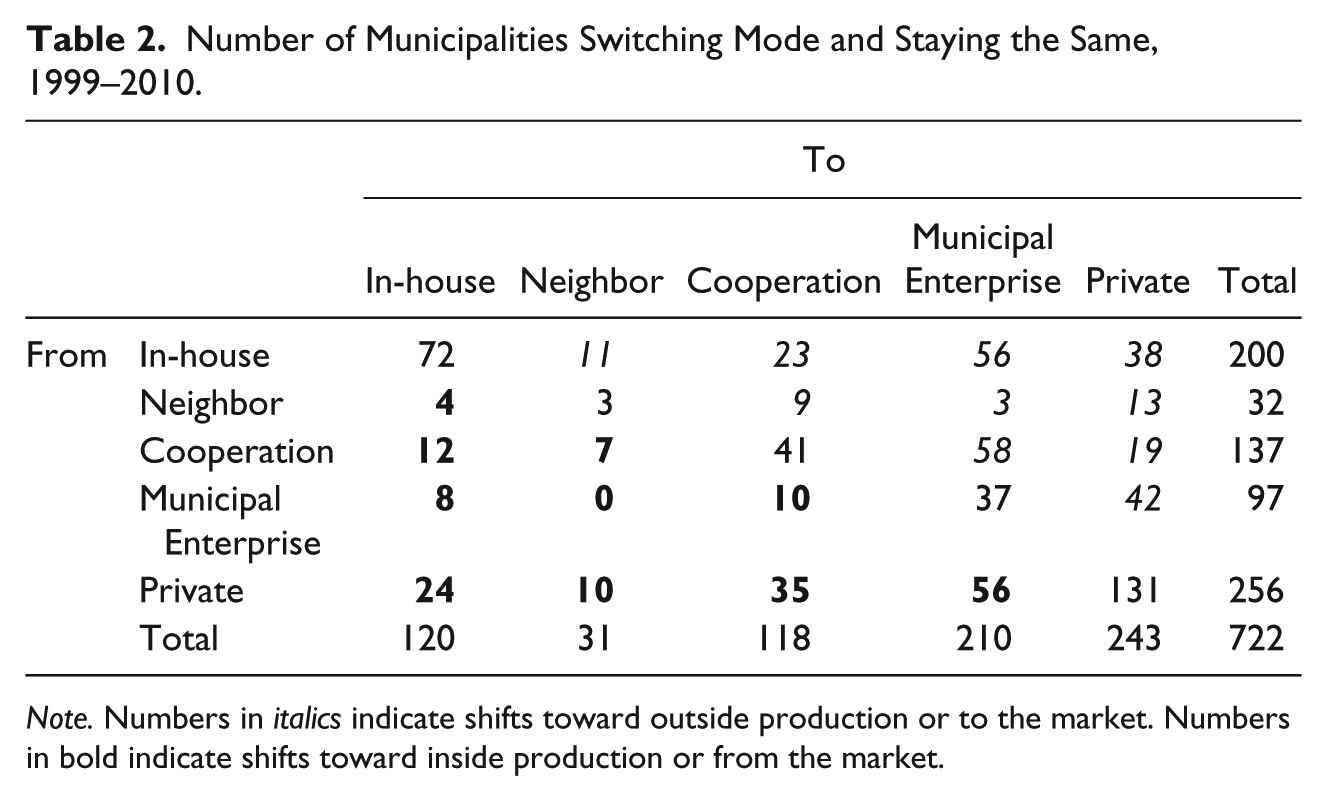
Note. Numbers in italics indicate shifts toward outside production or to the market. Numbers in bold indicate shifts toward inside production or from the market.
Pattern Over Time
Let us distinguish between the differences in shifts in the periods 1999–2010 and 2010–2014. The first time period is chosen to make it comparable with Gradus, Dijkgraaf, and Wassenaar (2014) as the data are added for the last period.
It should be noticed that the number of shifts in 2010–2014 is only 68 (see Table 3), which is small, compared with 438 in 1999–2010. So in that earlier period, the number of shifts is approximately six times larger than the later period, while the time is less than three times longer. This is a remarkable finding as one would expect that in the years in which municipalities were confronted with the effects of the global fiscal crisis, they would search more actively for the mode of delivery expected to be most efficient (e.g., Zafra-Gómez et al. 2014). 9 However, for U.S. municipalities, there is an indication that municipalities practice and maintain their public role (Kim and Warner 2016). Also, the pattern differs slightly between the two periods. In Figure 3, in every year, the balance between outside and inside shifts (O-I), privatization and reverse privatization (P-R), and corporatization and reverse corporatization (C-RC) is plotted. Hereby, O-I is calculated as the number of municipalities with a shift toward outside production minus the number with a shift toward inside. In addition, P-R is calculated as the number of municipalities that privatize minus the number that re-privatize, and C-RC as the number that corporatize minus the number that re-corporatize. The balance toward outside production with more than 20 shifts is located particularly at the beginning of the century; in 2011–2014, the balance moves toward inside production or re-municipalization, although outside production remains important in some years (e.g., 2013). Also the balance of (reverse) corporatization at the beginning of this century was large, and a remarkable drop in corporatization did take place after 2011. For P-R, in most years, reverse privatization is more important than privatization. 10 In addition, privatization has become less in this period (in 2014 even zero).
Number of Municipalities Switching Mode and Staying the Same, 2011–2014.
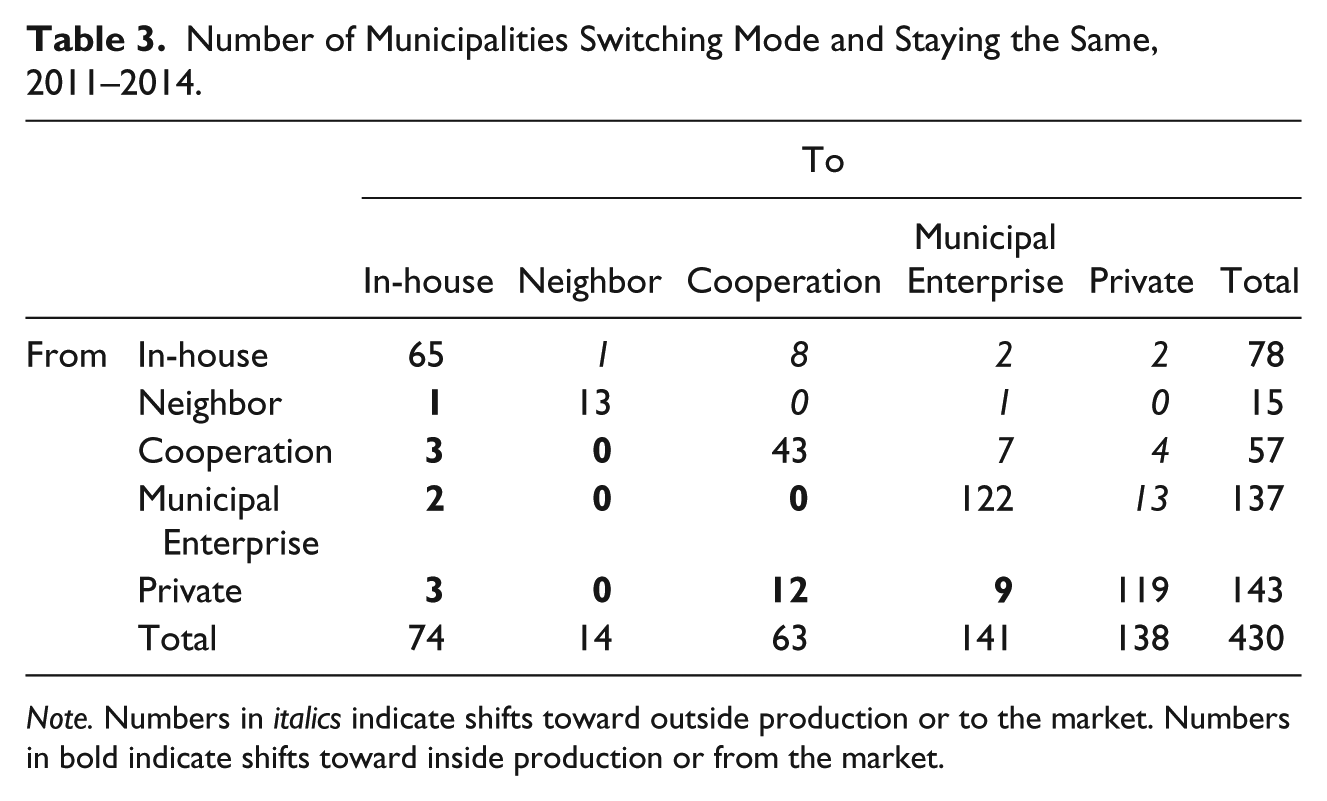
Note. Numbers in italics indicate shifts toward outside production or to the market. Numbers in bold indicate shifts toward inside production or from the market.
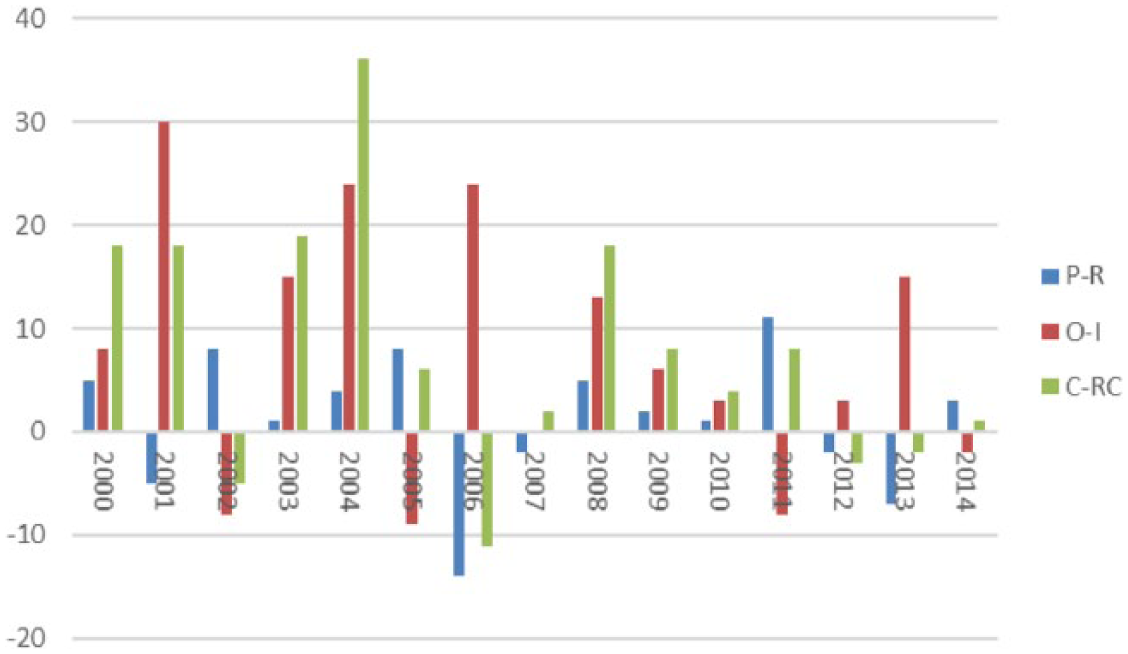
Balance between outside and inside (O-I), privatization and reverse privatization (P-R), and corporatization and reverse corporatization (C-RC).
Model and the Data
Similar to Warner and Hefetz (2012) and Gradus, Dijkgraaf, and Wassenaar (2014), we apply a logit model to test theories about changing ownership. The dependent variable takes the value 1 in years in which the municipality changes the mode of production, and 0 otherwise. Seven models are estimated, differing with respect to the direction of the shift. Our dependent variables are as follows: (a) change in ownership in general (1 if ownership changes, 0 otherwise); (b) ownership change from the market (1 if ownership changes to more inside production, 0 otherwise); (c) change to the market (1 if ownership changes to more outside production, 0 otherwise); (d) privatization (1 if ownership changes to private production, 0 otherwise); (e) reverse privatization (1 if ownership changes from private production, 0 otherwise); (f) not on balance (1 if change is such that waste collection should be not be consolidated on municipal balance in case of private or public enterprise, 0 otherwise) 11 ; and (g) corporatization (1 if ownership changes to municipality-owned firm, 0 otherwise). 12
Warner and Hefetz (2012) showed that a constellation of factors including characteristics of the municipality, fiscal concerns, management expertise, and political preferences are important in determining shifts between modes of service delivery. Based on the 2002 and 2007 surveys, the authors concluded that the most commonly reported reasons for insourcing were inadequate cost savings and service quality. By interviewing 17 municipal executives, Wassenaar, Groot, and Gradus (2013) described pragmatic and institutional motivations, such as stability of service provision, public choice, and the efficiency motive. In an empirical context, there are generally some data limitations. For example, no data on management expertise and monitoring are available for the Netherlands. Therefore, when describing our dependent variables below, it is explained why these are included. Furthermore, the hypotheses are expressed.
Output or Scale Variables
To test scale effects, the number of inhabitants and population density (number of inhabitants per hectare) are included as exogenous variables. On average, a Dutch municipality has about 37,000 inhabitants; the largest city (Amsterdam) has more than 800,000 inhabitants, and the smallest municipality has fewer than 1,000. To test for nonlinear scale economies, the squared number of inhabitants is included as well. In Gradus, Dijkgraaf, and Wassenaar (2014), some evidence that medium-sized municipalities are more likely to outsource is found. The hypothesis is that small and medium-sized municipalities have greater incentives to change to a mode other than in-house production as economies of scale can be achieved. Population density shows high variation between municipalities, indicating that the transport distance between individual pick-up points may vary. It is well known that shorter walking distances in areas of high density suggest that costs should be lower in these areas. Therefore, the hypothesis is that municipalities with lower population density have greater incentives to change to a mode other than in-house production, as costs can be shared. Based on these arguments, we hypothesize that the following:
Wealth Variables
Theory about the influence of fiscal concerns on contracting out suggests that budget constraints influence the trade-off between efficiency and social arguments. High levels of municipal debt increase the likelihood of privatization (Bel and Fageda 2007). Thereby, the municipal debt per capita in the year before is taken (cf. Zullo 2009). 13 Moreover, the freedom of Dutch municipalities to collect their own taxes is very restricted. The most important tax revenue for Dutch local government is a real-estate tax, with the value of dwellings as the tax base. In addition, as the value of dwellings correlates with personal income, the average personal income in a municipality as a fiscal concern variable is included. The average debt per inhabitant and average personal income (after taxes) in the Netherlands in this period are €1,600 (i.e., US$1,800) and €13,500 (i.e., $15,000), respectively. The hypothesis is that a municipality will weight cost savings more heavily in its outsourcing decision if its inhabitants are poor or there is a high level of debt per capita, and thus tend to change from in-house provision to the market. Based on these arguments, we hypothesize the following:
Political Preferences
As political variables, the percentage of seats of the following parties, based on the local council elections in 1998, 2002, 2006, and 2010 is included 14 : Green Left/Socialist party, social democrats, progressive liberals, Christian democrats, orthodox Protestants, and conservative liberals. 15 The so-called local parties are used as a benchmark because they do not have a common ideological orientation (Boogers and Voerman 2010). In the Netherlands, the aldermen are responsible for the daily operations of a municipality 16 . Therefore, as an alternative, the percentage of the aldermen is incorporated, based on the same elections shown above. 17 In both estimations, conservative liberals are expected to be more willing to change ownership toward outside or private waste collection, in contrast with social democrats and the Green Left/Socialist party.
Interest Group Variables
Unionization can be an important factor limiting government flexibility in exploring outsourcing (Dijkgraaf, Gradus, and Melenberg 2003). However, data are not available for the number of public employee union members in a Dutch municipality. Therefore, labor market conditions are included as an approximation of interest group variables. In general, it is expected that a government will be less willing to change ownership to the market if unemployment in a municipality is high, as this change would make it less likely that workers would be hired locally. Therefore, the municipal unemployment rate in our estimations is included.
Finally, we test whether (political) fragmentation plays a role in outsourcing decisions. Warner and Hefetz (2002) found some evidence in 1992 and 1997 that U.S. counties with a high opposition index (constructed on the basis of the opinions from elected officials, local government line employees, and department heads as well on an index for restrictive labor agreements) use less outside entities. For cooperation, this result was confirmed in Hefetz, Warner, and Vigado-Gadot (2012), although their conclusion for 2002 privatization was the opposite as political fragmentation increased the ability to privatize. Zafra-Gómez et al. (2016) in analyzing privatization of Spanish water services did not find any results for political fragmentation. Therefore, we are unable to specify a sign for the hypothesis concerning political fragmentation (Hypothesis 6). Another issue is how to measure political fragmentation. Goeminne, Geys, and Smolders (2008) measured fragmentation by the number of political parties in the board of mayor and aldermen. They show that more fragmented boards are less optimistic about tax revenues and, therefore, have lower budgets. Similar to their approach, we calculate board fragmentation as the number of political parties in the board of aldermen divided by the numbers of aldermen. Moreover, we also analyze political fragmentation in the municipal council, by dividing the number of political parties in the council by the number of seats. 18
Data
Data for the number of inhabitants, population density, municipal debt, income, and other municipal characteristics come from Statistics Netherlands. Institutional data on waste collection were provided by the Dutch Waste Management Council. Data about these political characteristics (seats and aldermen) in election years were collected from the Gids Gemeentebesturen (Guide to Municipal Boards), which is published by the Vereniging van Nederlandse Gemeenten (Association of Dutch Municipalities), as well as through an internet search. See Table 4 for descriptive statistics. 19 , 20
Descriptive Statistics.
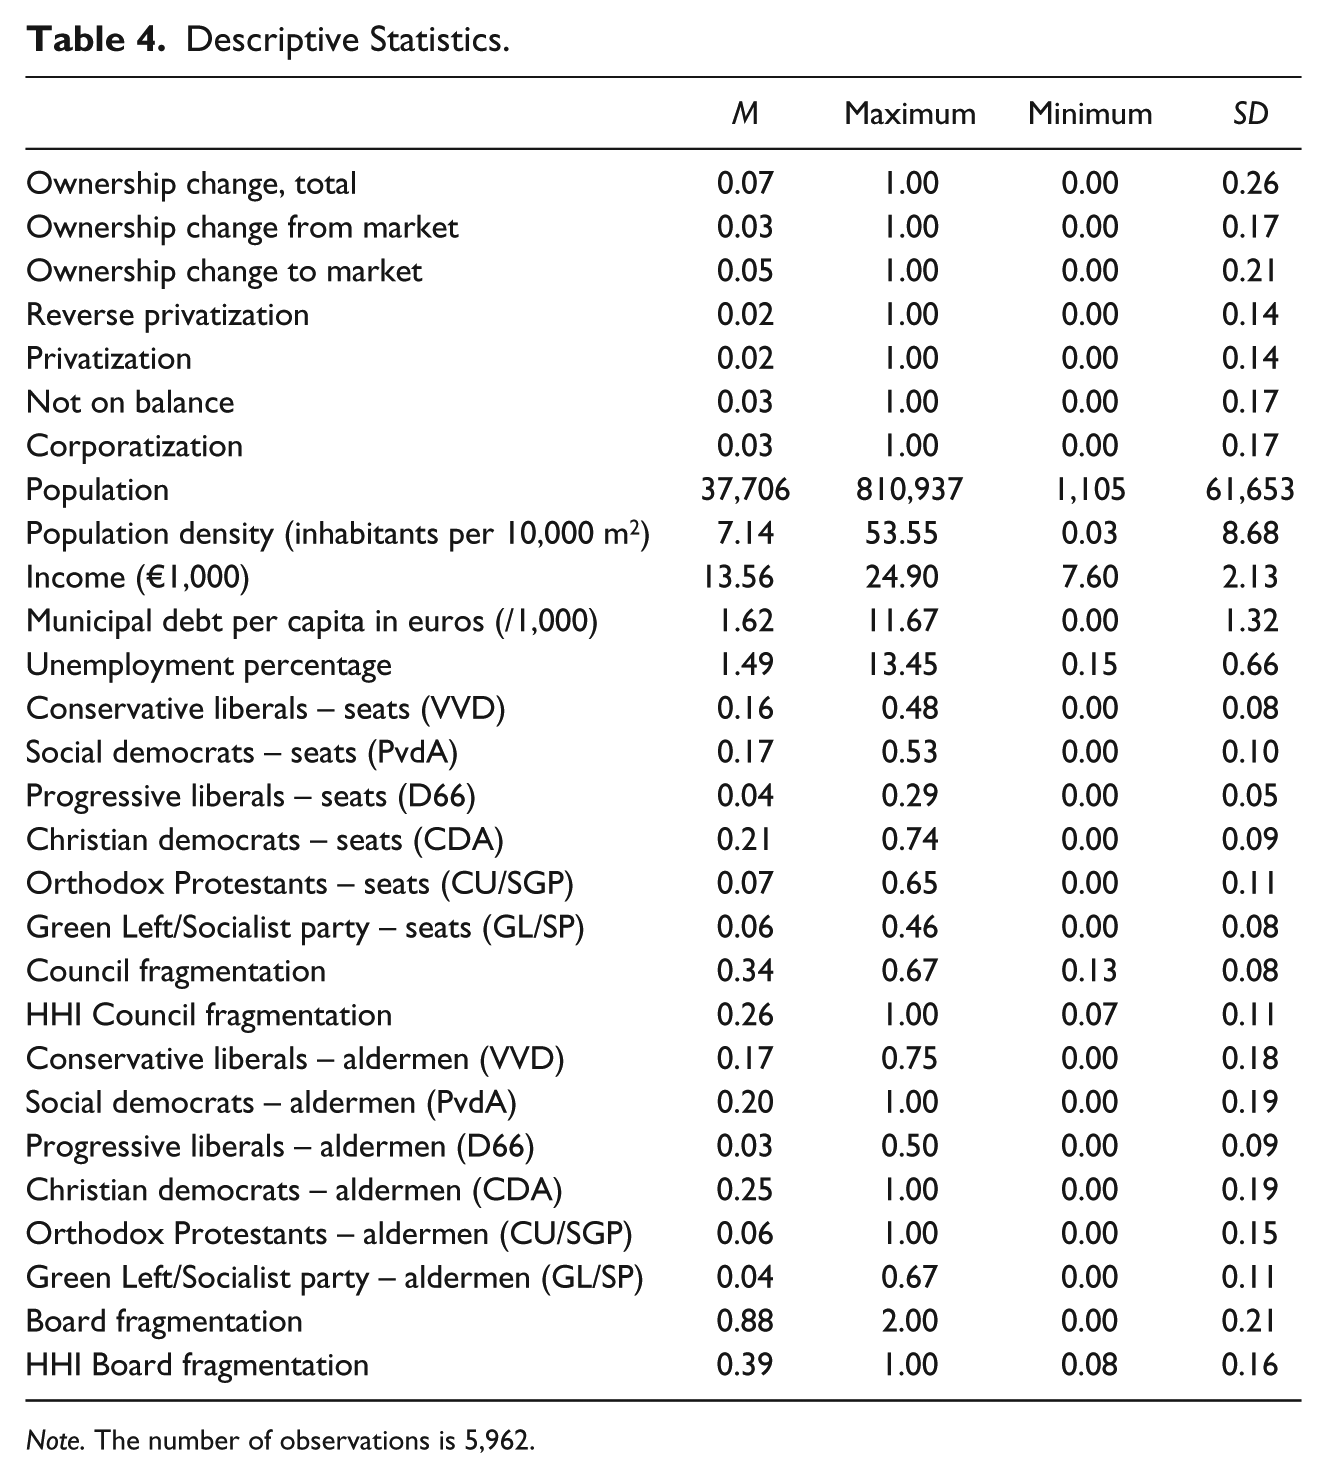
Note. The number of observations is 5,962.
Results
Table 5 shows the estimation results. 21 , 22 To correct for differences between years, we include year fixed effects. To test for lack of fit, we apply the Hosmer and Lemesbow goodness-of-fit test. 23 This tests the match between observed and expected events. If the test is passed, the hypothesis that “there is a match” is not rejected. Except for reverse privatization, all tests are passed as the probabilities are above 10%, giving in general no evidence of a lack of fit. 24
Estimation Results for 1999–2014: Basic Model.
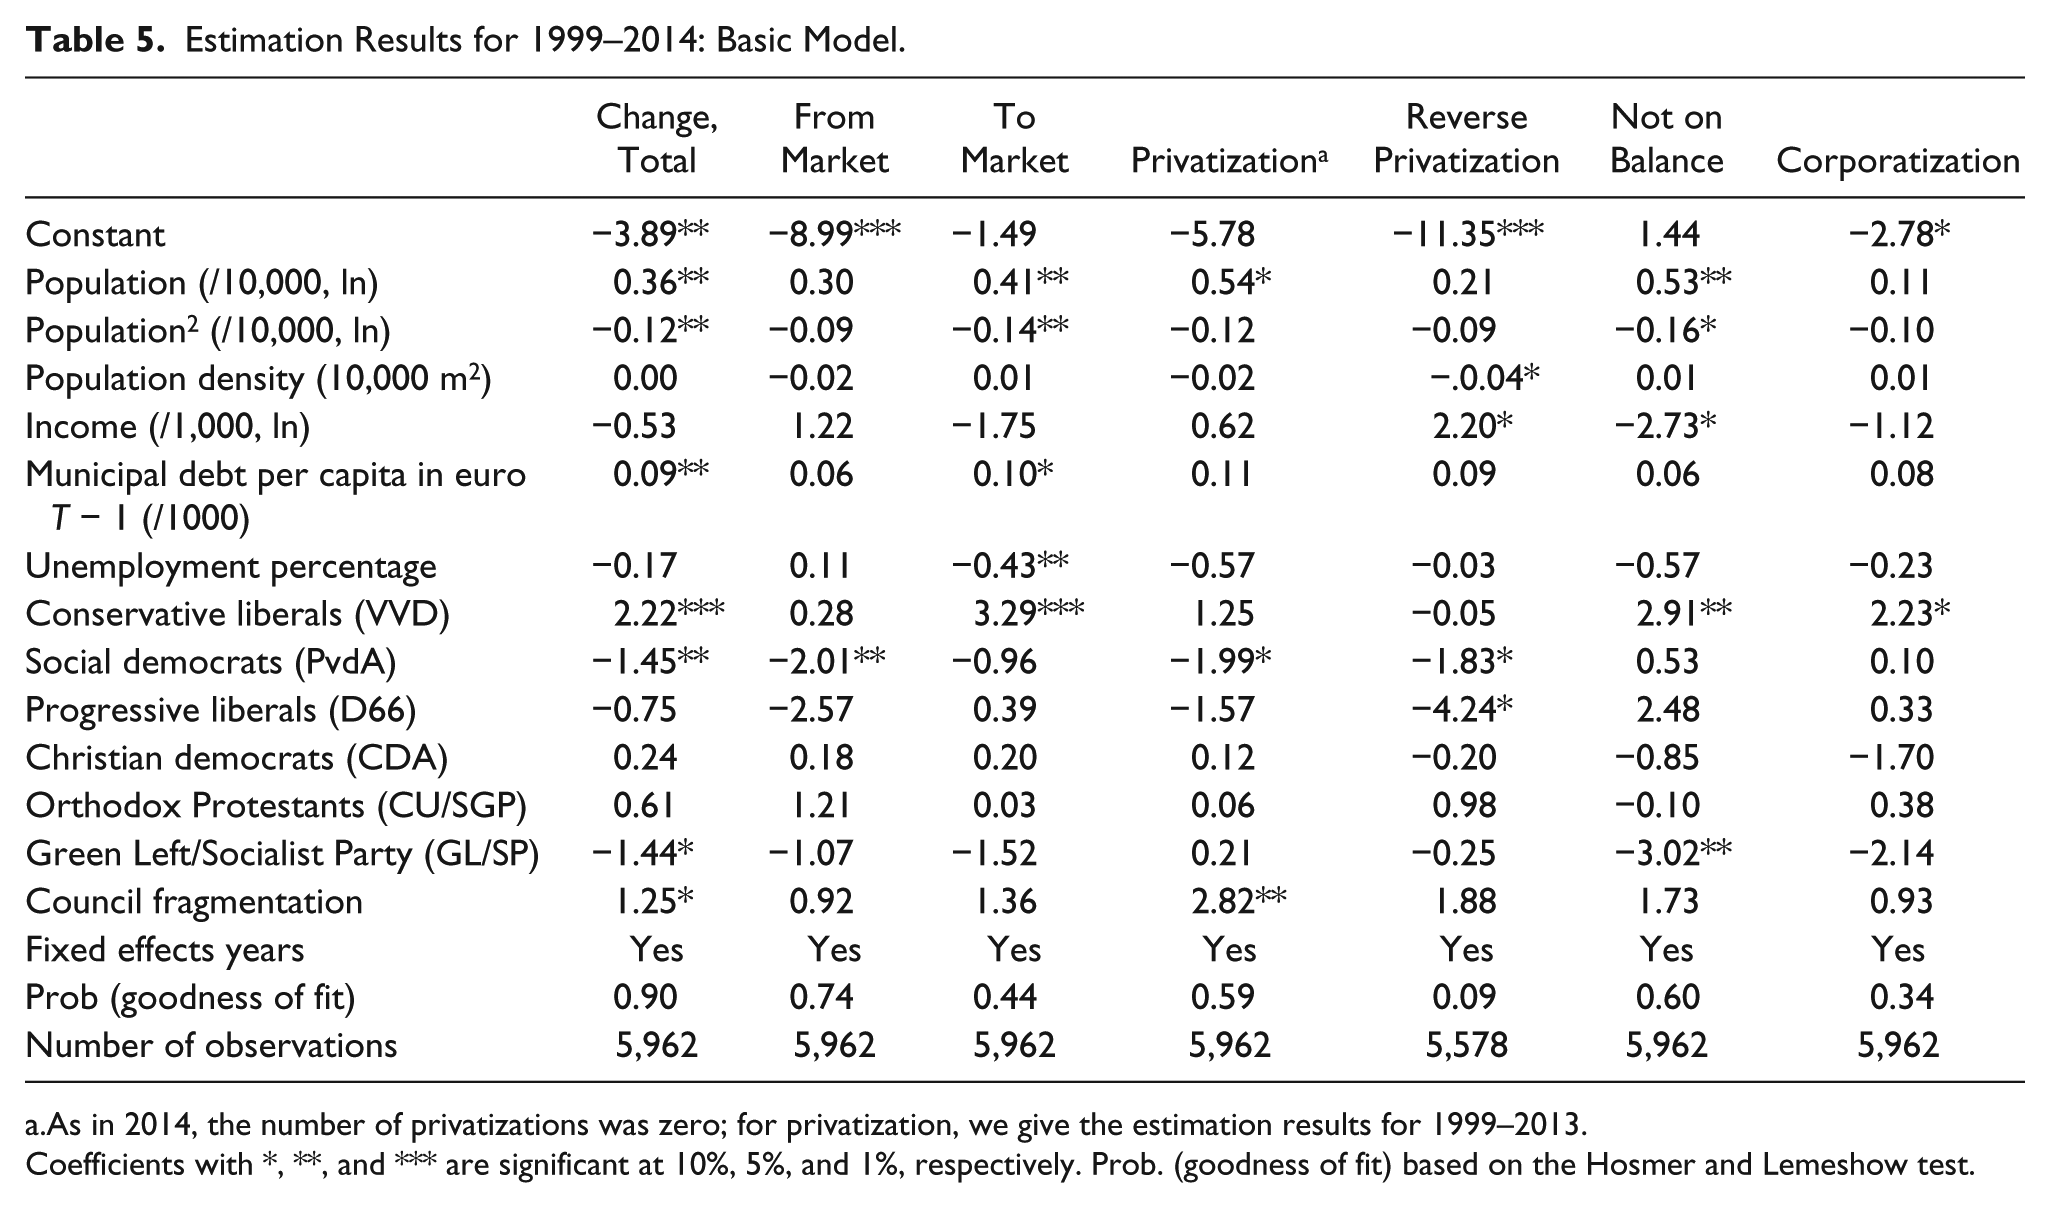
As in 2014, the number of privatizations was zero; for privatization, we give the estimation results for 1999–2013.
Coefficients with *, **, and *** are significant at 10%, 5%, and 1%, respectively. Prob. (goodness of fit) based on the Hosmer and Lemeshow test.
When all changes (“change, total” in Table 5) are investigated, population, population squared, debt, and a number of political variables are significant. The population variables are significant (at the 5% level) for changing. 25 The maximum of the polynomial is at around 45,000 inhabitants: If the number of inhabitants increases up to this maximum, the probability of changing increases; with a population higher than this maximum, it decreases. 26 This result supports the first hypothesis (Hypothesis 1). Debt has a positive effect on change (significant at the 5% level): The higher the debt, the higher the chance that a change occurs. This is in accordance with the hypothesis that a municipality will weight change more heavily if its debt is high (Hypothesis 3). The attitude of the conservative liberals toward changing the mode of production turns out to be positive and significant at 1% (compared with local parties, which are the reference group), whereas the attitude of the social democrats turns out to be negative and significant at 5%. Also, the attitude of Green Left/Socialist party turns out to be negative but only significant at 10%. For other parties and other variables, no significant results are found. Interestingly, for council fragmentation, we found a positive and significant (at 5%) sign, so political fragmentation increases the ability to privatize. However, if instead of the number of political parties, a Hirschman–Herfindahl Index (HHI) is used, this result disappears. As our initial finding is not robust enough, Hypothesis 6 seems to be confirmed. 27
Only one significant effect (besides the constant) is found if we analyze the shifts from the market. For the political variables, a negative and significant effect for the social democrats (at the 5% level) is observed. If we analyze the shifts to the market, of the political variables, only the attitude of the conservative liberals is significant (at the 1% level) and positive. This partly supports the hypothesis that right wing parties have a higher probability to change to the market (Hypothesis 4). In addition, a municipality is less willing to change ownership to the market if unemployment in a municipality is high, hereby confirming Hypothesis 5. The population variables are significant at 5% for changing to the market. The maximum of the polynomial is at around 43,000 inhabitants. 28 For debt, we find a positive and significant effect (at the 5% level) if changing to the market is considered.
In the fourth and fifth columns, the shifts to and from privatization are analyzed. As this debate is more ideological, we would expect social democrats and the Green Left/Socialist party to be in favor of reverse privatization, and conservative liberals, orthodox Protestants, and Christian democrats to be in favor of privatization. These expectations do not fit with the results. The social democrats are at the 10% level against both P-R and progressive liberals at the 10% level against reverse privatization, and for other parties, we did not find an indication. For reverse privatization, we get significant results for population density and income (both at the 10% level). The larger the population density, the lower the chance of reverse privatization, which is also in accordance with Hypothesis 2. Moreover, more fragmented councils seems more likely to privatize (at the 5% level), and this is not in accordance with expectations, although this finding is not robust in other specifications.
In addition, for the creation of outside entities (see column 6 in Table 5), we have some evidence that left-wing parties such as the Green Left/Socialist party will not make use of outside entities to avoid the debt limits imposed on municipal administration. This is contrary to Spain, where there were some indications that among left-wing governments, it is more common to decentralize if debt increases (see Cuadrado-Ballesteros, García-Sánchez, and Padro-Loronzo 2013). Conservative liberals are more willing to create outside entities. However, also here, other variables such as the income level are important to explain this trend. In addition, the population variables are significant at the 5% and 10% level. The maximum of the polynomial is at around 52,000 inhabitants. 29 This is again in accordance with Hypothesis 1. Finally, for corporatization (see column 7 in Table 5), we only get one significant result at the 10% level for the conservative liberals. For all other variables, no effect are found. So, there is no indication that this shift is politicized or that scale effects or fragmentation play an important role.
As a kind of sensitivity analysis and to further analyze the influence of political parties on (reverse) privatization decisions, we specified an alternative model, in which we used other political variables. As indicated earlier in this article, in Dutch municipalities, it is the municipal council that takes outsourcing decisions. However, the aldermen are in charge of the daily operations, and under their supervision, the civil servants prepare the business cases for these decisions. In Table 6, we have included the percentage of aldermen from each political party (as a percentage of the total) instead of the number of seats. First, notice that all tests based on Hosmer and Lemeshow are passed as the probabilities are above 10%, giving in general no evidence of a lack of fit. In this alternative model, the attitude of the conservative liberals toward changing the mode of service delivery is no longer significant. For changing from the market and reverse privatization, we now find for conservative liberal aldermen a significant and negative coefficient. So, this could be an indication that there is a hesitation against this shift. Interestingly, for privatization we find a hesitation by social democratic aldermen, which is in accordance with our expectations (Hypothesis 4). Only for shifts not on balance, we found a positive and significant effect for progressive liberal aldermen. Notice that in four of six cases, the unemployment percentage of a municipality is negative and significant (at least the 5% level), indicating that aldermen of a municipality are less willing to change ownership to the market or privatize if unemployment in a municipality is high and therefore supporting Hypothesis 5. Furthermore, for other variables, we found some significant results, although these are less robust. For political fragmentation of the board of aldermen in change total, we now found a negative sign and significant (at the 10% level), although it becomes positive again if we use an Hirschman–Herfindahl Index (HHI) instead of the number of parties. 30 Notice that the effect of debt in case of aldermen disappears. Finally, for corporatization, we get no significant results. 31
Estimation Results for 1999–2014: Logit Model with Aldermen.
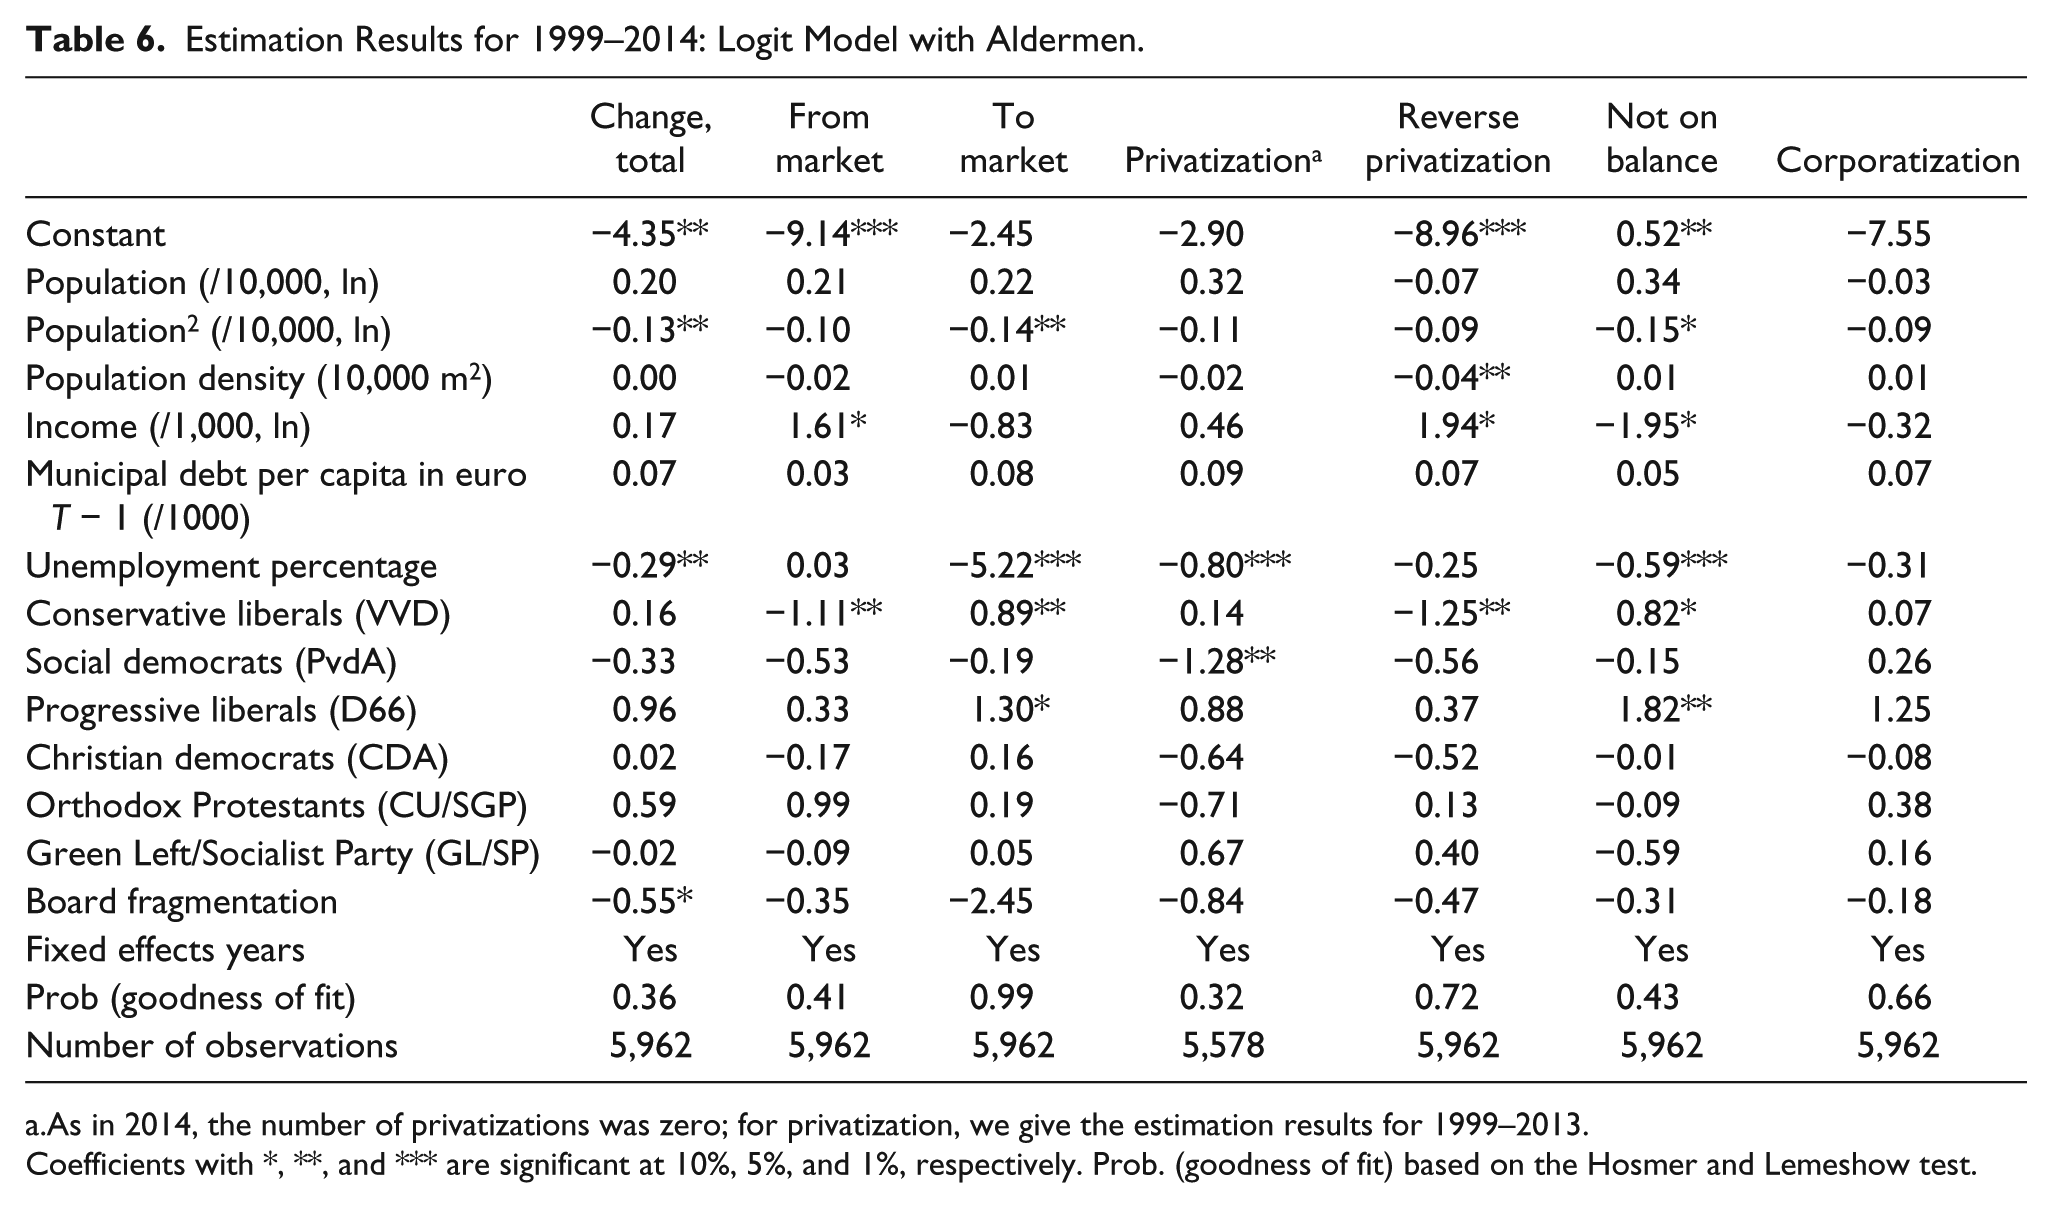
As in 2014, the number of privatizations was zero; for privatization, we give the estimation results for 1999–2013.
Coefficients with *, **, and *** are significant at 10%, 5%, and 1%, respectively. Prob. (goodness of fit) based on the Hosmer and Lemeshow test.
Finally, another robustness test is included. In the binary logit regressions in Tables 5 and 6, it is assumed that all shifts have comparable value. If a municipality changes from collecting in-house to collection by a neighbor, the left-hand variable is exactly the same as when the municipality changes to private collection. Table 7 presents estimations using ordered logit regressions. Now for each transition, the number of steps to and from the market is counted. For instance, if a municipality changes collection from in-house to using a neighbor, the count is 1. If a municipality privatizes its waste collection from being in-house, the count is 4. Thus, the endogenous variable is now the degree of change.
Estimation Results for 1999–2014: Ordered Logit Model.
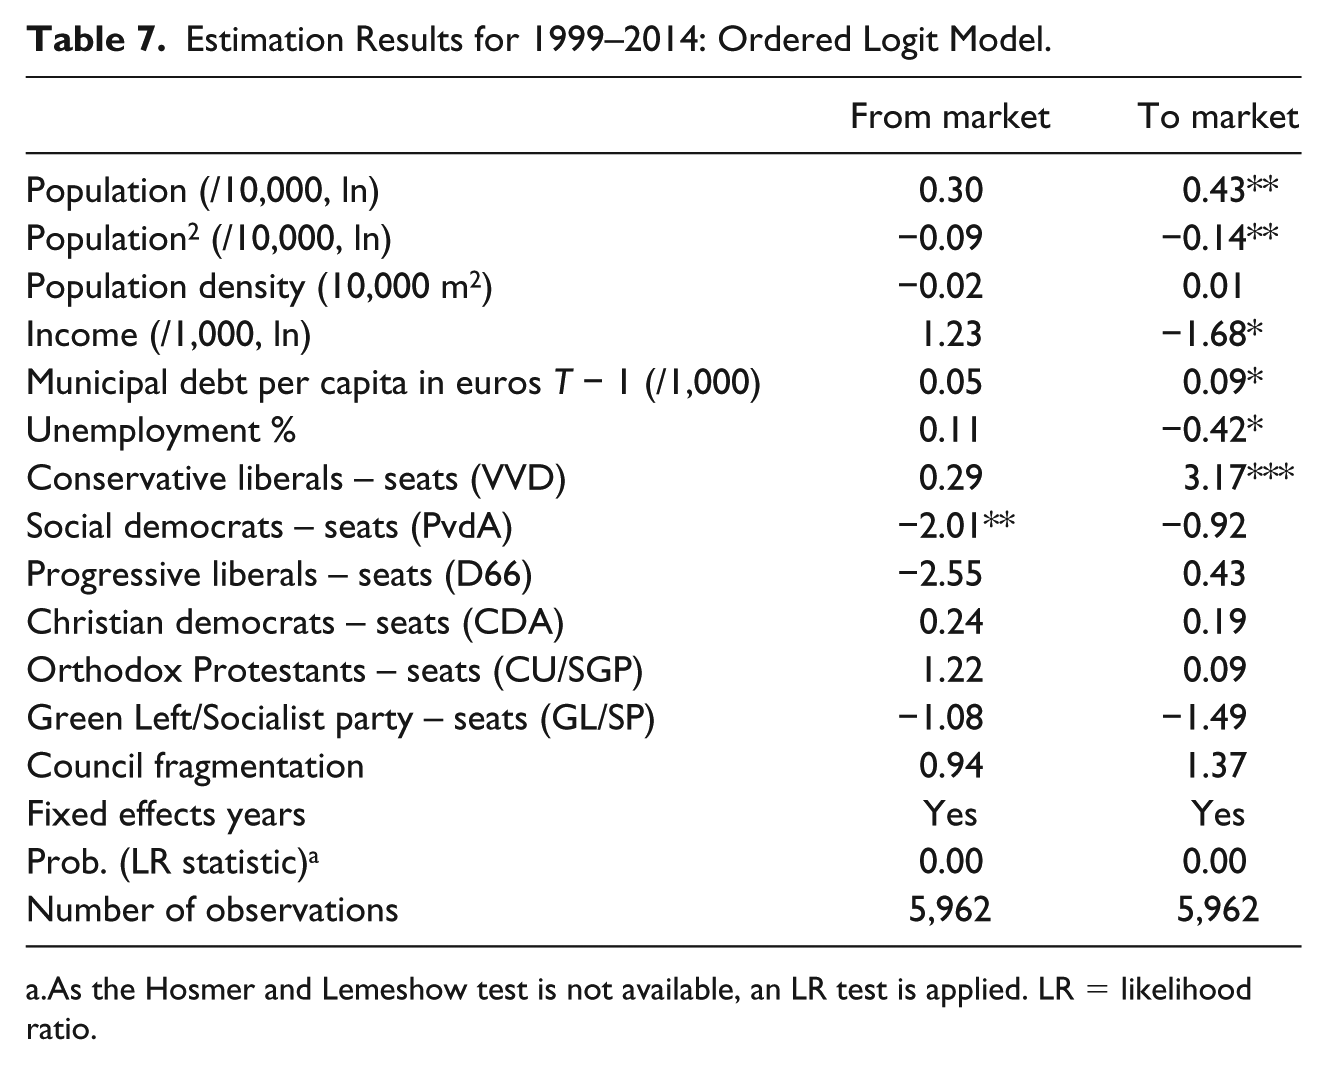
As the Hosmer and Lemeshow test is not available, an LR test is applied. LR = likelihood ratio.
The estimation results in Table 7 are comparable with the earlier logit from and to market results in Table 5. 32 Importantly, the attitude of the conservative liberals toward changing the mode of production to the market turns out to be positive and significant at 1%, whereas the attitude of the social democrats from the market turn out to be negative and significant at 5%. Similarly, population variables are significant for a move to the market (for population square at 10%). The maximum of the polynomial is at around 46,000 inhabitants. 33 In addition, a high unemployment percentage lowers the probability of changing to the market (at 10%). Therefore, the conclusion is that our results do not depend on the assumption in the logit estimations that all changes are of comparable value.
Summarizing, positive (significant) effects on changing at all, changing to the market, and not on balance are found for the main right-wing party, the conservative liberals, while mostly negative effects are found for the main left-wing party, the social democrats. For conservative liberal aldermen, negative effects for changing from the market and reverse privatization and positive effects for changing to the market are found. So, conservative liberals are positively associated from moving to the market, and for social democrats, we get the reverse. For other political parties, there are no effects, or they are weak. Moreover, there is evidence that small and medium-sized municipalities have a larger probability for changing, especially to the market and not on balance, than larger municipalities. In addition, we found evidence for the unemployment effect as in most estimations, especially to market or to privatize, municipalities with a high level of unemployment are less willing to change. For fragmentation and other hypothesis, less evidence is found as the estimations are not so robust.
Conclusion and Discussion
In local government, in the 90s, contracting out of municipal services was important as a reform to promote efficiency. Even for waste collection, this efficiency gain was hard to realize as local government markets are noncompetitive and have large transaction costs (Bel, Fageda and Warner 2010; Dijkgraaf and Gradus 2007). Therefore, alternatives as inter-municipal cooperation and corporatization were explored in the beginning of this century (Tavares 2017; Voorn. van Genugten and van Thiel, 2017). Similar to some other European countries, the Netherlands face a trend toward municipality-owned firms and corporatization. By analyzing the patterns over time in changes in the modes of production for Dutch waste collection between 1999 and 2014, almost 40% of the shifts was corporatization. Moreover, reverse privatization was favored more than privatization. In recent years, the number of shifts dropped remarkably. This seems in line with Warner (2016), who based on recent U.S. data, finds less reversals. She argues that reversals are more common for private production than for inter-municipal contracts.
Contrary to most literature exploring political factors, some evidence of an ideological motivation for changing the mode of production is found. Councils with many conservative liberals are in favor of change, particularly toward the market and privatization, whereas councils with many social democrats are against change. If we look at the aldermen, who form the executive board of a municipality, we find two negative effects: Municipalities with many conservative liberal aldermen are against reverse privatization, and those with many social democrats are against privatization. This is somewhat different from Bel and Fageda (2009), who found in a meta-study no systematic relationship between local privatization and ideology at all. Remarkably, corporatization is not politicized at all. Moreover, aldermen in municipalities with higher unemployment have some hesitation to outsource this service in general, to market or privatize it. This gives an indication for political patronage (Dijkgraaf et al., 2003). Political fragmentation seems to play a modest role, although a highly fragmented council (measured by the number of political parties) seem to favor privatization. For other measures and other models, the evidence on fragmentation is weaker, so this issue is still open. For local service delivery but also for utilities, it is important to exploit scale effects. Based on this research, there is some hesitation to privatize as alternatives as corporatization gives less political opposition and are able to exploit scale effects as well.
There are many avenues to explore for future research. First, as it might be easier to contract out waste collection where neighboring municipalities also use external collectors, a variable reflecting this strategic interaction could be included (see Bivand and Szymanski 2000). However, based on 2002 data, an indication of spatial autocorrelation was not found (e.g., Dijkgraaf and Gradus 2007, Table 5). Second, another important topic for future research is the private concentration of the market and its relation to shifts. Other work showed that in provinces with a high concentration of private firms, there is less competition and costs are higher (see Dijkgraaf and Gradus 2007; Gradus, Dijkgraaf and Schoute 2016). Third, our analysis can be extended to tasks other than waste collection. Brown and Potoski (2003) showed that service characteristics are important in understanding the nature of transaction costs and the contracting-out process. In Schoute, Budding, and Gradus (2017), the influence of service, political, governance, and financial characteristics on municipalities’ choices of 12 Dutch municipal tasks is investigated, and it is shown that transaction costs and governance characteristics are important elements in contracting-out decisions. Thereby, special attention should be paid to social services as the role of political ideology might be different from more technical services (see Petersen, Houlberg, and Christensen 2015; Plata-Díaz et al., 2017). Fourth, Zafra-Gómez et al. (2016) found, for shifts in Spanish water services, statistical evidence that the parametric specification of logit estimations is too inflexible. A discrete time survival model could be suitable, especially for interpreting the ideological variables. Fifth, an in-depth analysis, for example, based on interviews, of those municipalities, which have a re-municipalization, can be helpful to understand the underlying reasons.
Footnotes
Declaration of Conflicting Interests
The author(s) declared no potential conflicts of interest with respect to the research, authorship, and/or publication of this article.
Funding
The author(s) received no financial support for the research, authorship, and/or publication of this article.