
Abstract
Low utilization of dental services among low-income individuals and racial minorities reflects pervasive inequities in U.S. health care. There is limited research determining common characteristics among dentists who participate in Medicaid or the Children’s Health Insurance Program. Using detailed Medicaid claims data and a provider database, we estimate that among dentists with 100 or more pediatric Medicaid patients, 48% practice in high-poverty areas, 10% practice in rural areas, and 29% work in large practices (11 or more dentists). Among those with zero Medicaid patients, 18% practice in high-poverty areas, 4% practice in rural areas, and 11% work in large practices. We found that dentist race/ethnicity has an independent effect on Medicaid participation even when adjusting for community characteristics, meaning non-White dentists are more likely to treat Medicaid patients, regardless of the median income or racial/ethnic profile of the community.
Introduction
Oral health is an essential component of overall health, yet low-income populations experience significant barriers to dental care compared with high-income individuals. In fact, compared with medical care services, prescription drug services, mental health care, and eyeglass services, more people reported not getting needed dental services due to cost, irrespective of age and income (Vujicic et al., 2016). Racial disparities in dental care access have narrowed over the last decade for children, but Black and Hispanic children are still less likely to visit a dentist than White children (American Dental Association [ADA], 2021). However, lack of providers and the level of Medicaid reimbursement (Buchmueller et al., 2015) are not always reasons why there are disparities in dental care access in Medicaid populations. For example, in North Carolina, 90% of publicly insured children live within a 15-min travel time of a dentist who participates in Medicaid or the Children’s Health Insurance Program (CHIP), and 96% of the entire population lives within a 15-min travel time of any dentist (Vujicic, 2017). Rather, for a given supply of dentists, one should examine how intensely they treat publicly insured populations and the factors associated with dentist participation in Medicaid. This sheds light on what factors are likely to expand the provider network serving low-income populations. Hence, it is important for policymakers to understand provider, practice, and local area characteristics that influence dentist participation in Medicaid, including the role of provider and population race and ethnicity. This helps policymakers devise strategies to attract more dentists to treat publicly insured patients, particularly racial and ethnic minorities and other populations that are traditionally underserved.
There is evidence that physician primary care practices that were most likely to have substantial Medicaid revenue were affiliated with large groups/hospitals, located in rural areas, located in Medicaid expansion states, part of federally qualified health centers (FQHCs), or located in areas with lower median household income (Spivack et al., 2021). In dentistry, the level of Medicaid reimbursement has a modest effect on dentist participation in Medicaid (Buchmueller et al., 2015). Other studies examining characteristics among Medicaid dentists have been single-state studies that were not representative at the national level (Logan et al., 2014; Maxey et al., 2018; Reynolds et al., 2019). Other studies have excluded community demographic characteristics from their analyses (Serban et al., 2019), precluding the examination of, for example, population-provider race concordance, an important first step in improving equity in dental care delivery (Mertz et al., 2016). Another study examined various factors (e.g., age, rurality, dentist specialty) associated with Medicaid participation as measured by data from Insured Kids Now (IKN) (Nasseh & Vujicic, 2017).
New Contributions
To measure dentist participation in Medicaid and CHIP, the ADA’s Health Policy Institute used data from IKN (InsureKidsNow.gov, n.d.), a website administered by the Centers for Medicare and Medicaid Services (CMS) for parents of publicly insured children to find dentists who participate in Medicaid or CHIP. A key limitation of IKN data is that many states list dentists as Medicaid providers although some of these providers do not accept new patients or do not actually treat publicly insured patients (Vujicic et al., 2021).
To overcome this limitation, our study used detailed 2017 Medicaid and CHIP dental claims data. We merged these data with a 2017 dentist provider database that identifies dental practice locations, dentist specialty, practice size, and other dental practice characteristics. These data sources collectively allowed us to compare the characteristics of dentists who actively treat Medicaid patients with dentists who do not.
In this article, we advance the research on provider participation in Medicaid for the dental care sector by using national Medicaid and CHIP claims data to measure dentist engagement with Medicaid patients. We examine race, other dentist demographics, practice modalities, and local area characteristics associated with participation and take that a step further by exploring population-provider race concordance in the communities where dental practices are located. We employ a robust methodology that builds upon a recent similar analysis for medical care (Spivack et al., 2021), offering a comprehensive assessment of the factors associated with dentist Medicaid participation.
Study Data and Methods
Data and Sample
Dentists from the 2017 ADA office database constitute the denominator used in our analysis (ADA, 2017). This database contains a unique office identifier that maps dentists into specific locations and a provider-specific National Provider Identifier (NPI) number that identifies unique dentists. The database also contains street addresses identifying dental offices, including the five-digit zip code and the five-digit county Federal Information Processing System (FIPS) code of the practice location. Along with dentist characteristics such as specialty, race/ethnicity (White, Black, Asian, Hispanic, and other race), age, and gender, the database also identifies dentists affiliated with dental service organizations (DSOs), which are large-group practice entities that manage the administrative aspects of a practice (Winegarden & Arduin, 2012). The ADA office database also maps dentists into FQHCs, which provide health care services for low-income individuals.
Our measure of dentist participation in pediatric Medicaid or CHIP programs is the number of unique patients a dentist treated and billed Medicaid for in 2017. We focused on children in this study because pediatric Medicaid and dental benefits are mandatory and are fairly uniform across states (Medicaid.gov, n.d.a), unlike Medicaid dental benefits for adults, which are an optional benefit in Medicaid (Medicaid.gov, n.d.b). We generated this variable from 2017 de-identified Medicaid and CHIP dental claims data from the Transformed Medicaid Statistical Information System (T-MSIS), maintained by CMS (Medicaid.gov, 2021). For children aged 0 to 20, we extracted from the monthly “other service” line tables all procedure codes that begin with the letter “D” (D0100-D9999) that represent Codes of Dental Procedures and Nomenclature (CDT) (ADA, 2020a). For each individual provider-specific NPI number associated with a dentist in T-MSIS, we counted the number of unique Medicaid enrollees aged 0 to 20 with a dental claim identified with a CDT code. We excluded dentists from Arkansas, District of Columbia, Indiana, Nebraska, Nevada, Pennsylvania, South Dakota, and West Virginia as these states had high rates of missing data on provider NPI (5% or more) in T-MSIS in any given month in 2017. By provider NPI, we merged our metric of dentist participation—number of publicly insured pediatric patients—back to the 2017 ADA office database. We assumed that any dentist from the office database that we could not match to T-MSIS had zero Medicaid or CHIP patients for calendar year 2017. The online data appendix has more details on the T-MSIS claims data. We excluded all specialties except general practice (GP) dentists and pediatric dentists as these dentists are most likely to treat children. Our final analytic sample included 132,612 dentists.
This research is part of a data use agreement approved by the Centers of Medicare and Medicaid Services (DUA RSCH-2020-5563: “The State of Oral Healthcare Use, Quality and Spending: Findings from Medicaid and CHIP Programs”). The authors received institutional review board (IRB) approval to conduct this research using Medicaid claims data from T-MSIS.
Statistical Analysis
First, in unadjusted bivariate analysis, we grouped dentists into the following categories: zero Medicaid patients, 1 to 9 patients, 10 to 100 patients, and over 100 patients. We then compared dentist, dental practice, and local area characteristics across groups. To test for statistically significant differences across groups, we used chi-square tests for categorical variables, adjusted Wald tests for normally distributed variables, and Mann–Whitney U tests for non-normally distributed variables. In robustness checks, our results were similar using different patient cutoffs for dentists.
We used a hurdle regression model with an exponential mean function in our main adjusted analysis to model the expected number of unique Medicaid patients a dentist sees in a given year. The hurdle model allows us to disentangle the Medicaid participation decision (dentist has greater than zero Medicaid patients in calendar year) from the number of patients that a dentist chooses to treat if he or she participates in Medicaid (Wooldridge, 2010). The online technical appendix has more details on the hurdle regression model.
The regression model adjusts for the following dentist demographic characteristics: a categorical dentist age variable (age 21–34, age 35–49, age 50–64, age 65+), gender, race/ethnicity (non-Hispanic White, non-Hispanic Black, Hispanic, non-Hispanic Asian, non-Hispanic other race), and a binary variable identifying a pediatric dentist. Based on the zip code of a dentist’s practice(s) in the 2017 office database, we also included the following local area characteristics from the 5-year 2015–2019 American Community Survey (U.S. Census Bureau, 2020) in our regression model: median household income, dentist located in a poverty zip code (defined as poverty rate is ≥20%) (Spivack et al., 2021), and whether the dentist is located in a majority non-White zip code. We also included an indicator variable identifying whether a dentist has an office location in a rural zip code based on the rural-urban commuting area (RUCA) classification (U.S. Department of Agriculture, 2020) and the average number of dentists per capita (dentists per 100,000 population) across the counties where a dentist has practice locations. Based on the RUCA classification, zip codes located in “large rural,” “small rural,” or “isolated” areas are defined as rural. Practice-level variables included in the regression model included whether a dentist is located at an FQHC, whether the dentist is affiliated with a DSO, and the average practice size (number of dentists) across all locations affiliated with the dentist. Average practice size is included as a categorical variable (1–2 dentists, 3–10 dentists, and 11 or more dentists). After estimating the hurdle regression model coefficients, we calculated average marginal effects of all variables on expected number of patients. To account for potential differences in state Medicaid policy, our specification includes a categorical variable for state location of primary dental practice (e.g., state fixed-effects) that accounts for differences in how states may administer their pediatric Medicaid programs.
To measure whether racial differences exist in dentist Medicaid participation, for each dentist race/ethnic category, we calculated the average marginal effect of a dentist having an office in a majority non-White zip code on expected number of publicly insured patients. If dentists of different race/ethnicities have different marginal effects of having an office in a majority non-White zip code compared with a majority-White zip code, then that may be evidence of a disparity in dentist participation by dentist race according to the community race/ethnicity profile.
Study Results
Dentist and Practice Characteristics
In our sample, 72% of dentists were non-Hispanic White, 5% were pediatric dentists, 51% worked in practices with one or two dentists, 6% performed services at an FQHC, 9% were affiliated with a DSO, 26% worked at a high-poverty zip code, 31% were female, and 41% worked at a majority non-White zip code, and the median household income was US$74,600 (Table 1). The majority of dentists in our sample (67%) had zero Medicaid patients and about 18% had more than 100 Medicaid patients. Compared with dentists with 100 or more Medicaid patients, among dentists with zero Medicaid patients, a higher percentage were non-Hispanic White, a lower percentage worked in practices with 11 or more dentists, a higher proportion practiced in a majority-White zip code, a lower percentage practiced in a high-poverty zip code, and a lower fraction of dentists had a practice in a rural area. Median household income was also higher in areas where dentists treated zero Medicaid patients compared with other dentists. All measured bivariate associations were statistically significant at the 1% level.
Unadjusted Characteristics by Medicaid Patient Group.
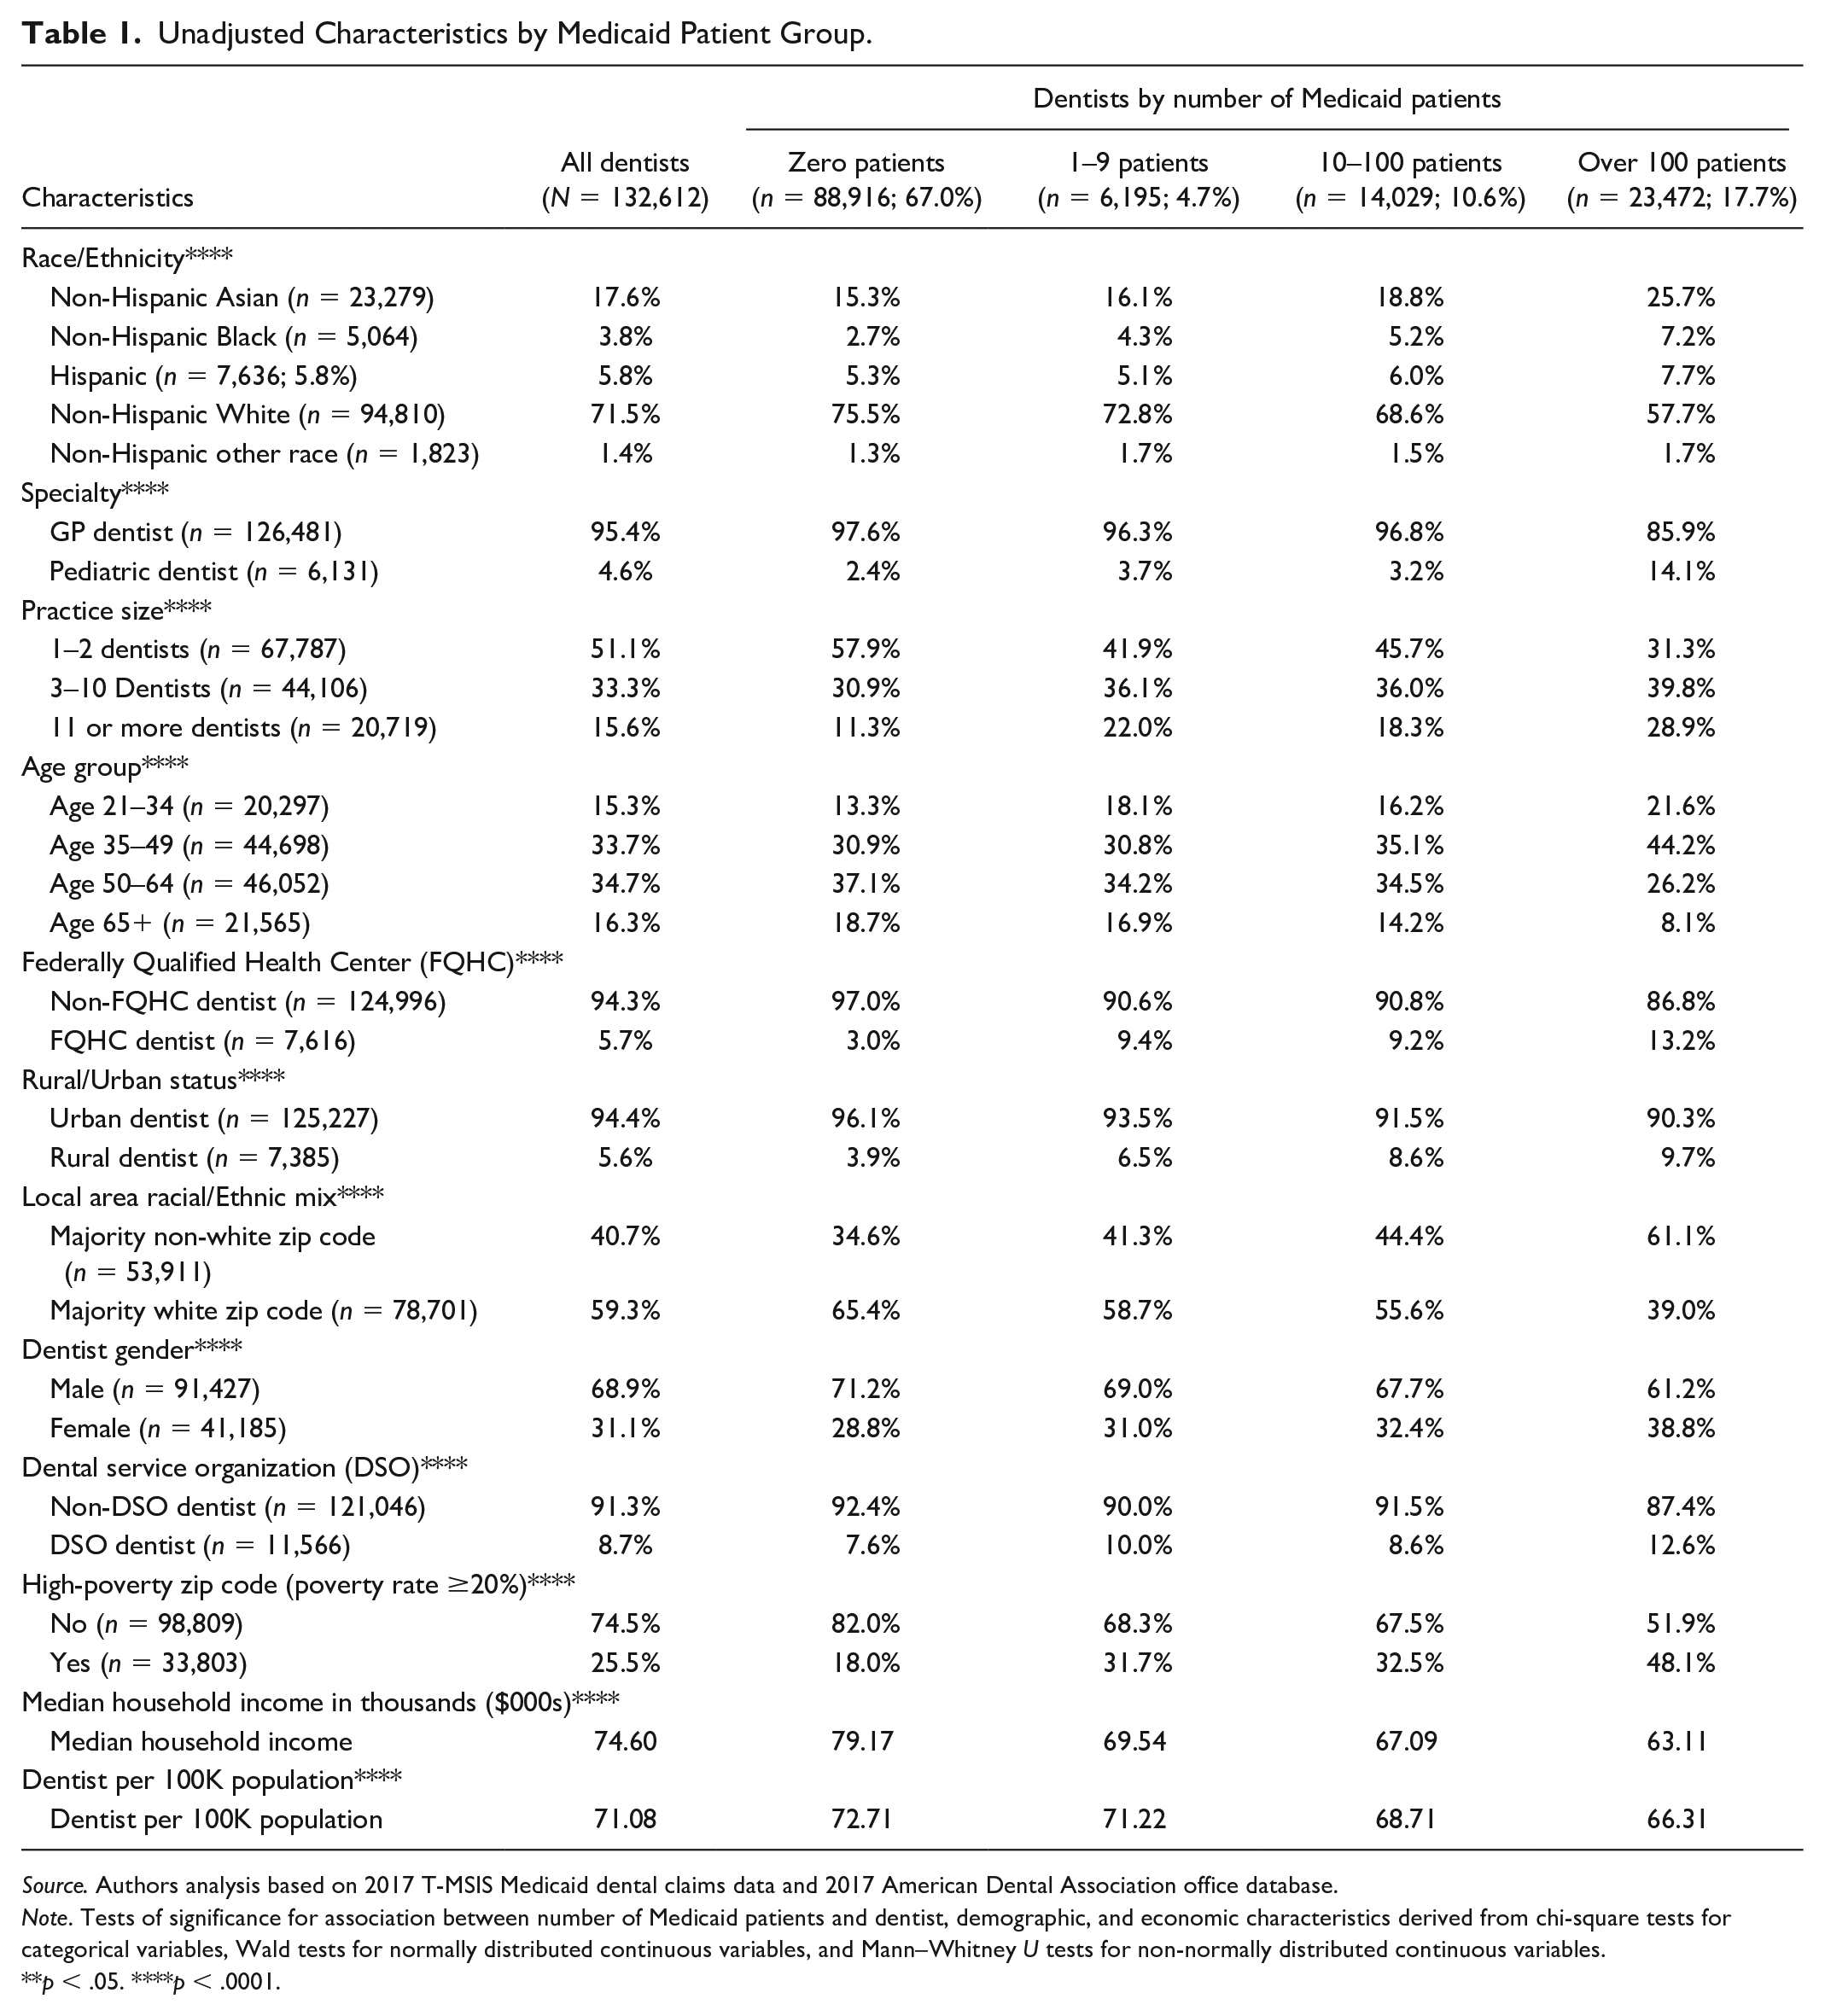
Source. Authors analysis based on 2017 T-MSIS Medicaid dental claims data and 2017 American Dental Association office database.
Note. Tests of significance for association between number of Medicaid patients and dentist, demographic, and economic characteristics derived from chi-square tests for categorical variables, Wald tests for normally distributed continuous variables, and Mann–Whitney U tests for non-normally distributed continuous variables.
p < .05. ****p < .0001.
Adjusted Results
After adjusting for local area and dentist characteristics, the expected number of Medicaid patients a dentist treats varied substantially (Figure 1). For context, the mean number of Medicaid patients in our sample was 137 per year. Dentists affiliated with FQHCs treated about 50 more pediatric Medicaid patients (p < .01) compared with dentists not working for an FQHC (Table 2). Compared with GP dentists, pediatric dentists had a substantially higher expected number of Medicaid patients. Relative to dentists in non-poverty zip codes, dentists in zip codes where the poverty rate is at or above 20% were expected to have about 77 more Medicaid patients (p < .01). Compared with practices with one or two dentists, dentists in practices with 11 or more dentists had about 163 more Medicaid patients in a given year (p < .01). Rural dentists had about 132 more Medicaid patients compared with urban dentists (p < .01). Dentists in areas with a lower number of dentists per capita or lower median household income were expected to have a higher number of pediatric Medicaid patients. For each US$1,000 increase in median household income, dentists were expected to have about three fewer Medicaid patients in a given year.
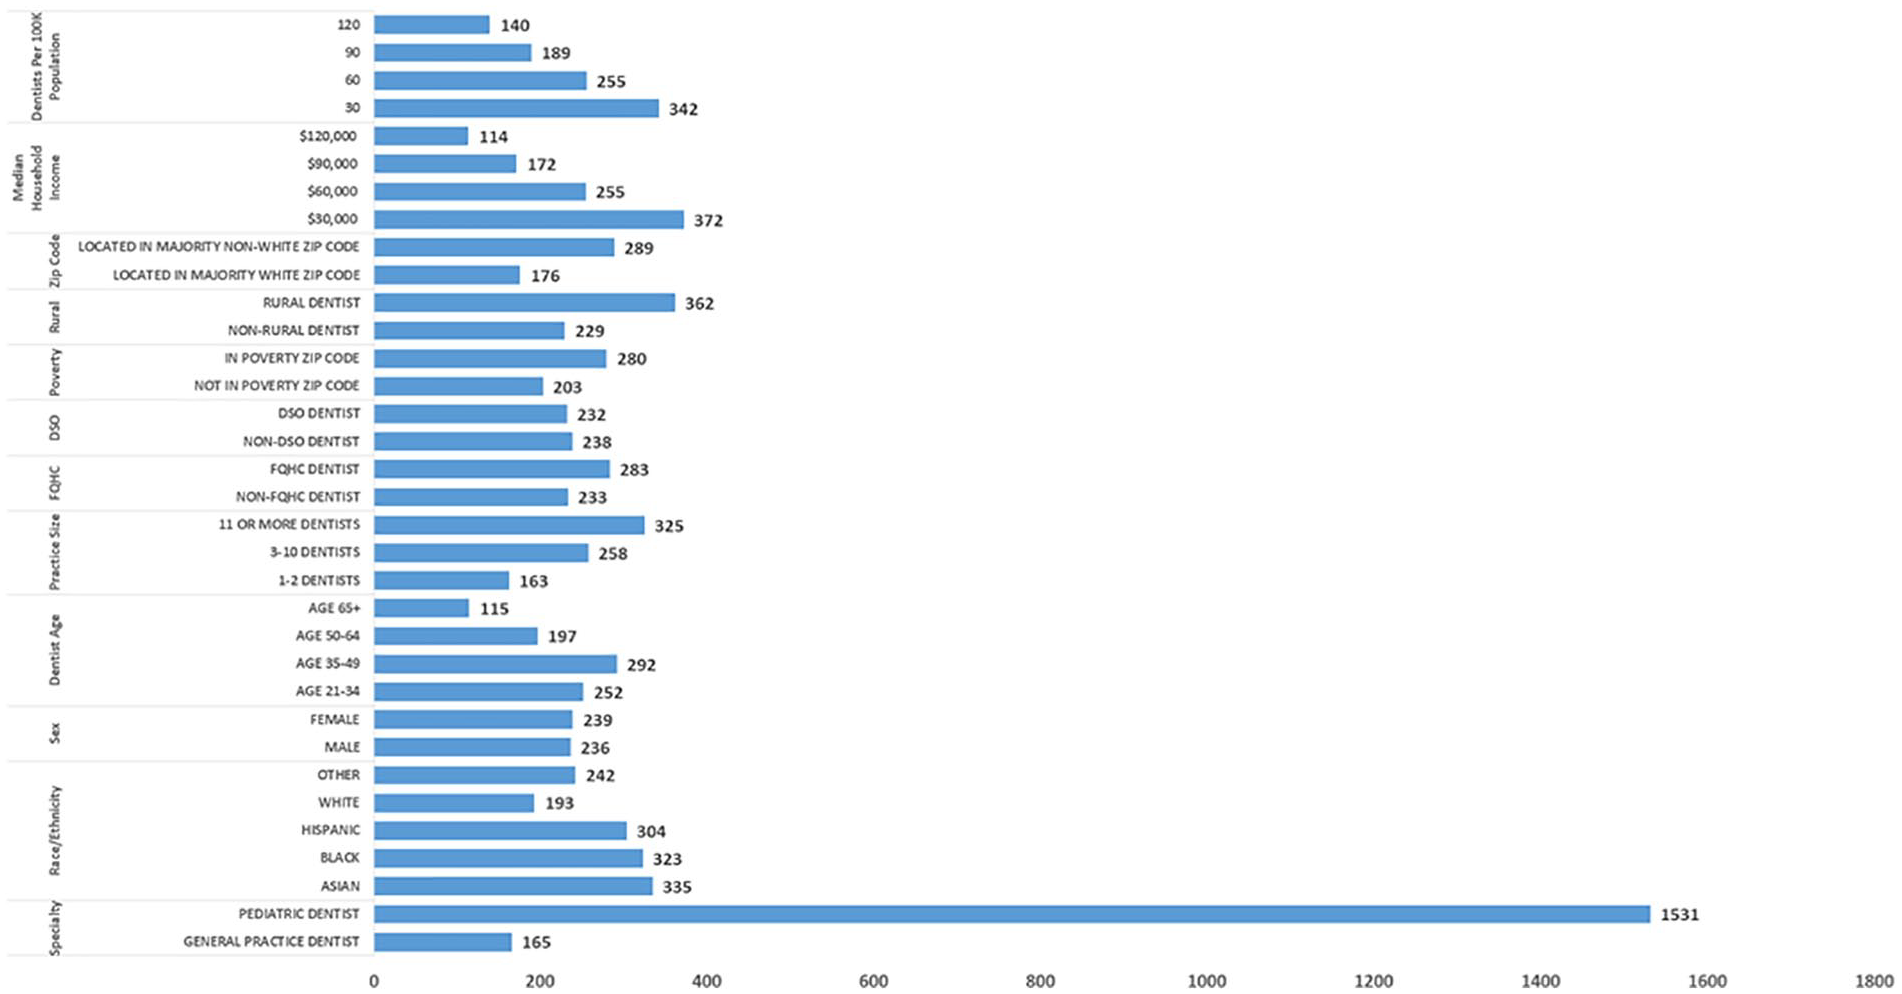
Expected Number of Medicaid Patients in Calendar Year After Adjusting for Dentist and Local Areal Characteristics.
Exponential Hurdle Model, Average Marginal Effects: Total Number of Medicaid Patients.
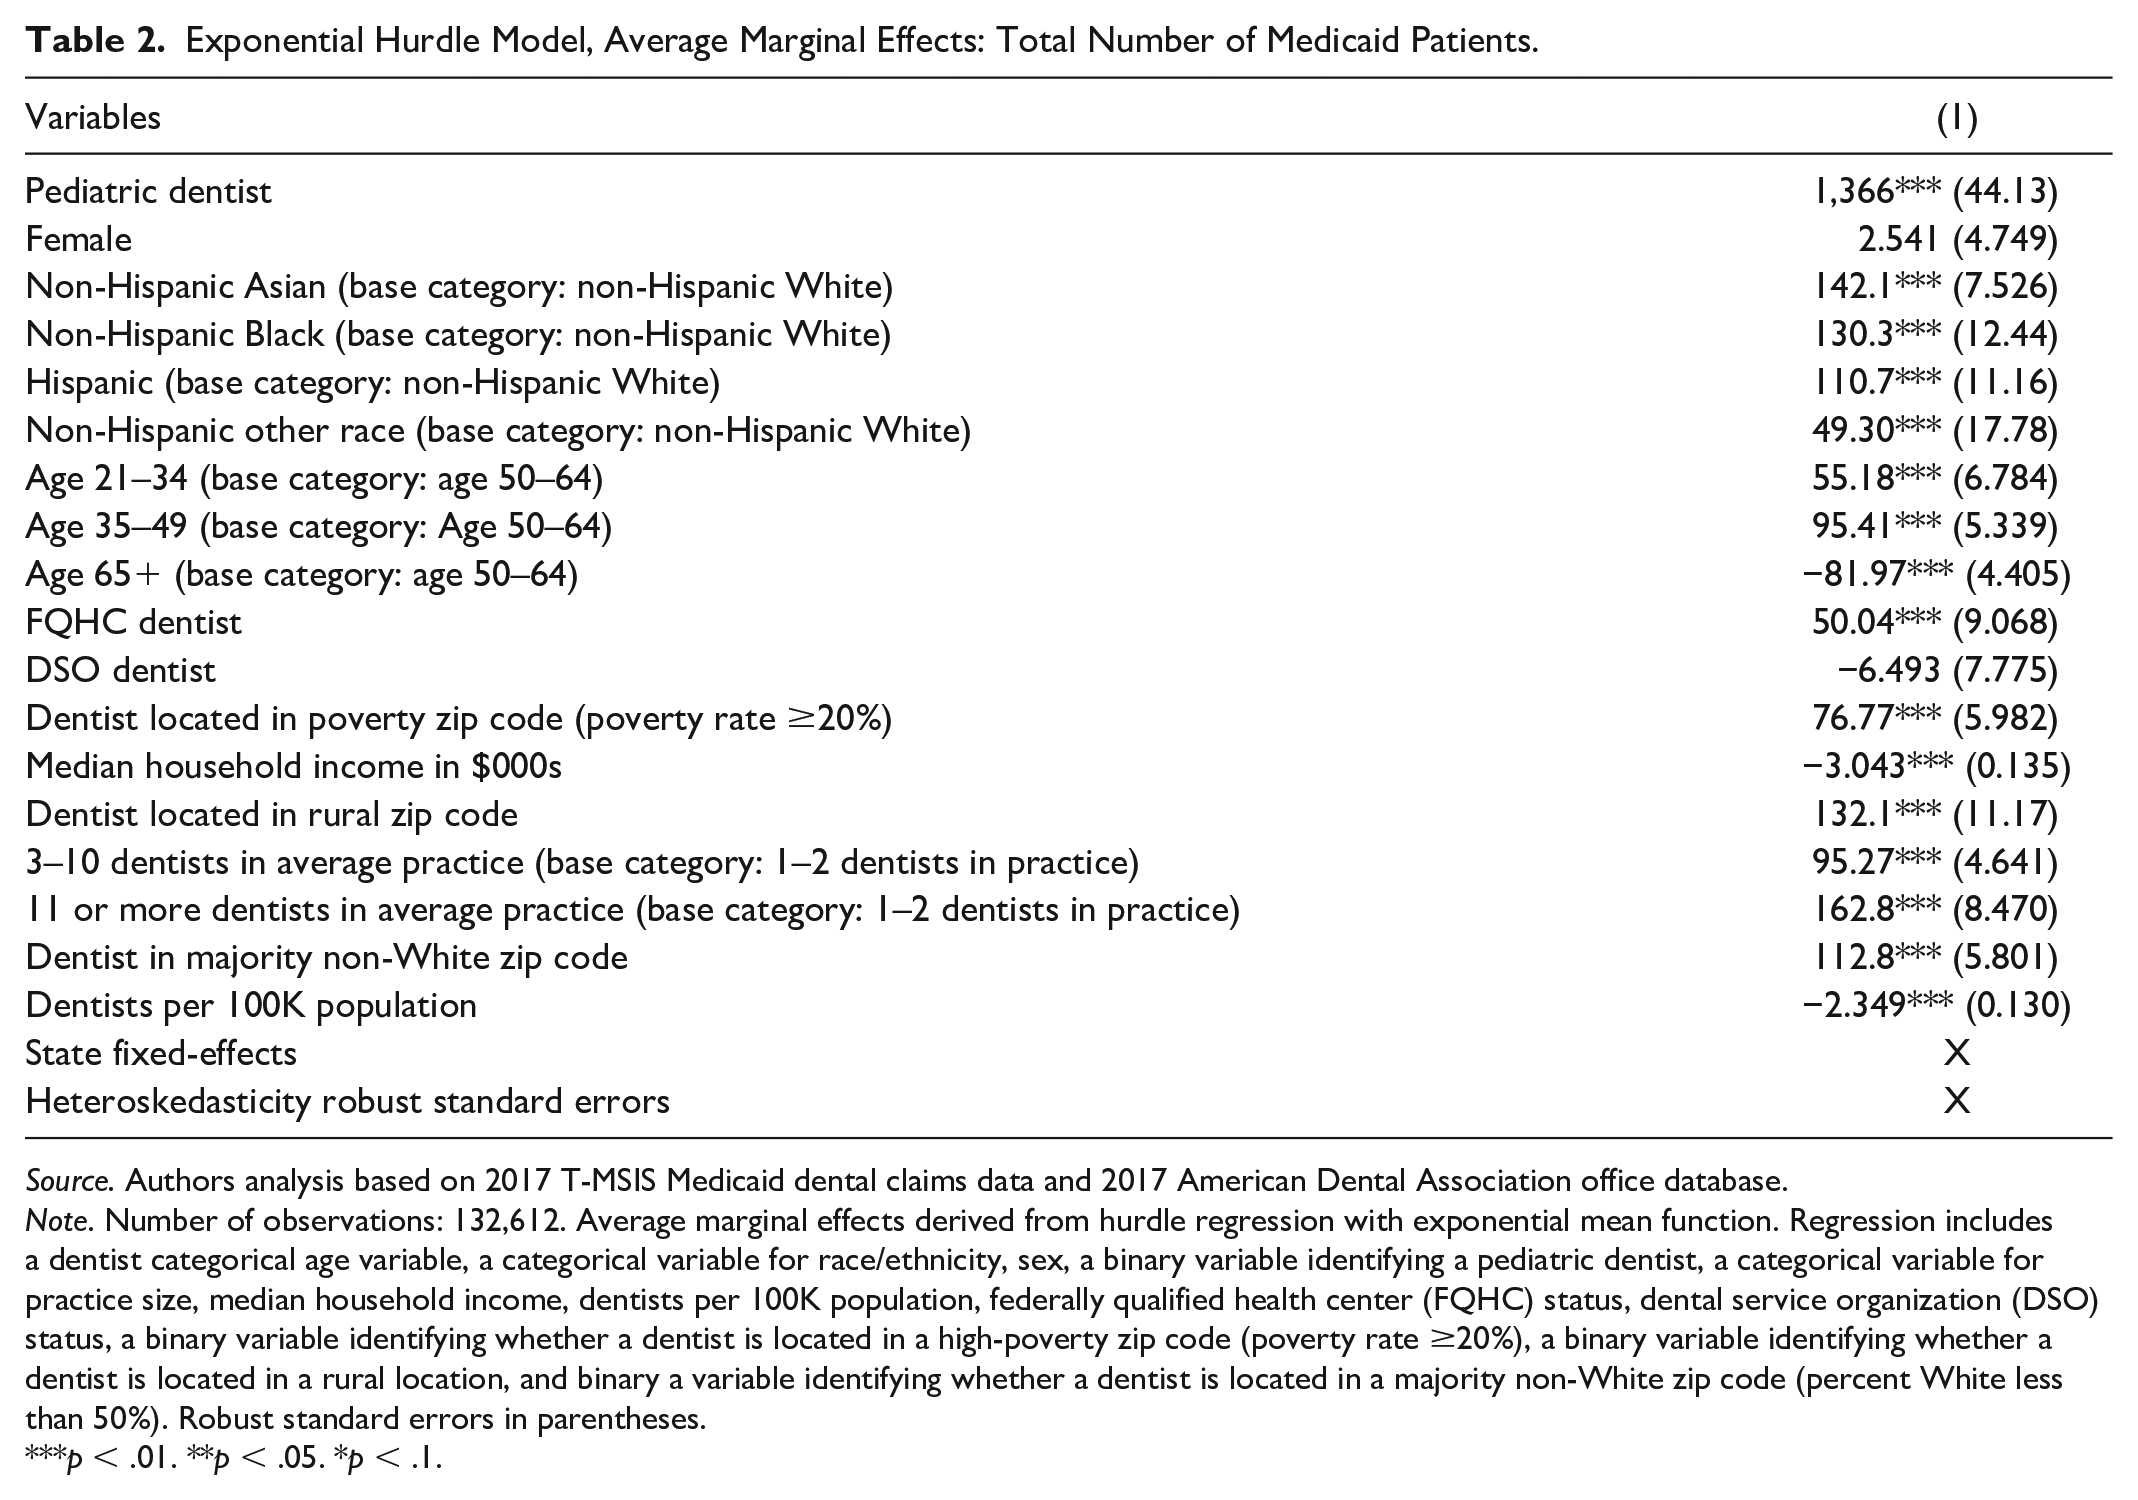
Source. Authors analysis based on 2017 T-MSIS Medicaid dental claims data and 2017 American Dental Association office database.
Note. Number of observations: 132,612. Average marginal effects derived from hurdle regression with exponential mean function. Regression includes a dentist categorical age variable, a categorical variable for race/ethnicity, sex, a binary variable identifying a pediatric dentist, a categorical variable for practice size, median household income, dentists per 100K population, federally qualified health center (FQHC) status, dental service organization (DSO) status, a binary variable identifying whether a dentist is located in a high-poverty zip code (poverty rate ≥20%), a binary variable identifying whether a dentist is located in a rural location, and binary a variable identifying whether a dentist is located in a majority non-White zip code (percent White less than 50%). Robust standard errors in parentheses.
p < .01. **p < .05. *p < .1.
Dentist Medicaid Participation by Provider Race/Ethnicity
Compared with non-Hispanic White dentists, non-Hispanic Black dentists treated about 130 more Medicaid patients (p < .01) (Table 2, Column 1). Hispanic (average marginal effect = 111, p < .01) and non-Hispanic Asian (average marginal effect = 142) dentists were also expected to have more Medicaid patients compared with non-Hispanic White dentists. Dentists located in majority non-White zip codes were expected to have about 289 Medicaid patients compared with 176 for dentists located in majority-White zip codes (Figure 1) (average marginal effect = 113, p < .01).
By dentist race/ethnicity, the effect of dentists locating in majority non-White zip codes on participation in Medicaid differed (Figure 2). Among White dentists, the estimated marginal effect of locating in a majority non-White zip code on the expected number of Medicaid patients was significantly lower than for Black dentists. When non-Hispanic White dentists located in majority non-White zip codes, they were expected to have 97 more Medicaid patients (95% confidence interval: [87.3, 107.4]) compared with non-Hispanic White dentists in majority-White zip codes. When non-Hispanic Black dentists located in majority non-White zip codes, they were expected to have about 144 more Medicaid patients compared with Black dentists in majority-White zip codes (95% confidence interval: [125.76, 161.28]). Non-Hispanic Asian dentists located in majority non-White zip codes were also expected to have a higher number of Medicaid patients compared with non-Hispanic Asian dentists in majority-White zip codes (average marginal effect = 152; 95% confidence interval: [134.9, 168.6]).
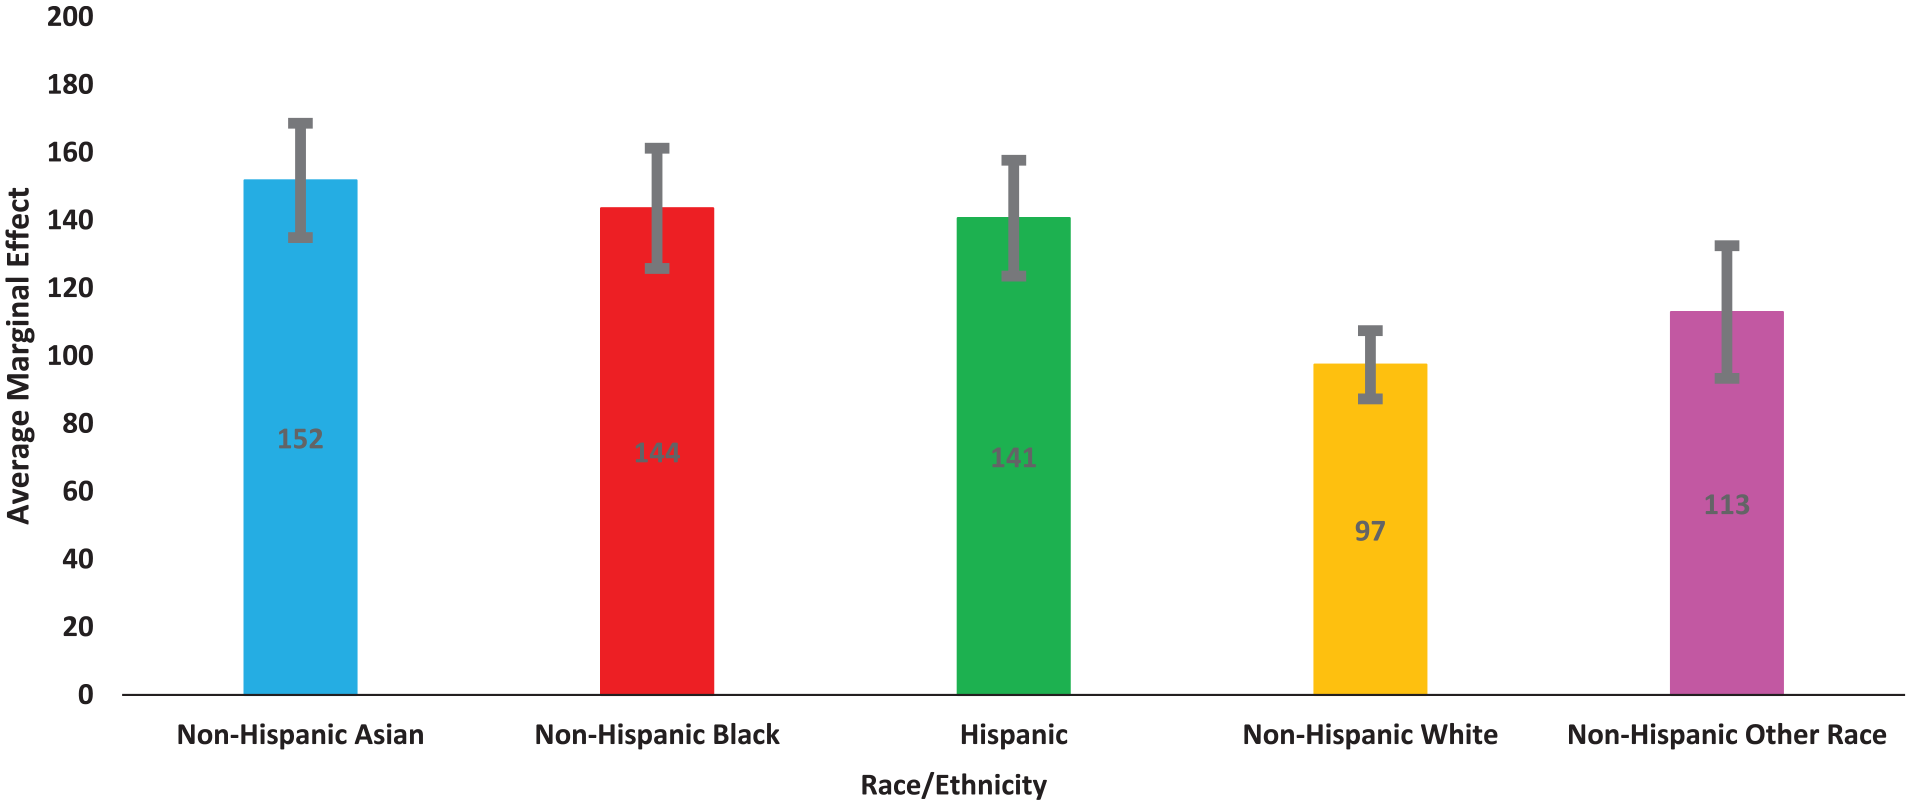
Average Marginal Effect (Difference in Expected Number of Medicaid Patients) of Dentist Locating in a Majority Non-White Zip Code by Race/Ethnicity.
Discussion
Our analysis shows that dentists who treat more Medicaid patients are more likely to be Black, Hispanic, or Asian; locate in a majority non-White zip code, a rural area, or high-poverty zip code; work in larger practices; and are more likely to be affiliated with an FQHC. Dentists in high-income areas or urban locations have fewer Medicaid patients. About 33% of dentists treat at least one Medicaid patient, which is lower than the national estimate of 43% based on data from IKN (ADA, 2020b). This should not be surprising as the data from IKN are based on whether a dentist enrolls in Medicaid or CHIP, not whether a dentist actually treats Medicaid patients or submits claims to Medicaid.
Our findings are consistent with previous research which examined provider participation in Medicaid for medical services (Spivack et al., 2021). Like this previous study, we found that dentists in rural areas or in areas with lower median household income are more likely to have a higher number of Medicaid patients. This may be because dentists in these areas may not have access to a sufficient self-pay or privately insured patient base to remain profitable, making these dentists more inclined to treat Medicaid patients. Larger practices, many of which may be affiliated with DSOs, have a higher Medicaid patient count, which is also consistent with previous research (Spivack et al., 2021). This could be due to larger practices having the resources and infrastructure in place to treat Medicaid patients efficiently, especially because there are higher administrative burdens when dealing with Medicaid as opposed to private insurance (Gottlieb et al., 2018). Our results are also consistent with another national study that examined Medicaid dentist participation using data from IKN (Nasseh & Vujicic, 2017) which found that Black, rural, or pediatric dentists are more likely to participate in Medicaid.
Our study also indicates there are substantial racial and ethnic differences in dentist participation in Medicaid, even after controlling for other factors. White dentists compared with Black, Hispanic, or Asian dentists are less likely to participate in Medicaid. Previous research indicates that Black and Hispanic dentists provide care to a greater share of underserved populations than do White dentists (Mertz et al., 2017a, 2017b). Our analysis also suggests that even when White dentists locate in majority non-White zip codes, they are less inclined to treat Medicaid patients than dentists of other racial and ethnic backgrounds. As a result, our findings suggest that the relatively low percentage of dentists who are non-White (28.5 percent), especially the low share of Black dentists (3.8%), is an important factor limiting access to dental care for Medicaid and CHIP enrollees. It has been shown in the health care literature that greater racial concordance between providers and patients leads to better health outcomes, such as lower infant mortality among Black infants (Greenwood et al., 2020) and a reduction in the Black-White male cardiovascular mortality gap (Alsan et al., 2019). There is some research on patient preferences for racially concordant dentists (Mertz et al., 2016), but additional research should examine whether greater racial concordance between dentists and their patients leads to better oral health outcomes.
The results of our analysis should interest policymakers involved in developing strategies to further encourage dentists to treat patients enrolled in Medicaid or CHIP. Promoting growth within the segments of the dentist workforce that treat more Medicaid patients—dentists who are Black, Hispanic, or Asian, those that locate in rural areas—could create a more robust dental care safety net for low-income populations.
Conclusion
Policies that promote the racial/ethnic diversification and geographic distribution of the dentist workforce could lead to a more robust network of Medicaid providers. These efforts by policymakers may have a substantial impact on reducing barriers to dental care, particularly among low-income and minority populations. Efforts to make Medicaid more attractive to small dental practices and dentists in urban areas could also lower barriers to dental care.
Supplemental Material
sj-docx-1-mcr-10.1177_10775587221108751 – Supplemental material for Dentists Who Participate in Medicaid: Who They Are, Where They Locate, How They Practice
Supplemental material, sj-docx-1-mcr-10.1177_10775587221108751 for Dentists Who Participate in Medicaid: Who They Are, Where They Locate, How They Practice by Kamyar Nasseh, Chelsea Fosse and Marko Vujicic in Medical Care Research and Review
Footnotes
Declaration of Conflicting Interests
The author(s) declared no potential conflicts of interest with respect to the research, authorship, and/or publication of this article.
Funding
The author(s) received no financial support for the research, authorship, and/or publication of this article.
Supplemental Material
Supplemental material for this article is available online.
References
Supplementary Material
Please find the following supplemental material available below.
For Open Access articles published under a Creative Commons License, all supplemental material carries the same license as the article it is associated with.
For non-Open Access articles published, all supplemental material carries a non-exclusive license, and permission requests for re-use of supplemental material or any part of supplemental material shall be sent directly to the copyright owner as specified in the copyright notice associated with the article.