
Abstract
This study assessed whether permanent supportive housing (PSH) participation is associated with health service use among a population of adults with disabilities, including people transitioning into PSH from community and institutional settings. Our primary data sources were 2014 to 2018 secondary data from a PSH program in North Carolina linked to Medicaid claims. We used propensity score weighting to estimate the average treatment effect on the treated of PSH participation. All models were stratified by whether individuals were in institutional or community settings prior to PSH. In weighted analyses, among individuals who were institutionalized prior to PSH, PSH participation was associated with greater hospitalizations and emergency department (ED) visits and fewer primary care visits during the follow-up period, compared with similar individuals who largely remained institutionalized. Individuals who entered PSH from community settings did not have significantly different health service use from similar comparison group members during the 12-month follow-up period.
Keywords
Introduction
People with disabilities face significant barriers to living independently and stably in the community. Disability-related services are often unavailable in community-based settings, which can leave those with disabilities little choice but to reside in institutional settings where they can access needed services (U.S. Senate Health, 2013). In addition to poor service availability, people with disabilities can encounter structural impediments to remaining housed outside of institutional settings, including a lack of affordable housing with accessibility features and discrimination in the housing market (Aranda, 2015; Bo’sher et al., 2015; Schaak et al., n.d.). Likely due to these housing-related challenges, individuals with disabilities are estimated to comprise nearly one quarter (24%) of the adult unhoused population in the United States (U.S. Interagency Council on Homelessness, 2018).
Housing instability among those with disabilities can in turn have implications for health service access. For example, studies using general population samples show that people with unstable housing are more likely than stably housed individuals to lack a usual source of health care and postpone use of health care and medications that they need (Kushel et al., 2006; Reid et al., 2008). Unstably housed individuals also have greater rates of acute care use, including emergency department (ED) visits and hospitalizations (Kushel et al., 2006; Reid et al., 2008).
Permanent supportive housing (PSH) is an intervention with the potential to improve housing stability and health service access among people with disabilities. PSH programs offer participants affordable housing and tailored support services that can allow them to live independently in the community (Tabol et al., 2010). Many studies have evaluated the effect of PSH program participation among individuals with severe mental illnesses (SMIs) and/or substance use disorders (SUDs) who are chronically unhoused or at risk of becoming unhoused, generally finding that PSH programs can improve housing stability (Leff et al., 2009; Rog et al., 2014; Stergiopoulos et al., 2019; Tabol et al., 2010). Ample evidence also suggests that PSH participation may reduce acute health care use and spending among those with SMI or SUD (Gilmer et al., 2010; Hollander et al., 2021; Leff et al., 2009; Martinez & Burt, 2006; Rog et al., 2014; Tinland et al., 2020). Information on PSH effects on outpatient care use is limited, although two studies found that PSH participation was associated with greater use of outpatient mental health services among people with behavioral health needs (Gilmer et al., 2014; Raven et al., 2020). Little is known about how the PSH model affects the health service use of other populations of individuals with disabilities, such as those with intellectual or development disorders (IDDs) or physical disabilities. Some evidence suggests that PSH may reduce hospitalizations and ED visits among chronically unhoused individuals with HIV/AIDS or other chronic medical conditions, but we were unable to identify similar research not restricted to unhoused populations (Raven et al., 2020; Sadowski et al., 2009; Srebnik et al., 2013; Wolitski et al., 2010).
In particular, limited information is available on the health service outcomes of individuals entering PSH after being institutionalized, despite increasing use of supportive housing programs to transition people with disabilities from institutions to community settings (U.S. Department of Justice Civil Rights Division, n.d.). Qualitative evidence suggests that while PSH can offer greater stability for formerly unhoused populations with SMI relative to homelessness, formerly institutionalized individuals with SMI can experience less stability in PSH compared with institutional settings (Yanos et al., 2004). If this finding applies to people with disabilities entering PSH more broadly, formerly institutionalized PSH participants with disabilities may use less outpatient care and more acute care due to greater instability in their new housing placement relative to institutional settings.
New Contribution
This study assesses whether and how PSH participation impacts health service use among adults with disabilities, building on prior research examining the PSH experiences of specific subpopulations, including people who are chronically unhoused and/or who have behavioral health conditions. The study evaluates a PSH intervention that serves very low-income individuals in North Carolina who have some form of disability, including SMI, SUD, and other disability types not represented in the existing PSH literature (North Carolina Housing Finance Agency [NCHFA], n.d. -a). In contrast to PSH administered by the U.S. Department of Housing and Urban Development, participants are not required to be chronically homeless to be eligible and can enter the program from other community or institutional housing arrangements (U.S. Department of Housing and Urban Development, n.d.). Results from this study can inform policymakers about the potential implications of expanding PSH programs to serve populations beyond those traditionally included.
Method
Program Description
We studied a PSH program jointly administered by the North Carolina Department of Health and Human Services (NCDHHS) and the NCHFA. Program eligibility criteria are as follows: age of at least 18 years, disability as demonstrated by receipt of federal disability income, and a gross monthly income of at least US$300 but less than 50% of the area median income (NCHFA, n.d. -b). Participants can enter the program after being chronically unhoused or after living in an institution or living in the community (NCDHHS, personal communication, October 1, 2019). Because participants are not required to have a specific type of disability to qualify, the population served by the program includes individuals with SMI, SUD, physical disabilities, intellectual/developmental disabilities, and/or other severe chronic health conditions. We note, however, that the proportion of individuals in each disability category is not necessarily representative of the general North Carolina Medicaid population and may instead reflect state service priorities.
Potential program participants are identified and referred for eligibility assessment by partner agencies of NCDHHS, such as vocational rehabilitation and behavioral health services providers (NCDHHS, personal communication, October 1, 2019). If accepted, participants receive rental subsidies to ensure their monthly spending on rent and utilities does not exceed 30% of their household income. To enhance their ability to stay housed through the program, participants also receive tailored support services delivered by the referring disability service provider, such as case management services or rehabilitation counseling.
Data
We obtained 2014 to 2018 administrative data on the PSH program from NCDHHS and NCHFA. The housing program data contained information on the time period during which participants resided in a PSH unit. We also accessed 2014 to 2018 North Carolina Medicaid member files and professional, institutional, and pharmacy claims files available through The Carolina Cost and Quality Initiative (2019). These data contained information on the demographic characteristics, diagnosis codes, and health service use of adult Medicaid beneficiaries. The housing program data were linked to the Medicaid claims by the North Carolina Medicaid agency, the Division of Health Benefits (DHB), using participant’s first and last name, date of birth, and ZIP code. DHB linked 74% of the housing records to a Medicaid identifier, roughly consistent with the proportion of PSH participants enrolled in Medicaid. This study was determined to be exempt from review by the Institutional Review Board at The University of North Carolina at Chapel Hill.
Sample
We restricted our treatment group to individuals who began participating in the PSH program during 2015 to 2017 and who had 12 months with no prior participation in the program to create a baseline set of covariate measures. To define a potential comparison group of low-income adult Medicaid beneficiaries with disabilities, we identified individuals who received Supplemental Security Income (SSI) during at least 1 month in the study period. SSI is a cash benefit program for which individuals may be eligible if they have a low-income level and are aged, blind, or disabled (U.S. Social Security Administration). SSI eligibility criteria overlap with eligibility criteria for the PSH program we evaluated (described above), and receipt of SSI can satisfy the PSH program’s disability requirement, making SSI recipients an appropriate comparison group. To reduce the possibility that our comparison group included individuals who qualified for SSI receipt on the basis of age and not disability, we required that individuals aged 65 or older have diagnosis codes for at least one of a set of potentially disabling chronic conditions (described in detail under Measures). We randomly assigned potential comparison group members an index date analogous to the start of program participation for treatment group members by randomly drawing with replacement from the set of all PSH start dates (including duplicates) observed in the treatment group. The distribution of index dates in the comparison group matched the distribution in the treatment group.
To ensure that we had complete baseline health service use information, we required 6 months of continuous Medicaid enrollment prior to the index date for both treatment and comparison group members. We excluded comparison group members who did not receive SSI prior to their index date to ensure that they already had a potentially disabling condition at the time of their hypothetical treatment initiation. Only a small number of individuals had no Medicaid enrollment in the follow-up period (treatment group n < 11; comparison group n = 806), died during the index month (treatment group n < 11; comparison group n = 277), or, in the comparison group, entered the PSH program in the first follow-up period month (n < 11). We excluded these individuals from our sample. In calculating our outcomes over a 12-month follow-up period, we excluded any person-months that occurred after an individual’s death date, during which an individual did not have full Medicaid coverage, or in which treatment receipt occurred among the comparison group. Our final sample sizes prior to application of our statistical methods were 1,552 treatment group members and 221,373 potential comparison group members. Figure 1 provides additional detail about the number of individuals excluded at each stage of sample definition.
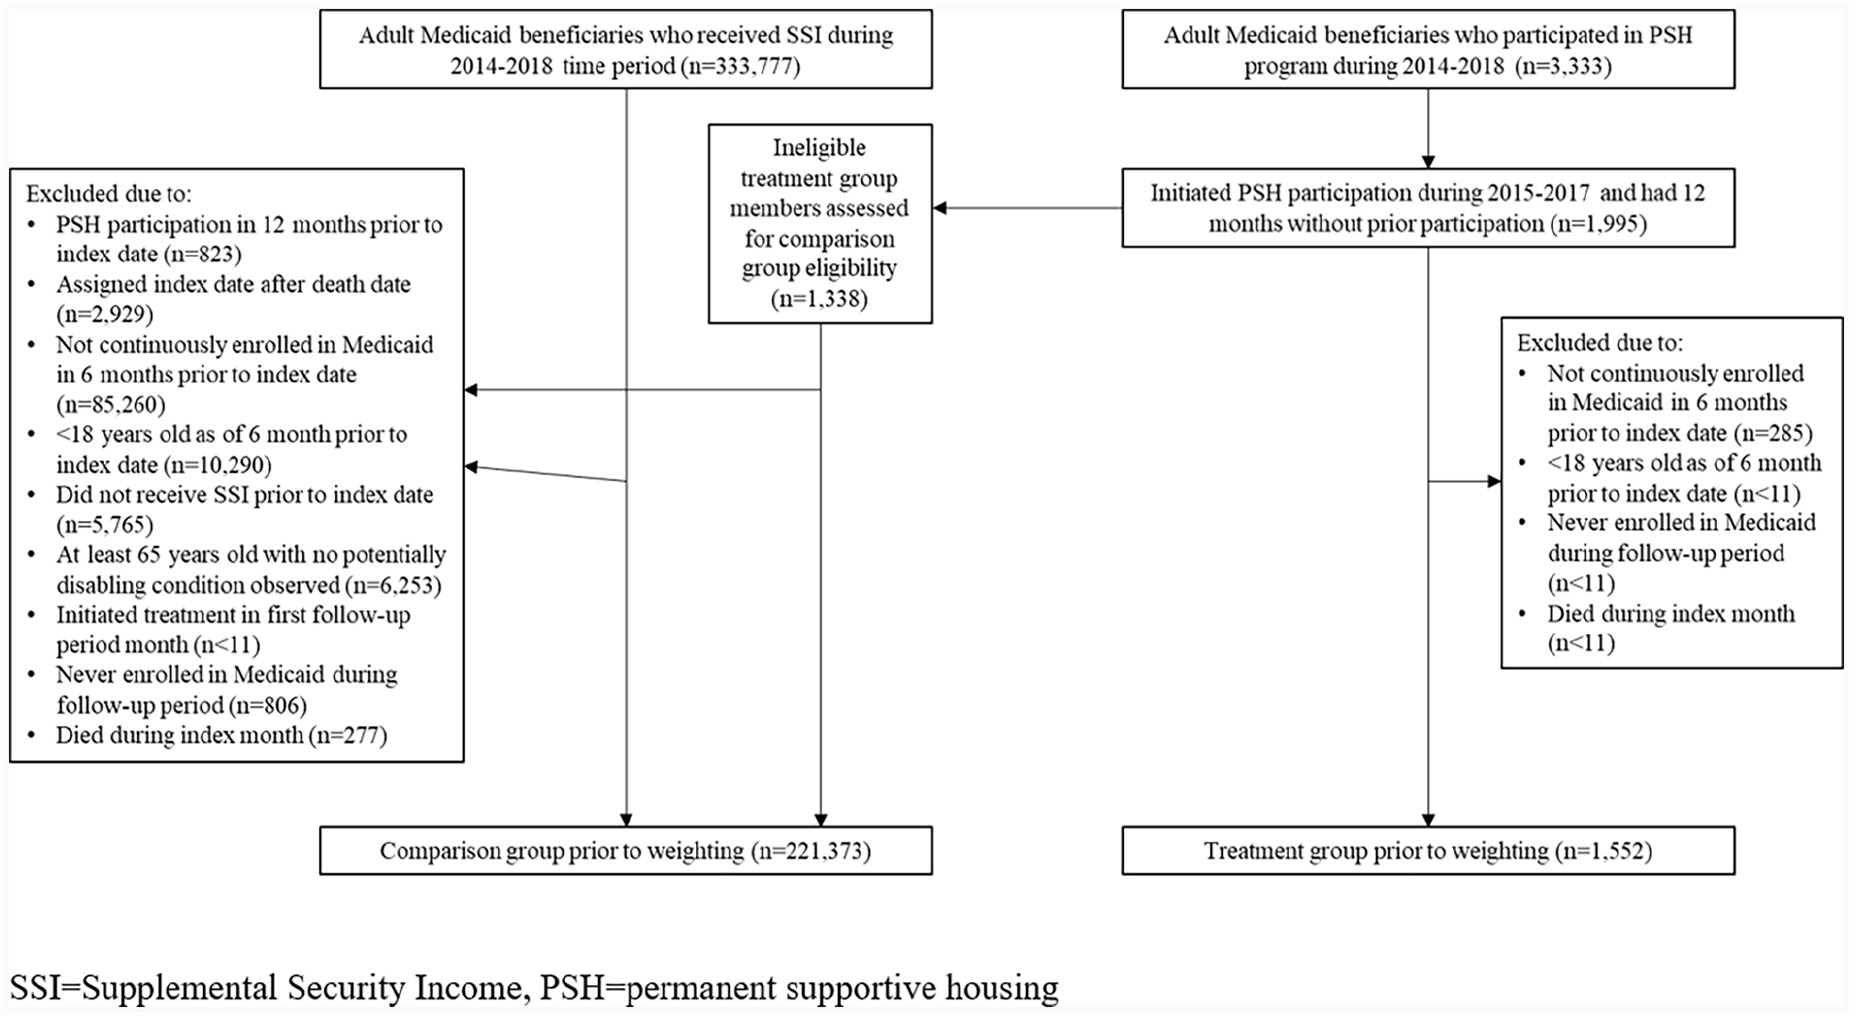
Sample Definition Prior to Analysis.
Statistical Methods
PSH program participants were not randomly assigned to treatment but instead opted into participation, creating the potential for confounding. We used average treatment effect on the treated (ATT) weighting to account for potential confounding due to systematic differences in observable characteristics between the treatment and comparison groups. To implement the ATT weighting approach, we first restricted our potential comparison group to individuals whose covariate values were within the range of values among treatment group members, to prune untreated units outside the region of positivity for each covariate (Westreich & Cole, 2010). Individuals could enter the PSH program from a community setting (housed or unhoused) or an institution. We anticipated that associations between PSH participation and health service use could vary based on how individuals entered the PSH program. Specifically, those coming from an institutional setting, in which participants may have had stable access to routine health care, were in a different situation than those residing in a community setting prior to PSH use. To better account for these differences, we stratified by whether individuals were institutionalized during at least half of the 6 months preceding the index date, calculating separate ATT weights for each subgroup.
To calculate the weights, we fit logistic regression models predicting treatment assignment as a function of participant demographic characteristics, chronic condition diagnoses, health service in the 1 to 3 and 4 to 6 months prior to the index date, and living arrangement in the 6 months prior to the index date, including quadratic and interaction terms when necessary to improve covariate balance. Additional details on all weighting variables are provided under Measures. Weighting equation regression results are provided in Supplemental Appendix 1. We set the ATT weights to 1 among the treatment group and the odds of treatment (i.e., the propensity score divided by 1 minus the propensity score) among the comparison group, excluding comparison group members whose estimated propensity score was outside the region of common support with the treatment group. A small number of treatment group members (n < 11) had propensity scores outside the region of common support. Despite potential violation of the positivity assumption, we retained these units so that our results generalize to the full treatment group.
We checked the balance between the weighted treatment and comparison groups by assessing the standardized absolute mean differences, or the absolute value of the difference in means between the two groups divided by the standard deviation (SD) in the treatment group (×100), for all covariates (Stuart, 2010). We considered a covariate to be balanced between groups if its standardized absolute mean difference (expressed as a percentage) was less than 10. We also generated quantile-quantile plots to check the balance between groups throughout the distribution of the covariates (Linden, 2014), shown in Supplemental Appendix 2.
After ensuring that we achieved appropriate balance between the two groups, we ran weighted outcome models, using zero-inflated negative binomial (ZINB) models for count outcomes and ordinary least squares for a continuous outcome. ZINB models are useful in situations where some observations in overdispersed count data are structurally unable to have a non-zero value of the outcome (e.g., individuals who cannot access health care), leading to an excess of zeroes in the distribution; the model accounts for this by separately estimating the zero inflation and count processes (Yau et al., 2003). We compared the fit of the ZINB specification to standard negative binomial models using the Akaike information criterion (AIC) and found that the ZINB models yielded a lower AIC in most models and were thus preferred. We also compared the ZINB specification with zero-inflated Poisson (ZIP) regression using a likelihood ratio test of the null hypothesis that the negative binomial dispersion parameter is equal to 0. Because the null hypothesis was rejected in the majority of models, we concluded that ZINB specification better fit the data than the ZIP specification. In all models (including both the zero inflation and count models in the ZINB models), our explanatory variables included the treatment indicator, demographic characteristics, chronic condition type indicators, baseline health service use measures, and baseline living arrangement. We also included a set of indicators for the quarter of the index date to address any imbalance between the groups in index date distribution introduced by weighting. In both the weighting equation and outcome models, we included a quadratic term for age to allow for a nonlinear relationship between age and treatment assignment and between age and the outcome variables. We also examined the feasibility of running the models separately for individuals above and below 65 years of age since program effects could differ for these subgroups, but because only 5.9% of treatment group members were above age 65, we concluded that stratified analyses would be likely be underpowered.
We retrieved average marginal effects (AMEs) and predicted means with 95% confidence intervals (CIs). We applied a Benjamini-Hochberg correction to p values to account for the multiple hypothesis tests conducted, controlling for a false discovery rate of 5% (Benjamini & Hochberg, 1995). As a robustness check, we performed analyses in which we restricted our analytic sample to individuals who contributed 12 months of data during the study follow-up period (e.g., excluding individuals who were not continuously enrolled in Medicaid during the 12-month follow-up period). This allowed us to capture all outcomes but introduces selection.
Measures
We computed all health service use outcomes in the 12 months following the index date for each individual, using the actual PSH program start date for treatment group members and the randomly assigned index date for comparison group members. Consistent with an intent-to-treat approach, we included all observable follow-up months in our calculations for treatment group members regardless of whether they exited the program during the 12-month follow-up period. All outcomes pertain to Medicaid-paid services. Our acute care use outcomes included number of inpatient stays, number of days in an inpatient setting, and number of ED visits, all defined using revenue codes in facility claims. Our outpatient care use outcomes included number of primary care visits, defined using Current Procedure Terminology (CPT) codes in professional claims and rendering provider specialty taxonomy as listed in the Centers for Medicare & Medicaid Services National Plan and Provider Enumeration System (NPPES) database (Centers for Medicare and Medicaid Services, 2018), and mean monthly proportion of days covered (PDC) for antihypertensive medications, defined using drug therapeutic class codes in pharmacy claims. We assessed adherence to antihypertensive medications because hypertension was the most common comorbidity observed in our sample, and use of pharmacological interventions is indicated to manage hypertension among people with cardiovascular disease (Carey & Whelton, 2018). As we could not observe pharmacy claims for individuals dually enrolled in Medicare, we only assessed this outcome among individuals with diagnosis codes for hypertension who were never dual-eligible during the 6-month baseline period and using person-months not enrolled in Medicare (31% of the original sample). We re-estimated the ATT weights for this subsample and checked covariate balance using standardized absolute mean differences.
We also calculated baseline values for the health service use measures, generating separate measures for 1 to 3 months and 4 to 6 months prior to the index date to address any variation within the 6-month baseline period. We included all the health service use variables (except antihypertensive PDC) in our weighting and outcomes models to control for differences in pretreatment health service use between the groups. We included both number of inpatient stays and inpatient days in our weighting model to capture both frequency and intensity of acute care use. Our demographic characteristics included a continuous measure of age and categorical measures of self-reported race/ethnicity (classified as non-Hispanic White, non-Hispanic Black, Hispanic, or other) and a binary measure of self-reported gender. We accounted for the level of rurality of the area in which a person lived at the start of the follow-up period using the 2010 Rural-Urban Commuting Area (RUCA) code associated with their five-digit ZIP code in the index month (U.S. Department of Agriculture Economic Research Service, n.d.). We classified ZIP codes as metropolitan, micropolitan, small town, and isolated areas using the RUCA codes. We also generated a binary indicator of whether an individual was ever dual-eligible in the 6 months prior to the index date to account for any differences in our ability to observe complete health service use information due to Medicare coverage.
We ideally would have controlled for the disabling condition that made individuals eligible for the PSH program or SSI receipt, but we were unable to observe this information in the available data. We instead created indicators for a set of potentially disabling chronic conditions using definitions adapted from the Healthcare Cost and Utilization Project (HCUP, n.d.) Clinical Classifications Software (CCS) for ICD-9 and ICD-10. We identified relevant HCUP CCS categories corresponding to the categories of condition types that could qualify an individual for participation in the PSH program: intellectual and developmental disorders, SMI (i.e., major depressive disorders, bipolar disorders, or psychotic disorders), SUD, physical conditions (Khoury et al., 2013), and other severe chronic conditions (Grove et al., 2022). We required that an individual receives ICD-9 or ICD-10 diagnosis codes on two distinct dates for a given condition at any point prior to their index date to have the corresponding chronic condition code (full set of ICD codes available upon request). In addition to the potentially disabling conditions identified, we also included indicators for three other common comorbidities (hypertension, hyperlipidemia, and asthma) to better control for case mix. We included indicators for each condition in our weighting equation and controlled for the five broad condition types in our outcome analysis.
For each of the 6 months prior to the index date, we classified individuals as institutionalized in a given month if for at least half the month they had: a living arrangement code in the Medicaid enrollment file associated with institutionalization (e.g., residence in an adult living facility or psychiatric facility), room and board revenue codes for a stay in a nursing facility or intermediate care facility, room and board revenue codes for an inpatient stay, or professional claims charges for personal care services delivered in an adult living facility. We were interested in long-term residents of institutions so we required that the number of institutionalized days take up at least half of a given month to exclude short-term stays. We included the total number of months institutionalized during the 6-month baseline period as a covariate in our weighting and outcome models.
Results
Sample Characteristics
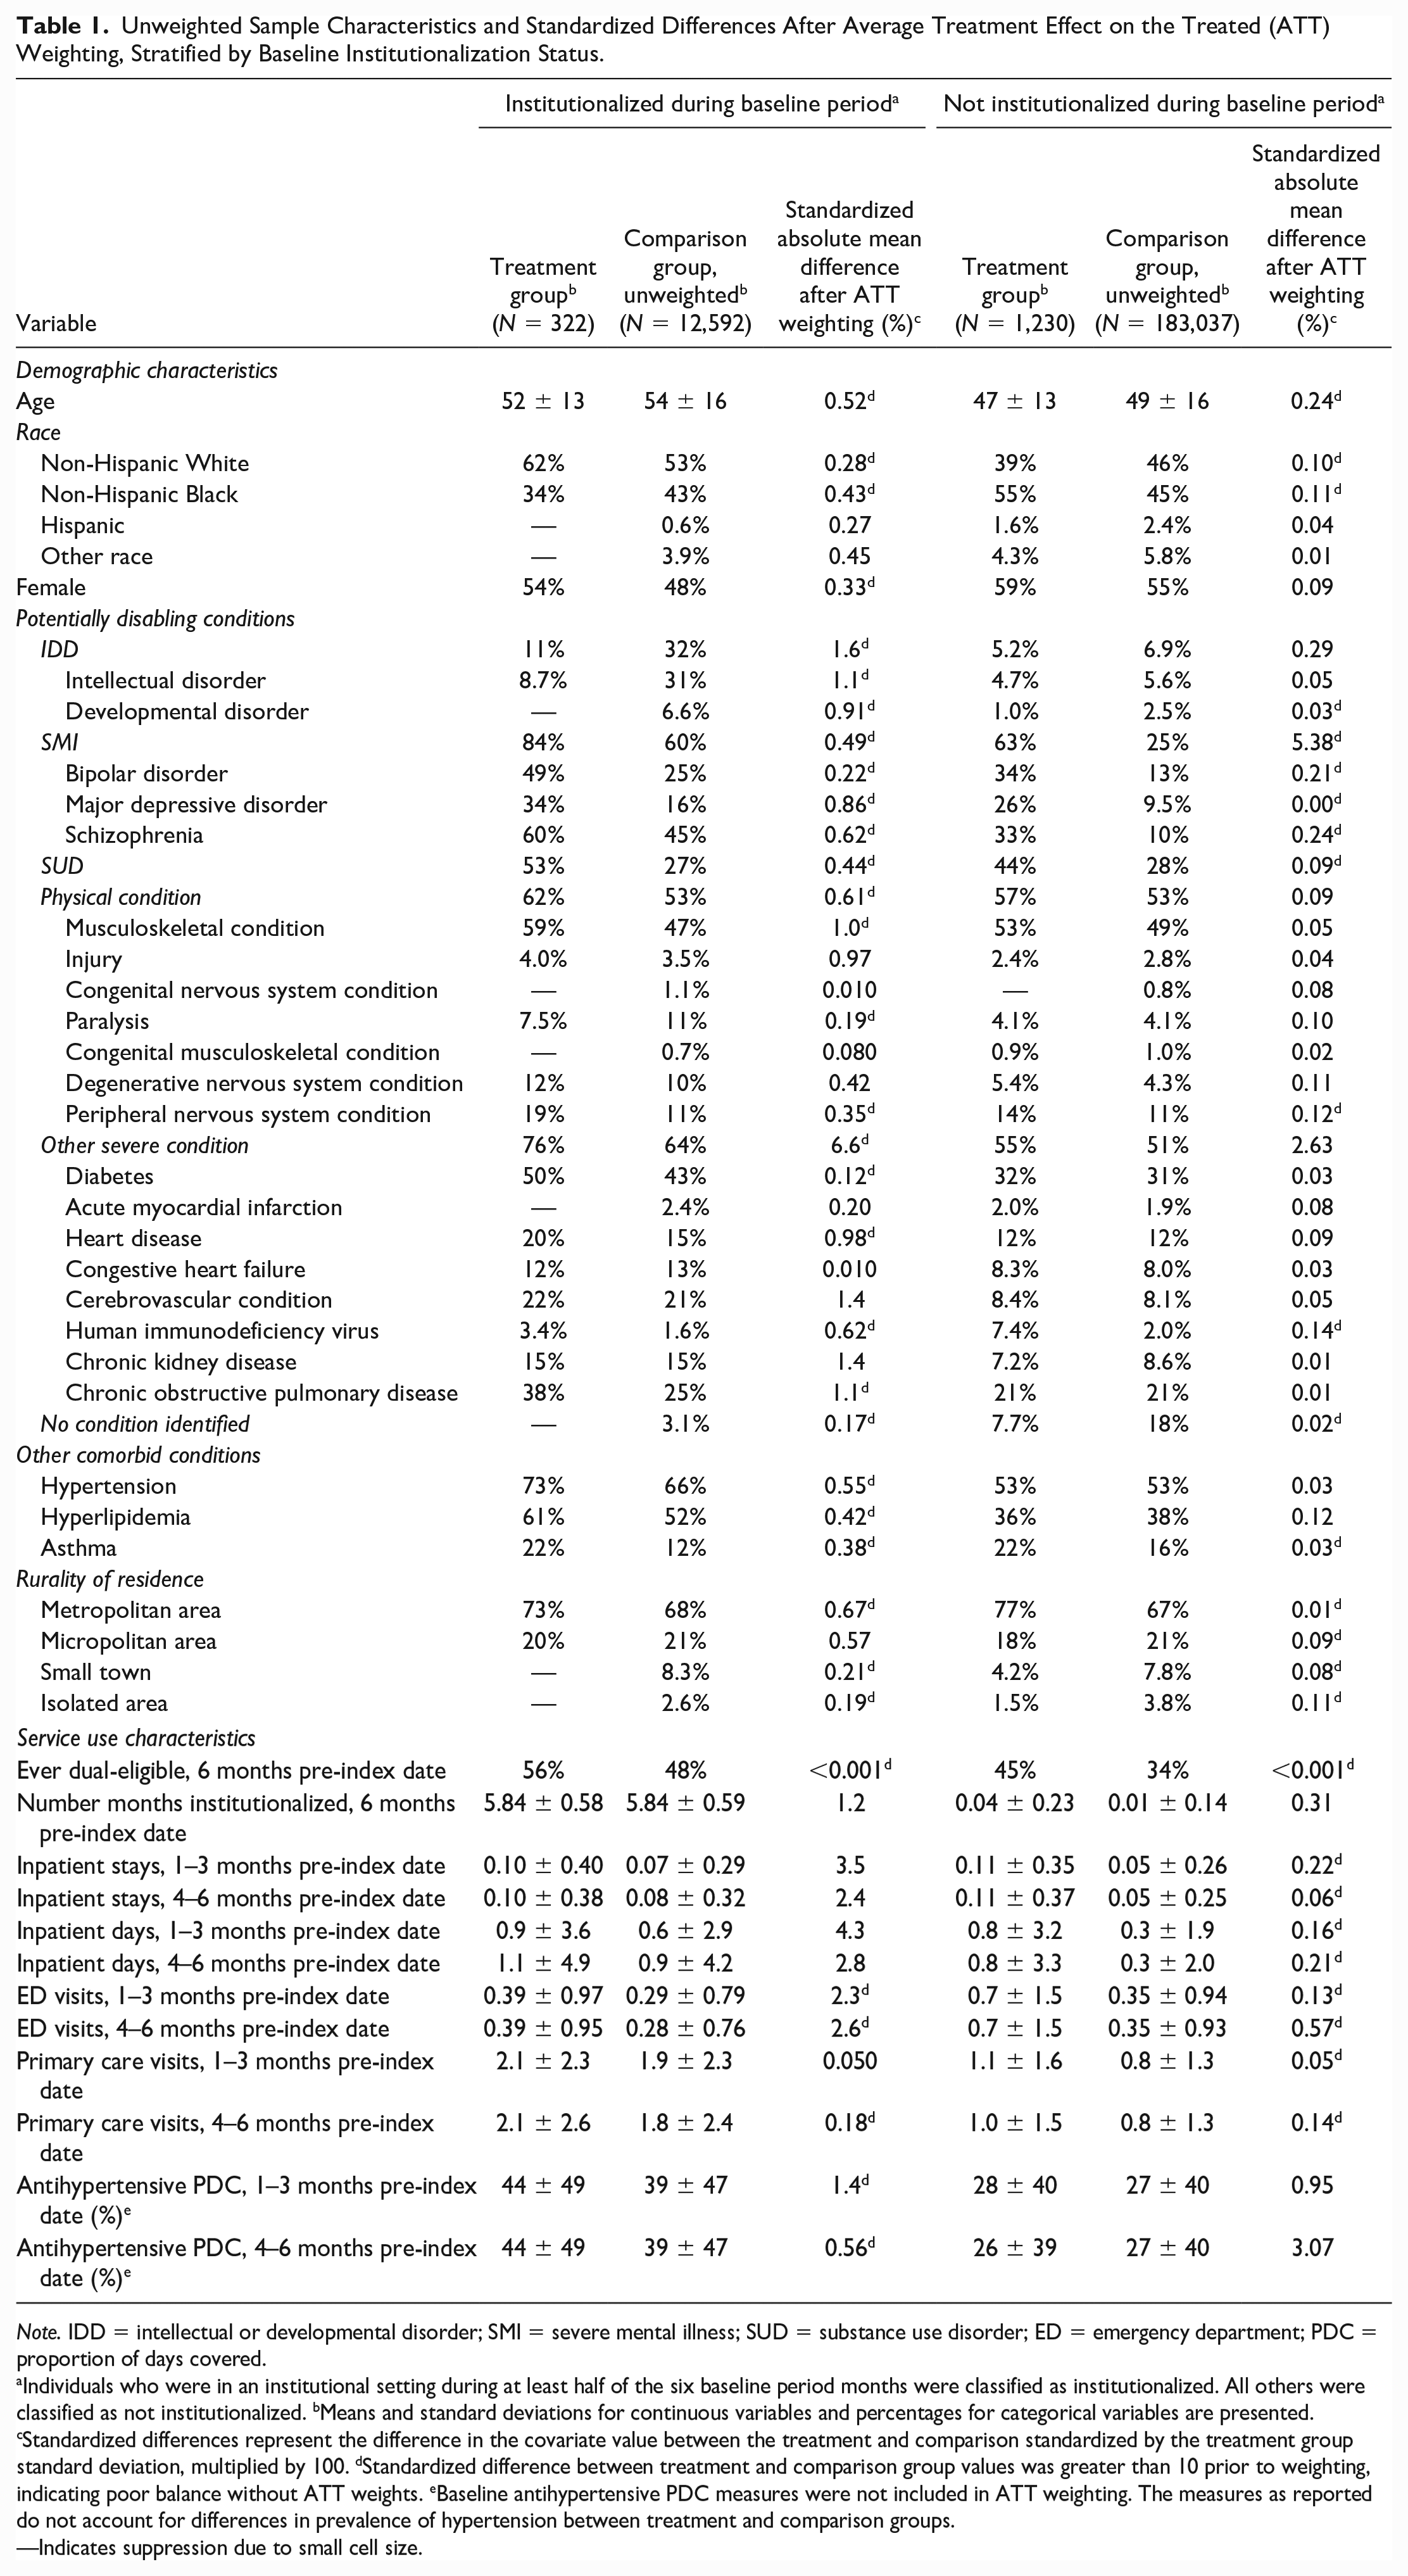
We identified 322 treatment group members who were institutionalized and 1,230 treatment group members who were not institutionalized during the baseline period, along with 14,559 institutionalized comparison group members (1,967 of whom were excluded due to nonoverlapping propensity scores) and 186,014 noninstitutionalized comparison group members (2,977 of whom were excluded due to nonoverlapping propensity scores). Institutionalized treatment group members had a mean age of 52 (SD = 13) and were predominantly non-Hispanic White (62%) and female (54%) (Table 1). Prior to weighting, institutionalized comparison group members had a mean age of 54 (SD = 16) and were mostly non-Hispanic White (53%) and male (52%). A majority of both institutionalized treatment group and unweighted comparison group members had diagnosis codes for SMI (84% and 60%, respectively), physical conditions (62% and 53%), or other severe conditions (76% and 64%). Institutionalized treatment group members had higher mean baseline health service use than unweighted comparison group members.
Unweighted Sample Characteristics and Standardized Differences After Average Treatment Effect on the Treated (ATT) Weighting, Stratified by Baseline Institutionalization Status.
Note. IDD = intellectual or developmental disorder; SMI = severe mental illness; SUD = substance use disorder; ED = emergency department; PDC = proportion of days covered.
Individuals who were in an institutional setting during at least half of the six baseline period months were classified as institutionalized. All others were classified as not institutionalized. bMeans and standard deviations for continuous variables and percentages for categorical variables are presented. cStandardized differences represent the difference in the covariate value between the treatment and comparison standardized by the treatment group standard deviation, multiplied by 100. dStandardized difference between treatment and comparison group values was greater than 10 prior to weighting, indicating poor balance without ATT weights. eBaseline antihypertensive PDC measures were not included in ATT weighting. The measures as reported do not account for differences in prevalence of hypertension between treatment and comparison groups.
—Indicates suppression due to small cell size.
Noninstitutionalized treatment group members had a mean age of 47 (SD = 13) and were predominantly non-Hispanic Black (55%), while prior to application of the ATT weights, noninstitutionalized comparison group members had a mean age of 49 (SD = 16) and were predominantly non-Hispanic White (46%). A majority of both noninstitutionalized treatment group and unweighted comparison group members identified as female. SMI was the most common type of potentially disabling condition among the noninstitutionalized treatment group (63%), and physical condition diagnosis codes were the most prevalent type among the noninstitutionalized comparison group prior to weighting (53%). Noninstitutionalized treatment group members had higher mean baseline use of inpatient care, ED visits, and primary care visits, relative to unweighted comparison group members. After ATT weighting, all standardized differences between the comparison and treatment groups were far lower than the commonly accepted threshold of 10, indicating that the weighting effectively balanced the characteristics of the groups at the means (Austin & Stuart, 2015). The quantile-quantile plots also revealed acceptable balance throughout the distribution of the continuous covariates (not shown). After weighting, 92% of both institutionalized treatment and comparison group members were institutionalized during all 6 months of the baseline period (not shown).
Table 2 shows unweighted health service use during the 12-month follow-up period for treatment and comparison group members. Treatment group members who were institutionalized during the baseline period had greater prevalence of inpatient use than institutionalized comparison group members prior to weighting (31% vs. 21%, p < .001) and a higher mean number of ED visits (2.6 vs. 1.1, p < .001) during the follow-up period, while unweighted comparison group members who were institutionalized during the baseline period had a higher mean number of primary care visits (7.5 among the unweighted comparison group vs. 5.3 among the treatment group, p < .001). Compared with the unweighted comparison group, treatment group members not institutionalized during the baseline period were also more likely to use inpatient care (18% of treatment group members vs. 15% of comparison group members, p = .001) and had higher mean numbers of ED visits (2.3 vs. 1.3, p < .001) and primary care visits (3.9 vs. 3.1, p < .001) in the 12 months following their index date.
Unadjusted Health Service Use During 12-Month Follow-Up Period, Stratified by Baseline Institutionalization Status.
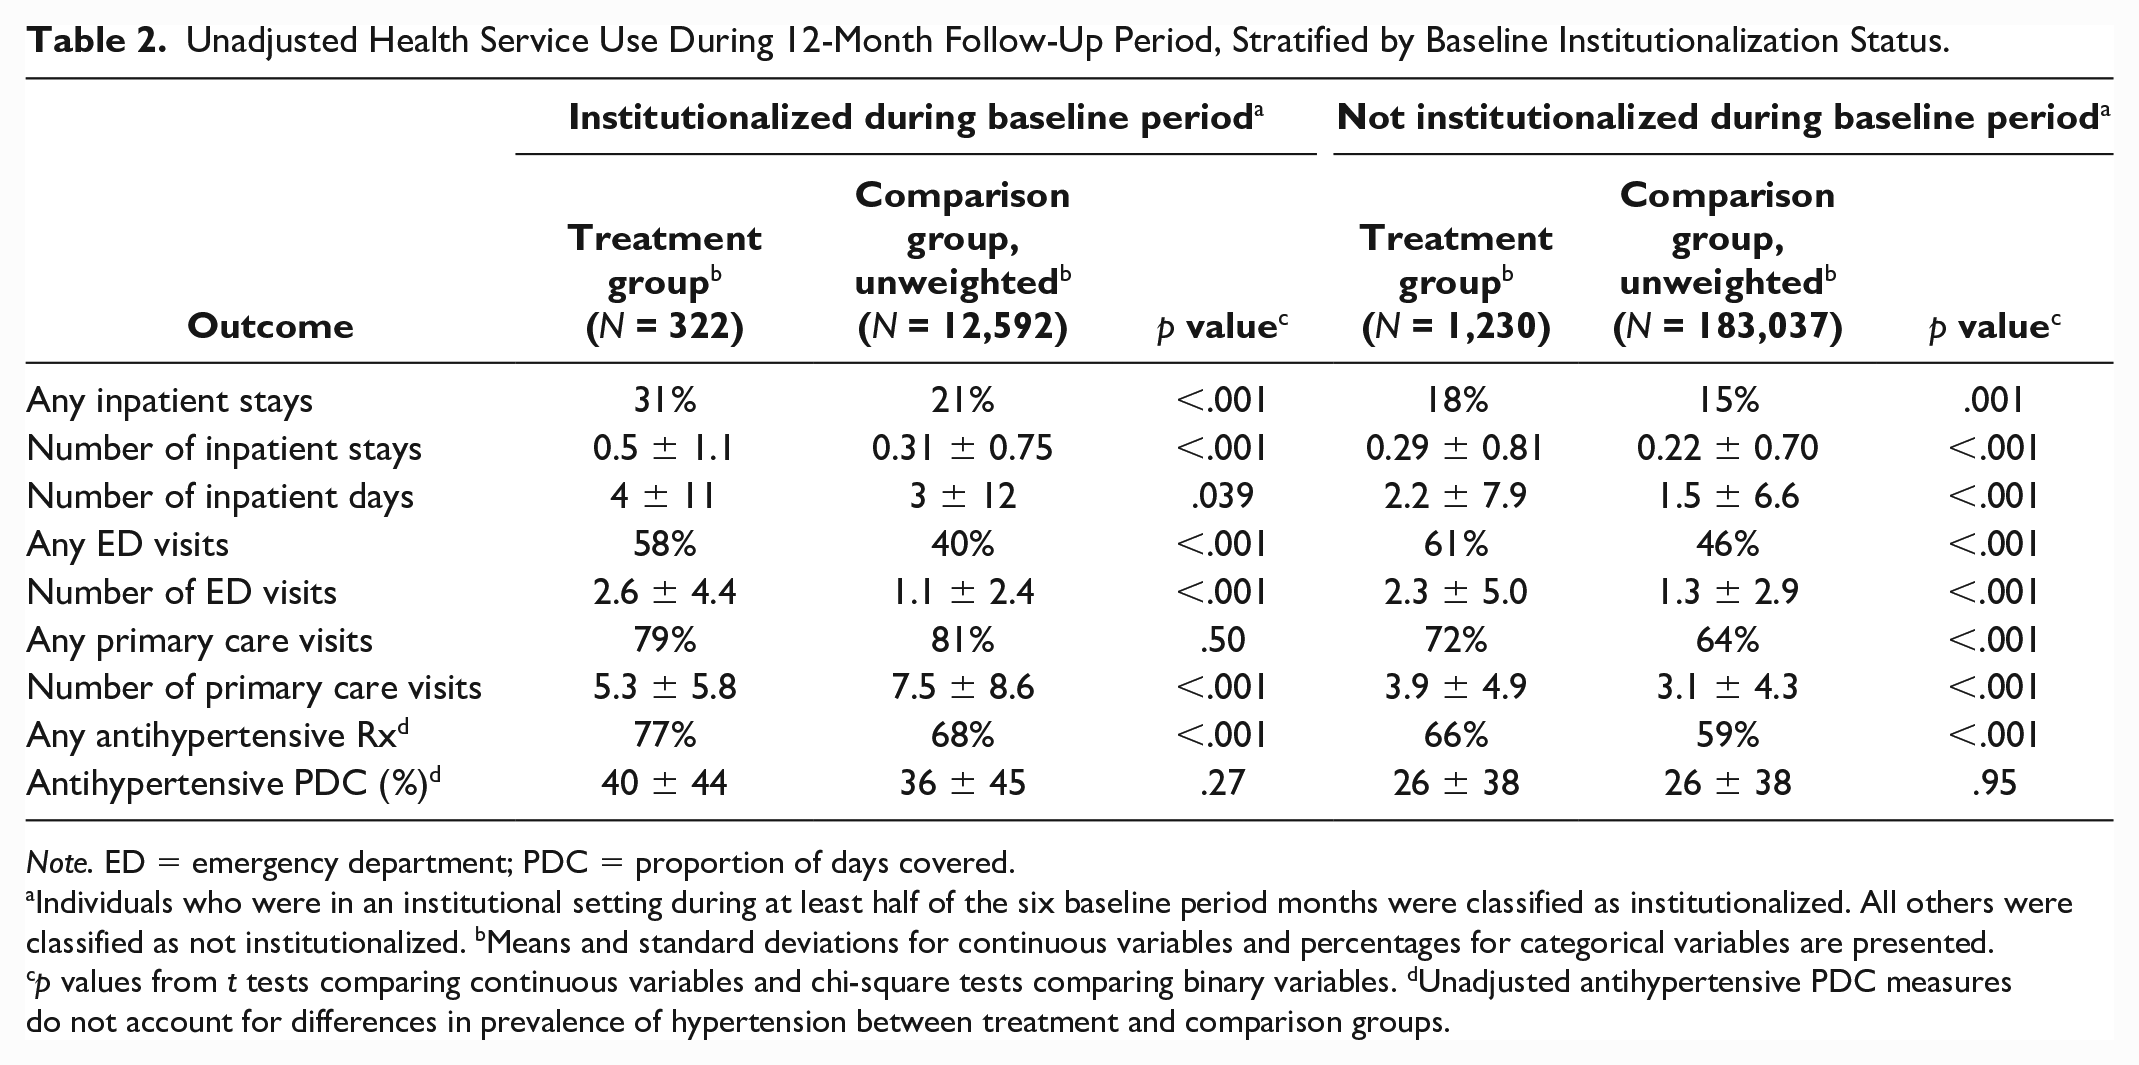
Note. ED = emergency department; PDC = proportion of days covered.
Individuals who were in an institutional setting during at least half of the six baseline period months were classified as institutionalized. All others were classified as not institutionalized. bMeans and standard deviations for continuous variables and percentages for categorical variables are presented. cp values from t tests comparing continuous variables and chi-square tests comparing binary variables. dUnadjusted antihypertensive PDC measures do not account for differences in prevalence of hypertension between treatment and comparison groups.
Main ATT-Weighted Outcome Analyses
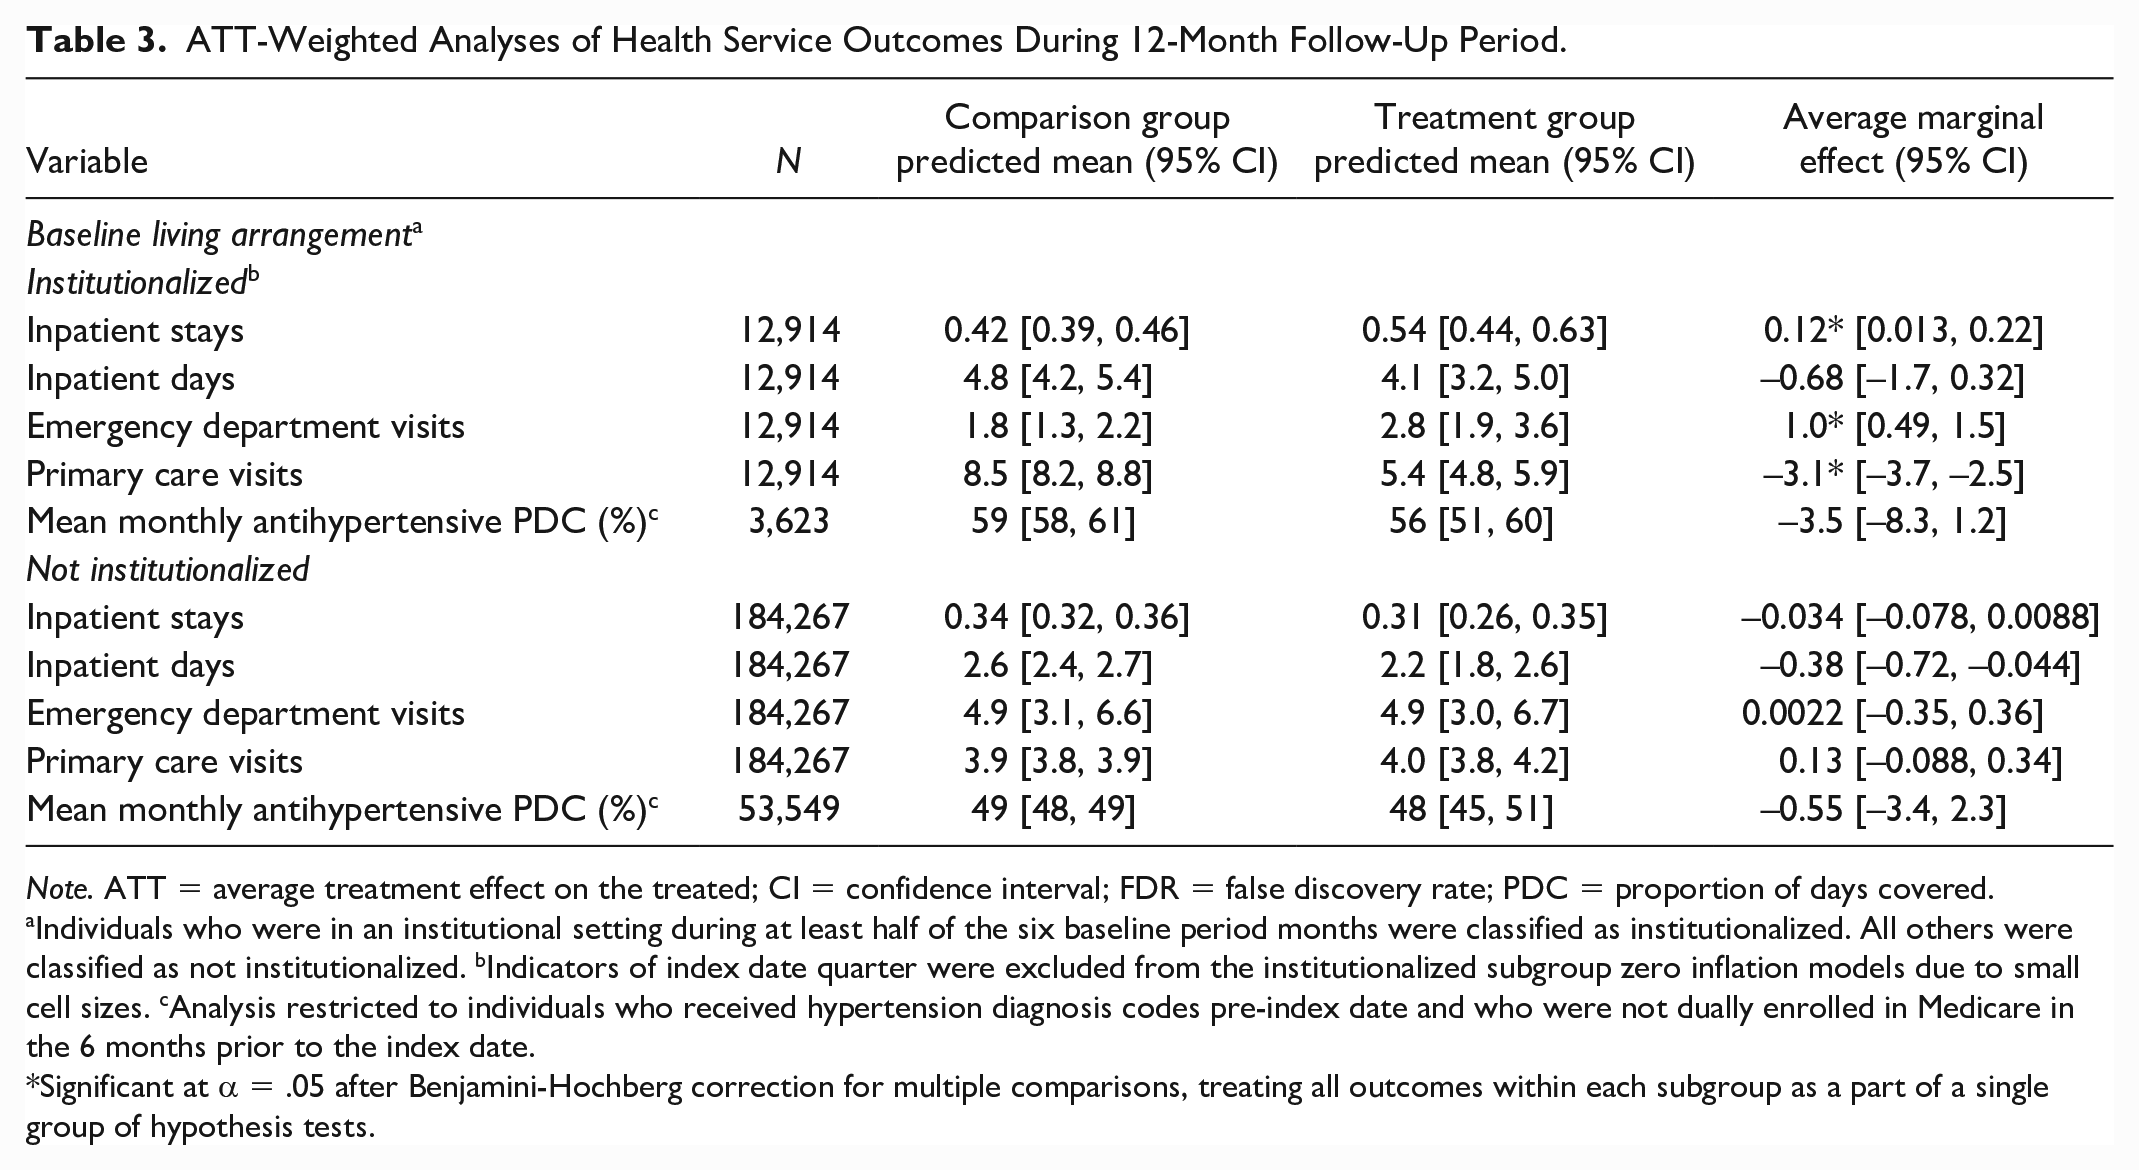
Table 3 presents results from the ATT-weighted analyses of health service outcomes during the 12-month follow-up period. Among individuals who were institutionalized during the baseline period, PSH participation was associated with a greater number of predicted inpatient stays (AME = 0.12; 95% CI = [0.013, 0.22]) and ED visits (AME = 1.0; 95% CI = [0.49, 1.5]) and a lower number of predicted primary care visits (AME = −3.1; 95% CI = [–3.7, –2.5]) during the 12-month follow-up period. Treatment group members who were institutionalized during the baseline period had predicted means of 0.54 (95% CI = [0.44, 0.63]) inpatient stays, 2.8 (95% CI = [1.9, 3.6]) ED visits, and 5.4 (95% CI = [4.8, 5.9]) primary care visits, compared with 0.42 (95% CI = [0.39, 0.46]) inpatient stays, 1.8 (95% CI = [1.3, 2.2]) ED visits, and 8.5 (95% CI = [8.2, 8.8]) primary care visits in the institutionalized comparison group. PSH participation was not associated with the monthly mean antihypertensive PDC in either institutionalization subgroup.
ATT-Weighted Analyses of Health Service Outcomes During 12-Month Follow-Up Period.
Note. ATT = average treatment effect on the treated; CI = confidence interval; FDR = false discovery rate; PDC = proportion of days covered.
Individuals who were in an institutional setting during at least half of the six baseline period months were classified as institutionalized. All others were classified as not institutionalized. bIndicators of index date quarter were excluded from the institutionalized subgroup zero inflation models due to small cell sizes. cAnalysis restricted to individuals who received hypertension diagnosis codes pre-index date and who were not dually enrolled in Medicare in the 6 months prior to the index date.
Significant at α = .05 after Benjamini-Hochberg correction for multiple comparisons, treating all outcomes within each subgroup as a part of a single group of hypothesis tests.
PSH participation was not associated with number of inpatient stays, ED visits, or primary care visits among people who were not institutionalized for at least half of the 6 months preceding the index date. Treatment group members who were not institutionalized during the baseline period had predicted means of 0.31 (95% CI = [0.26, 0.35]) inpatient stays, 4.9 (95% CI = [3.0, 6.7]) ED visits, and 4.0 (95% CI = [3.8, 4.2]) primary care visits, compared with 0.34 (95% CI = [0.32, 0.36]) inpatient stays, 4.9 (95% CI = [3.1, 6.6]) ED visits, and 3.9 (95% CI = [3.8, 3.9]) primary care visits in the noninstitutionalized comparison group. The results were robust to exclusion of sample members who did not contribute 12 months of follow-up data (Supplemental Appendix 3).
Discussion
In this study, we evaluated the association between PSH participation and health service use among individuals with disabilities. Among people who were institutionalized prior to entering PSH, we found that PSH participation was associated with more inpatient stays and lower primary care use, compared with a group of Medicaid beneficiaries with similar clinical and demographic characteristics. However, nearly 80% of comparison group members in the institutionalized subgroup remained in institutional settings during the entire 12-month follow-up period. The observed differences between these treatment and comparison group members thus represent a comparison between people with disabilities living in the community and people with disabilities living in institutions. Comparison group members may have received more regular health checkups while residing in institutional settings, leading them to have more claims for primary care. They also may have had acute care services readily available within the institution, reducing the need for ED visits and hospitalizations. Among formerly institutionalized PSH participants, ED visits and hospitalizations may have served as a substitute for some of the care they previously received in institutional settings. Because our study did not assess the nature of acute care services received, we are unable to determine whether these visits were avoidable with appropriate PSH support services.
Formerly institutionalized PSH participants, nonetheless, had approximately five primary care visits during the follow-up period on average, suggestive of substantial engagement in primary care. In addition, formerly institutionalized PSH participants and comparison groups did not differ with respect to number of inpatient days. Thus, the observed difference between the groups may not be cause for concern. Furthermore, this study assessed differences in health care use across the entire 12-month follow-up period, meaning that we did not examine whether care-seeking patterns varied across the 12 months. PSH participants who entered the program from institutional settings may have faced particular challenges accessing care immediately upon moving out of institutions. These challenges may have attenuated over time as formerly institutionalized participants adjusted to life in the community, and future studies using a longer follow-up period may observe different health service use outcomes.
We found that participants in the PSH program who entered from community settings did not have significantly different acute care use. Prior studies have observed reductions in ED and inpatient care use associated with PSH participation among people with SMI, SUD, and/or other severe medical conditions who were chronically unhoused (Gilmer et al., 2010; Martinez & Burt, 2006; Raven et al., 2020; Sadowski et al., 2009; Srebnik et al., 2013; Wolitski et al., 2010). Our analysis included individuals with the types of conditions represented in the existing PSH literature, but our sample was not restricted to people who were chronically unhoused, which may explain the discrepancy between our findings and those of prior evaluations. Housing participants in some of these prior studies had moderate baseline levels of inpatient and ED use that were comparable to those in our study (Martinez & Burt, 2006; Sadowski et al., 2009), while participants in other studies were explicitly recruited based on high levels of baseline service use (Raven et al., 2020; Srebnik et al., 2013), in contrast to the program we evaluated. In addition, the intensity of support services offered in this program may have differed from those in prior studies as services were delivered by a heterogeneous group of disability service providers, but we were unable to examine the nature of these services or assess fidelity to existing evidence-based models. Expanding the literature on PSH and outpatient health care use, we also found that PSH participation was not associated with primary care use or antihypertensive medication adherence during a 12-month follow-up period among people not institutionalized prior to entering PSH.
Our findings must be interpreted in light of potential threats to their internal and external validity. As participants were not randomly assigned to PSH participation, our analyses may be biased due to any unobserved, systematic differences between our treatment and comparison groups that affect health service use and are not addressed by our propensity score weighting approach. Such differences could include factors like chronic condition severity, which would likely bias our findings downward if condition severity is greater among institutionalized comparison group members, for example. Nonetheless, as long as these unobserved confounders are correlated with included covariates, such as baseline health service utilization, the risk of such bias is mitigated (Stuart, 2010). We also lacked robust information on the housing status, including history of homelessness, of comparison group members in our study. In particular, we are unable to rule out the possibility that comparison group members received PSH or similar services from a source other than the program we studied. However, similar programs in North Carolina tend to restrict eligibility to specific subpopulations (e.g., those who are unhoused, veterans, or who have SMI), meaning that many in our comparison group would not have qualified (North Carolina Housing Finance Agency, 2018). To the extent that contamination of our comparison group did occur, the likely result would be that our estimates understate the true association between PSH participation and health service use in this population, as compared with nonparticipation.
Conclusion
This study offers novel insight into the potential health service use outcomes associated with expanding PSH to a heterogeneous population of individuals with disabilities. Our findings suggest that participants who enter PSH after leaving institutions may use more acute care than similar individuals who remain in institutional settings. The costs associated with additional acute care use among formerly institutionalized PSH participants may represent an investment in avoiding unnecessary institutionalization and granting greater independence for this population. Nevertheless, in anticipation of potential increases in ED use and hospitalizations for those transitioning out of institutional settings, PSH programs may want to consider implementing short-term, high-intensity case management services designed to facilitate regular access to outpatient health services for this population. Mixed-methods approaches could be used to inform the optimal design of such services and determine which subpopulations have the greatest need for additional support. Future research is also needed to determine how PSH participation affects health and well-being outcomes among people with disabilities beyond health service use.
Supplemental Material
sj-docx-1-mcr-10.1177_10775587231183192 – Supplemental material for Permanent Supportive Housing Receipt and Health Care Use Among Adults With Disabilities
Supplemental material, sj-docx-1-mcr-10.1177_10775587231183192 for Permanent Supportive Housing Receipt and Health Care Use Among Adults With Disabilities by Lexie R. Grove, Seth A. Berkowitz, Gary Cuddeback, George H. Pink, Sally Clark Stearns, Til Stürmer and Marisa Elena Domino in Medical Care Research and Review
Supplemental Material
sj-docx-2-mcr-10.1177_10775587231183192 – Supplemental material for Permanent Supportive Housing Receipt and Health Care Use Among Adults With Disabilities
Supplemental material, sj-docx-2-mcr-10.1177_10775587231183192 for Permanent Supportive Housing Receipt and Health Care Use Among Adults With Disabilities by Lexie R. Grove, Seth A. Berkowitz, Gary Cuddeback, George H. Pink, Sally Clark Stearns, Til Stürmer and Marisa Elena Domino in Medical Care Research and Review
Supplemental Material
sj-docx-3-mcr-10.1177_10775587231183192 – Supplemental material for Permanent Supportive Housing Receipt and Health Care Use Among Adults With Disabilities
Supplemental material, sj-docx-3-mcr-10.1177_10775587231183192 for Permanent Supportive Housing Receipt and Health Care Use Among Adults With Disabilities by Lexie R. Grove, Seth A. Berkowitz, Gary Cuddeback, George H. Pink, Sally Clark Stearns, Til Stürmer and Marisa Elena Domino in Medical Care Research and Review
Footnotes
Acknowledgements
The database infrastructure used for this project was supported by The Cecil G. Sheps Center for Health Services Research and the CER Strategic Initiative of UNC’s Clinical and Translational Science Award (UL1TR002489). The North Carolina Division of Health Benefits and the North Carolina Housing Finance Agency (NCHFA) provided the data used in this study. The authors would also like to thank staff at the NC Division of Health Benefits and NCHFA for linking study data sources and providing information on the program studied. The NC Division of Health Benefits and NCHFA do not take responsibility for the scientific validity or accuracy of methodology, results, statistical analyses, or conclusions presented.
Declaration of Conflicting Interests
The author(s) declared the following potential conflicts of interest with respect to the research, authorship, and/or publication of this article: T.S. receives investigator-initiated research funding and support as Principal Investigator (R01 AG056479) from the National Institute on Aging (NIA), and as Co-Investigator (R01 HL118255, R01MD011680) from the National Institutes of Health (NIH). He also receives salary support as Director of Comparative Effectiveness Research (CER), NC TraCS Institute, UNC Clinical and Translational Science Award (UL1TR002489), the Center for Pharmacoepidemiology (current members: GlaxoSmithKline, UCB BioSciences, Takeda, AbbVie, Boehringer Ingelheim), from pharmaceutical companies (Novo Nordisk), and from a generous contribution from Dr. Nancy A. Dreyer to the Department of Epidemiology, The University of North Carolina at Chapel Hill. T.S. does not accept personal compensation of any kind from any pharmaceutical company. He owns stock in Novartis, Roche, and Novo Nordisk. M.E.D. has received funding for unrelated projects from the North Carolina Department of Health and Human Services. SAB reports research grants from NIH, North Carolina Department of Health and Human Services, Blue Cross Blue Shield of North Carolina, and Feeding America, and personal fees from the Aspen Institute, Rockefeller Foundation, Gretchen Swanson Center for Nutrition, and Kaiser Permanente, outside of the submitted work.
Funding
The author(s) disclosed receipt of the following financial support for the research, authorship, and/or publication of this article: This research was partially supported by a National Research Service Award Pre-Doctoral Traineeship from the Agency for Healthcare Research and Quality sponsored by The Cecil G. Sheps Center for Health Services Research, The University of North Carolina at Chapel Hill, Grant No. T32-HS000032.
Supplemental Material
Supplemental material for this article is available online.
References
Supplementary Material
Please find the following supplemental material available below.
For Open Access articles published under a Creative Commons License, all supplemental material carries the same license as the article it is associated with.
For non-Open Access articles published, all supplemental material carries a non-exclusive license, and permission requests for re-use of supplemental material or any part of supplemental material shall be sent directly to the copyright owner as specified in the copyright notice associated with the article.