
Abstract
Background
Emerging evidence suggests that various types of immune cells are associated with venous thromboembolism (VTE). However, the roles of distinct immune cell phenotypes in VTE remain largely unclear.
Methods
By analyzing 731 distinct immune traits identified through genome-wide association studies (GWAS) and publicly available genetic data from patients with VTE in the FinnGen database, we applied rigorous quality control steps to identify instrumental variables (IVs) associated with exposure. We performed two-sample Mendelian randomization (MR) using inverse-variance weighting to assess causal associations between 731 immune traits and VTE, including deep vein thrombosis (DVT) and pulmonary embolism (PE). To assess the robustness of the findings, sensitivity analyses such as leave-one-out cross-validation and additional Mendelian randomization approaches were performed. Subsequently, Bayesian colocalization analysis (COLOC) was employed to identify potential colocalized genetic signals, thereby providing additional support for the MR findings.
Results
At an FDR-adjusted significance threshold, three immune phenotypes, including CD4 on CD39+CD4+T cell, naive CD4+ T cell absolute cell counts (ACs), and CD4-CD8-natural killer (NK) T% T cell were negatively associated with the risk of VTE. CD45RA+ CD8+ T cell AC was negatively linked to the onset of DVT. Additionally, five immune phenotypes, including human leukocyte antigen (HLA) DR+ NK%CD3-lymphocyte, HLA DR+ NK%NK, side scatter area (SSC)-A on HLA DR+ NK, PDL-1 on CD14-CD16+ monocyte and CD16 on CD14+CD16+ monocyte were negatively associated with the risk of PE. CD86+ myeloid dendritic cell (DC) ACs and CD86+ myeloid DC% DC were positively correlated with PE. COLOC analysis revealed that naive CD4+ T cell AC variants (rs3104369) colocalized with VTE.
Conclusion
Our findings reveal that different immune phenotypes exhibit either protective or risk-increasing effects on VTE, improving our understanding of VTE risk factors and offering valuable insights for advancing future research and clinical implementation.
Keywords
Introduction
Venous thromboembolism (VTE), manifesting primarily as deep vein thrombosis (DVT) and pulmonary embolism (PE), constitutes a substantial global health burden with approximately 10 million annual cases worldwide, making it the third most common cardiovascular disorder.1,2 While traditional risk factors such as thrombophilia, malignancy, and infection are well established, the critical roles of systemic inflammation and immune regulation in the pathogenesis of VTE have increasingly become the focus of recent research.3-5
The interactions between innate and adaptive immune subsets and vascular endothelial cells have garnered increasing attention in various thrombotic diseases.6-8 Downregulation of natural killer (NK) cells, 9 overexpression of monocytes and mast cells, 10 and the recruitment of regulatory T cells (Tregs) to venous thrombi 11 are closely associated with VTE development and thrombolysis. Furthermore, therapies that activate T cells, such as immune checkpoint inhibitors, significantly increase the incidence of VTE in cancer patients. 12 Although extensive evidence has confirmed the association between immune cells and VTE, 13 most studies are observational and limited by small cohorts and potential confounders. Thus, the causal relationship between immune cells and VTE remains unclear.
As a novel data analysis approach, Mendelian Randomization (MR) technique employs genetic variations linked to exposure-related genetic variants as instruments to infer causality between risk factors and outcomes.14-16To definitively elucidate the causal interactions between the immune system and venous thrombosis, we performed a comprehensive two-sample MR analysis. We leveraged large-scale, deep immunophenotyping genome-wide association study (GWAS) data alongside the extensive FinnGen European cohort. Furthermore, the extensive FinnGen European cohort was strictly selected for the outcome analysis to ensure ancestral matching and maximize statistical power. Identifying these specific causal immune signatures aims to provide vital novel insights into the immunopathogenesis of VTE.
Materials and Methods
Study Design
A two-sample MR approach was applied to assess the associations between 731 immune traits and VTE, including its two main subtypes DVT and PE. This study strictly followed the Strengthening the Reporting of Observational Studies in Epidemiology Using Mendelian Randomization (STROBE-MR) guidelines.
17
To minimize population stratification bias, we required that both exposure and outcome datasets be derived from the same ancestral background. Given that the most comprehensive high-quality GWAS summary statistics for deep immunophenotypes were generated in European-ancestry populations, we restricted all outcome analyses to European-descent cohorts. Accordingly, the FinnGen consortium was selected as the outcome data source, as it represents one of the largest, best-phenotyped, and publicly available European-descent genomic resources to date. The FinnGen project has obtained ethical approval from the Ethics Committee of the Finnish National Institute for Health and Welfare (THL), with full compliance with the Declaration of Helsinki and the EU General Data Protection Regulation (GDPR). All data used are de-identified open-access summary statistics, with no access to individual-level participant data. Thus, this study does not require additional ethical approval under Article 32(1–2) of China’s 2023 Ethical Review Measures for Human-Involving Life Sciences and Medical Research. A schematic overview of the study design is presented in Figure 1. Flow chart of this study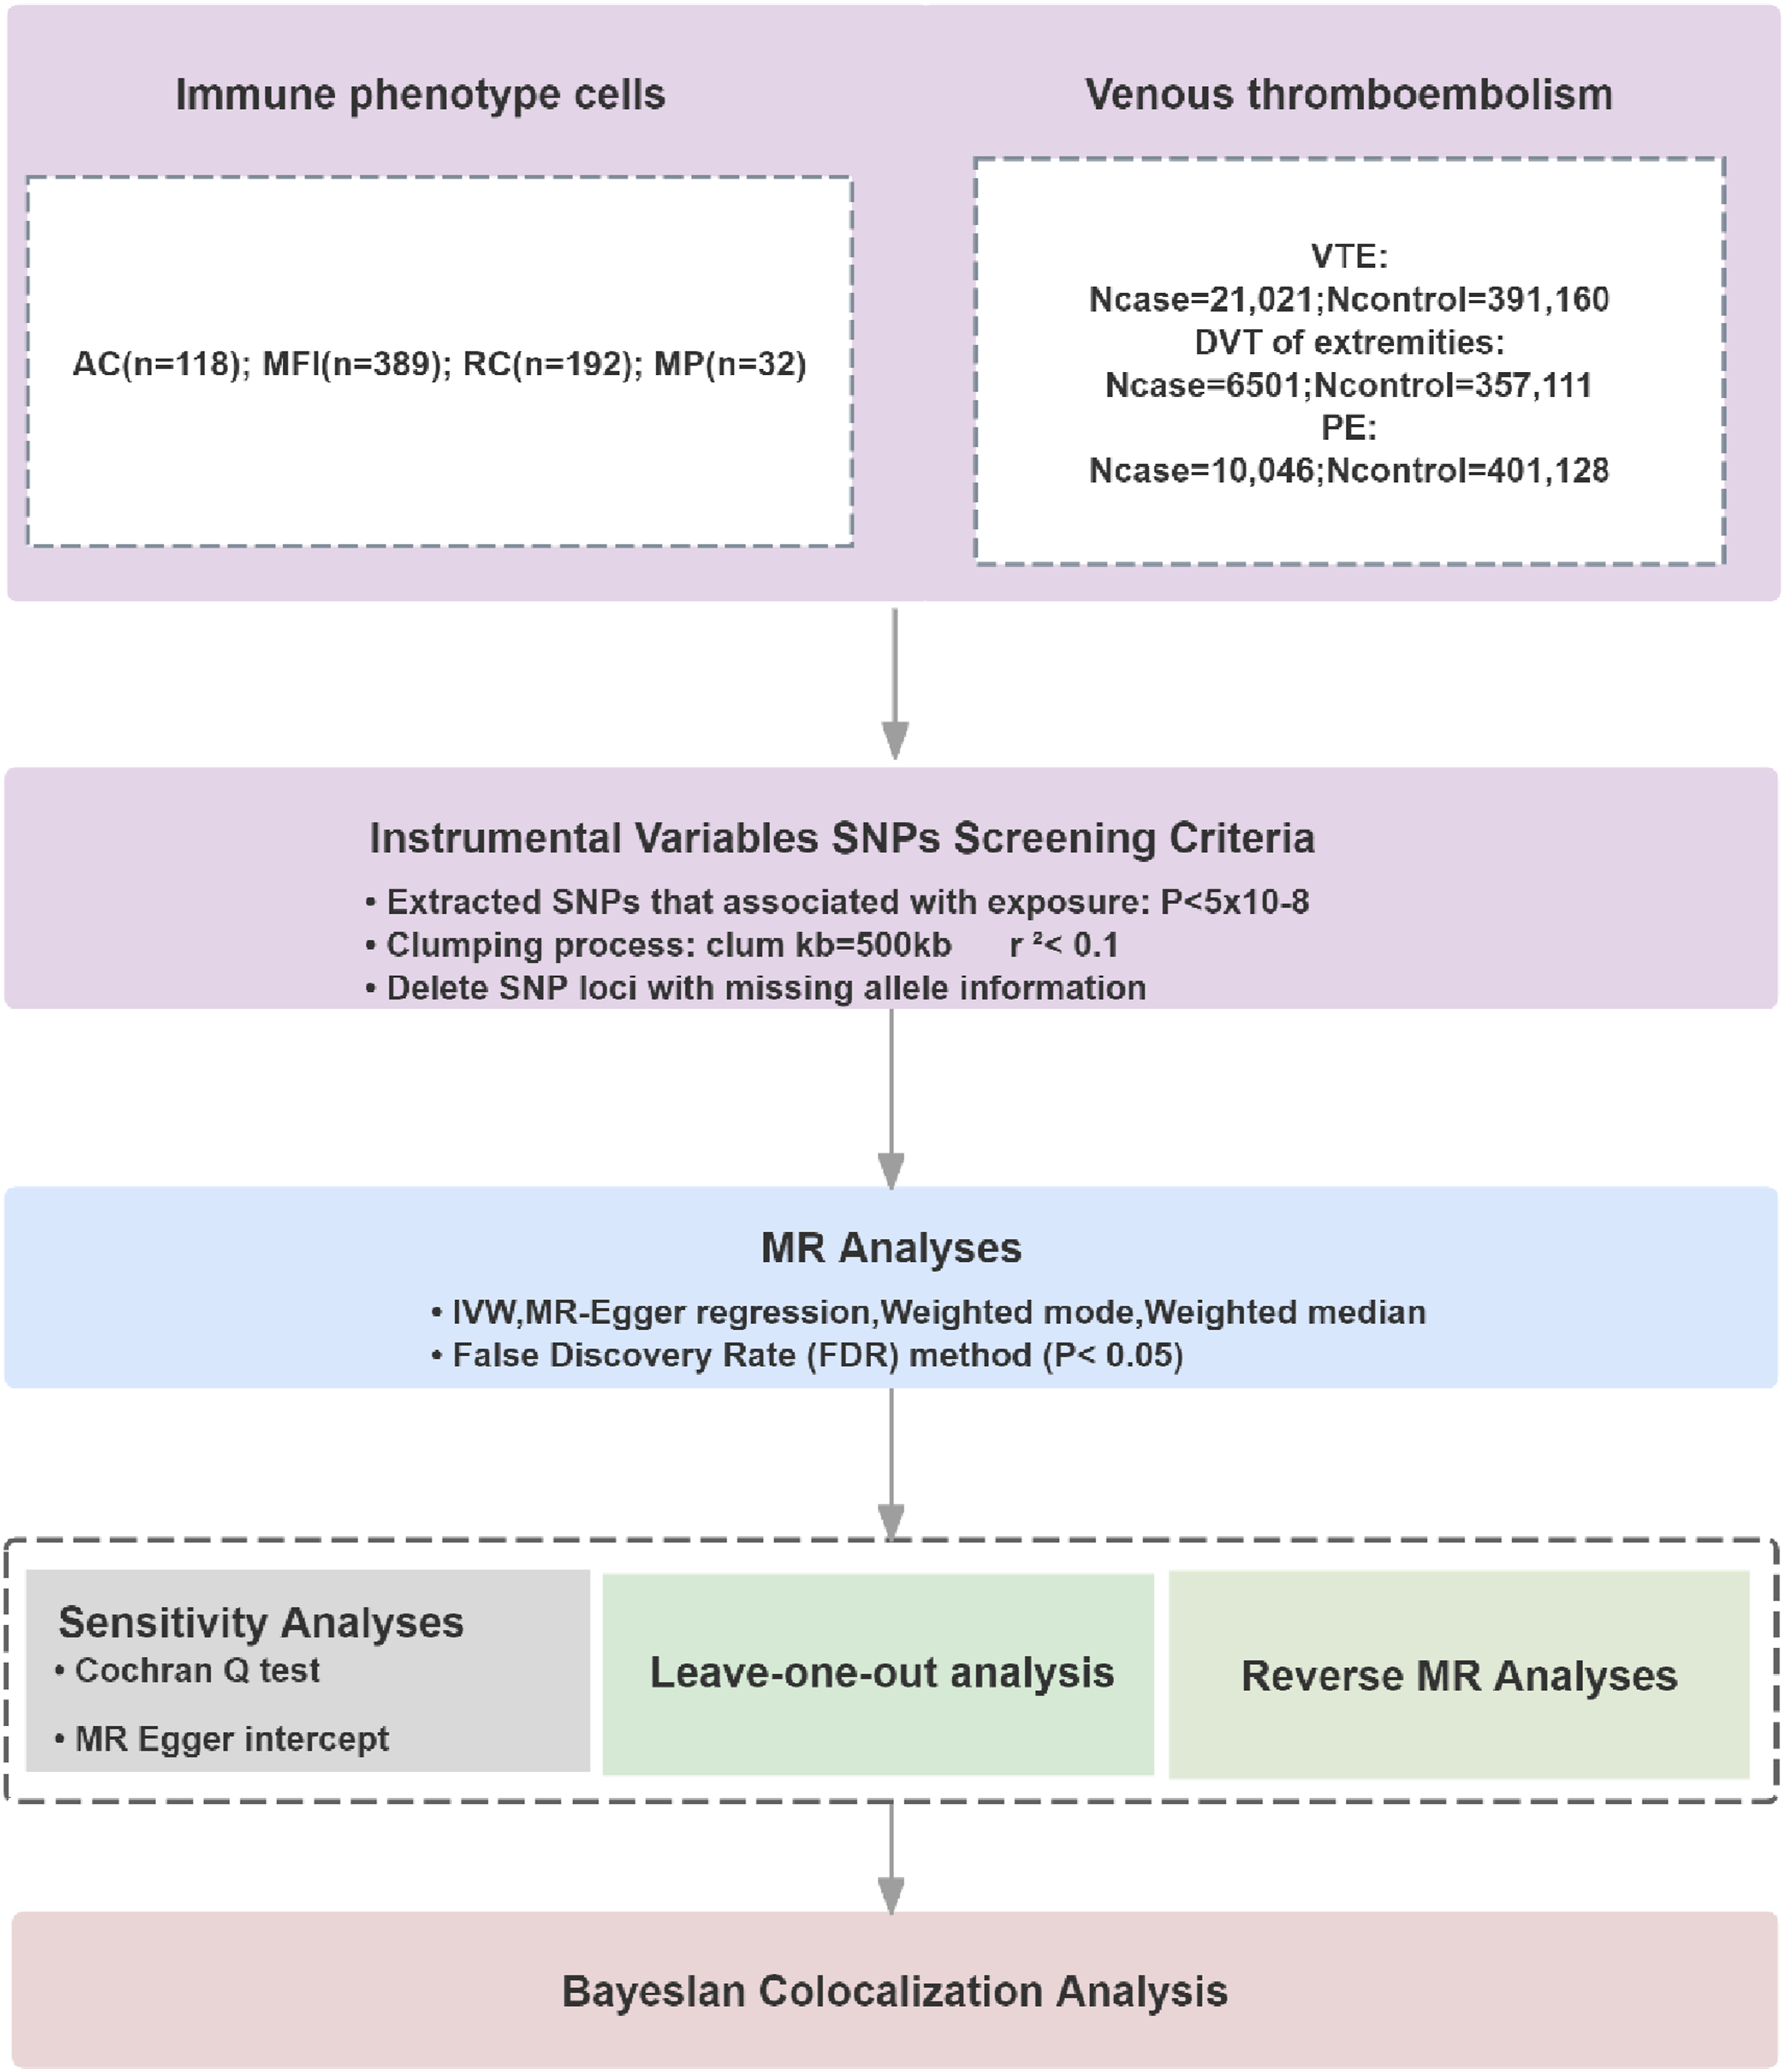
Data Sources
Source of Immune Cell Data
Genome-wide association data for immune cell phenotypes were obtained from 3,757 individuals of European ancestry. The immune cell phenotypes were categorized into four groups: absolute cell counts (ACs; n=118), median fluorescence intensity (MFI; n=389), morphological parameters (MP; n=32), and relative cell counts (RCs; n=192). Among these cell phenotypes, the MFI, AC, and RC categories included B cells, classical dendritic cells (cDCs), T cells, monocytes, myeloid cells, NK cells (TBNK), and Treg cells. The MP phenotype included both cDCs and TBNK cells. 18 The GWAS dataset was collected and statistically analyzed in 2020. Details of the 731 immunocyte phenotypes are listed in Supplementary Table 1.
Source of Venous Thromboembolic Disease Data
The GWAS analysis for VTE was conducted using the R10 version of the FinnGen database released in 2023 (https://r10.finngen.fi/). The FinnGen cohort, consisting of individuals of European ancestry, was utilized for this study. From this extensive dataset, we identified 21,021 venous thromboembolism cases and 391,160 matched controls. Further stratification revealed 6,501 cases of DVT and 357,111 controls, alongside 10,046 cases of PE and 401,128 controls. Diagnoses were defined using ICD-10 codes I26/I80 and ICD-9 codes 415/451.
Selection of IVs
IVs were identified based on three core hypotheses: First, SNPs with P < 5 × 10⁻⁸ were extracted from each immune trait GWAS. The analysis employed a filtering strategy in which the linkage disequilibrium parameter r2 was capped at 0.1 and the distance between SNPs was limited to 500 kb to prevent linkage disequilibrium effects between SNP loci. 19 To evaluate instrument strength and guard against weak instrument bias, the F-statistic was calculated for each SNP using the formula F = (β/se), 2 where β is the allelic effect estimate and se is its standard error. 20 SNPs with an F-statistic ≤ 10 were excluded, as values above this threshold indicate sufficient instrument strength to minimize bias toward the confounded observational estimate. The F-statistics for all retained instrumental variables are in Supplementary Tables 2-7, confirming that all included SNPs exceeded this threshold. Furthermore, we performed power calculation using the approach proposed by Burgess and colleagues. 21 For immune traits showing significant associations, the statistical power ranged from 0.82 to 0.99, indicating adequate power to detect causal effects. Detailed power calculations for each significant association are provided in Supplementary Table 9.
Statistical Analysis
The causal relationship between immune cell phenotypes and VTE was evaluated using inverse-variance weighted (IVW), MR-Egger, weighted median, and weighted mode analyses. IVW served as the primary Mendelian randomization method for causal inference and is characterized by its applicability when using multiple genetic variants as IVs. 22 Additional analyses were performed to detect potential heterogeneity and horizontal pleiotropy. Heterogeneity was evaluated by Cochran’s Q test in the IVW analysis; P > 0.05 indicates no significant heterogeneity. 23 The MR pleiotropy test was used to detect horizontal pleiotropy by examining the MR-Egger intercept term. A P value > 0.05 indicated no significant horizontal pleiotropy. 24 To assess robustness, we sequentially removed each variant and re-estimated the causal effect via leave-one-out analysis. To account for multiple testing across 731 immune traits, we applied the Benjamini-Hochberg false discovery rate (FDR) correction separately for each outcome, including VTE, DVT, and PE. This approach controls the FDR at < 0.05 within each outcome category while maintaining adequate statistical power.25,26
Additionally, a reverse Mendelian randomization analysis was conducted using VTE, DVT, and PE as exposures and immune phenotypes as outcomes to evaluate bidirectional causality. Odds ratios (ORs) are presented with 95% confidence intervals (CIs); statistical significance was defined as P < 0.05. Bayesian colocalization analysis was used to determine whether the risk of VTE and immune phenotype changes were associated with the same single-nucleotide variations. Using univariate summary statistics from GWAS data, this analysis evaluates the posterior probabilities of five hypotheses: H0 (no association with either trait), H1 (association with trait 1 only), H2 (association with trait 2 only), H3 (association with both traits but distinct causal variants), and H4 (association with both traits sharing a single causal variant). In this study, the default prior probabilities were applied: the prior probability of a SNP being associated with trait 1 (p1) was set to 1*10-4, with trait 2 (p2) to 1*10-4, and with both traits simultaneously (p12) to 1*10-5. We focused on loci exhibiting a combined posterior probability (PPH3+PPH4) exceeding 0.8, indicating strong evidence of colocalization.27-29 All statistical analyses were performed using the R statistical software package (v4.3.1).
Results
Forward Instrumental Variable
An IV screening of GWAS data was conducted on 731 immune cell phenotypes. Initial screening revealed a potential causal association between VTE and three immune phenotypes with VTE, one with DVT, and twelve with PE; all IVs showed F-statistics >10, ruling out weak instrument bias, and FDR-corrected P values remained <0.05. Supplementary Tables 2-4 detail the corresponding SNP counts.
Impact of Immune Cell Phenotypes on VTE
Three immune cell phenotypes showed potentially causal inverse associations with VTE (OR < 1, Pval< 0.05, P
fdr
< 0.05), suggesting that higher surface marker expression on these cells reduces VTE risk. The following three immune cell traits were negatively associated with VTE occurrence: Treg panel: the CD4 on CD39+ CD4+ T cell (P
val
< 0.0001; P
fdr
< 0.0001; OR 95% CI = 0.95 (0.93, 0.97)), maturation stages of the T cell panel: naive CD4+ T cell AC (P
val
< 0.0001; P
fdr
= 0.014; OR 95% CI = 0.89 (0.84, 0.94)); and TBNK panel: CD4-CD8-natural killer T%T cell (P
val
< 0.0001; P
fdr
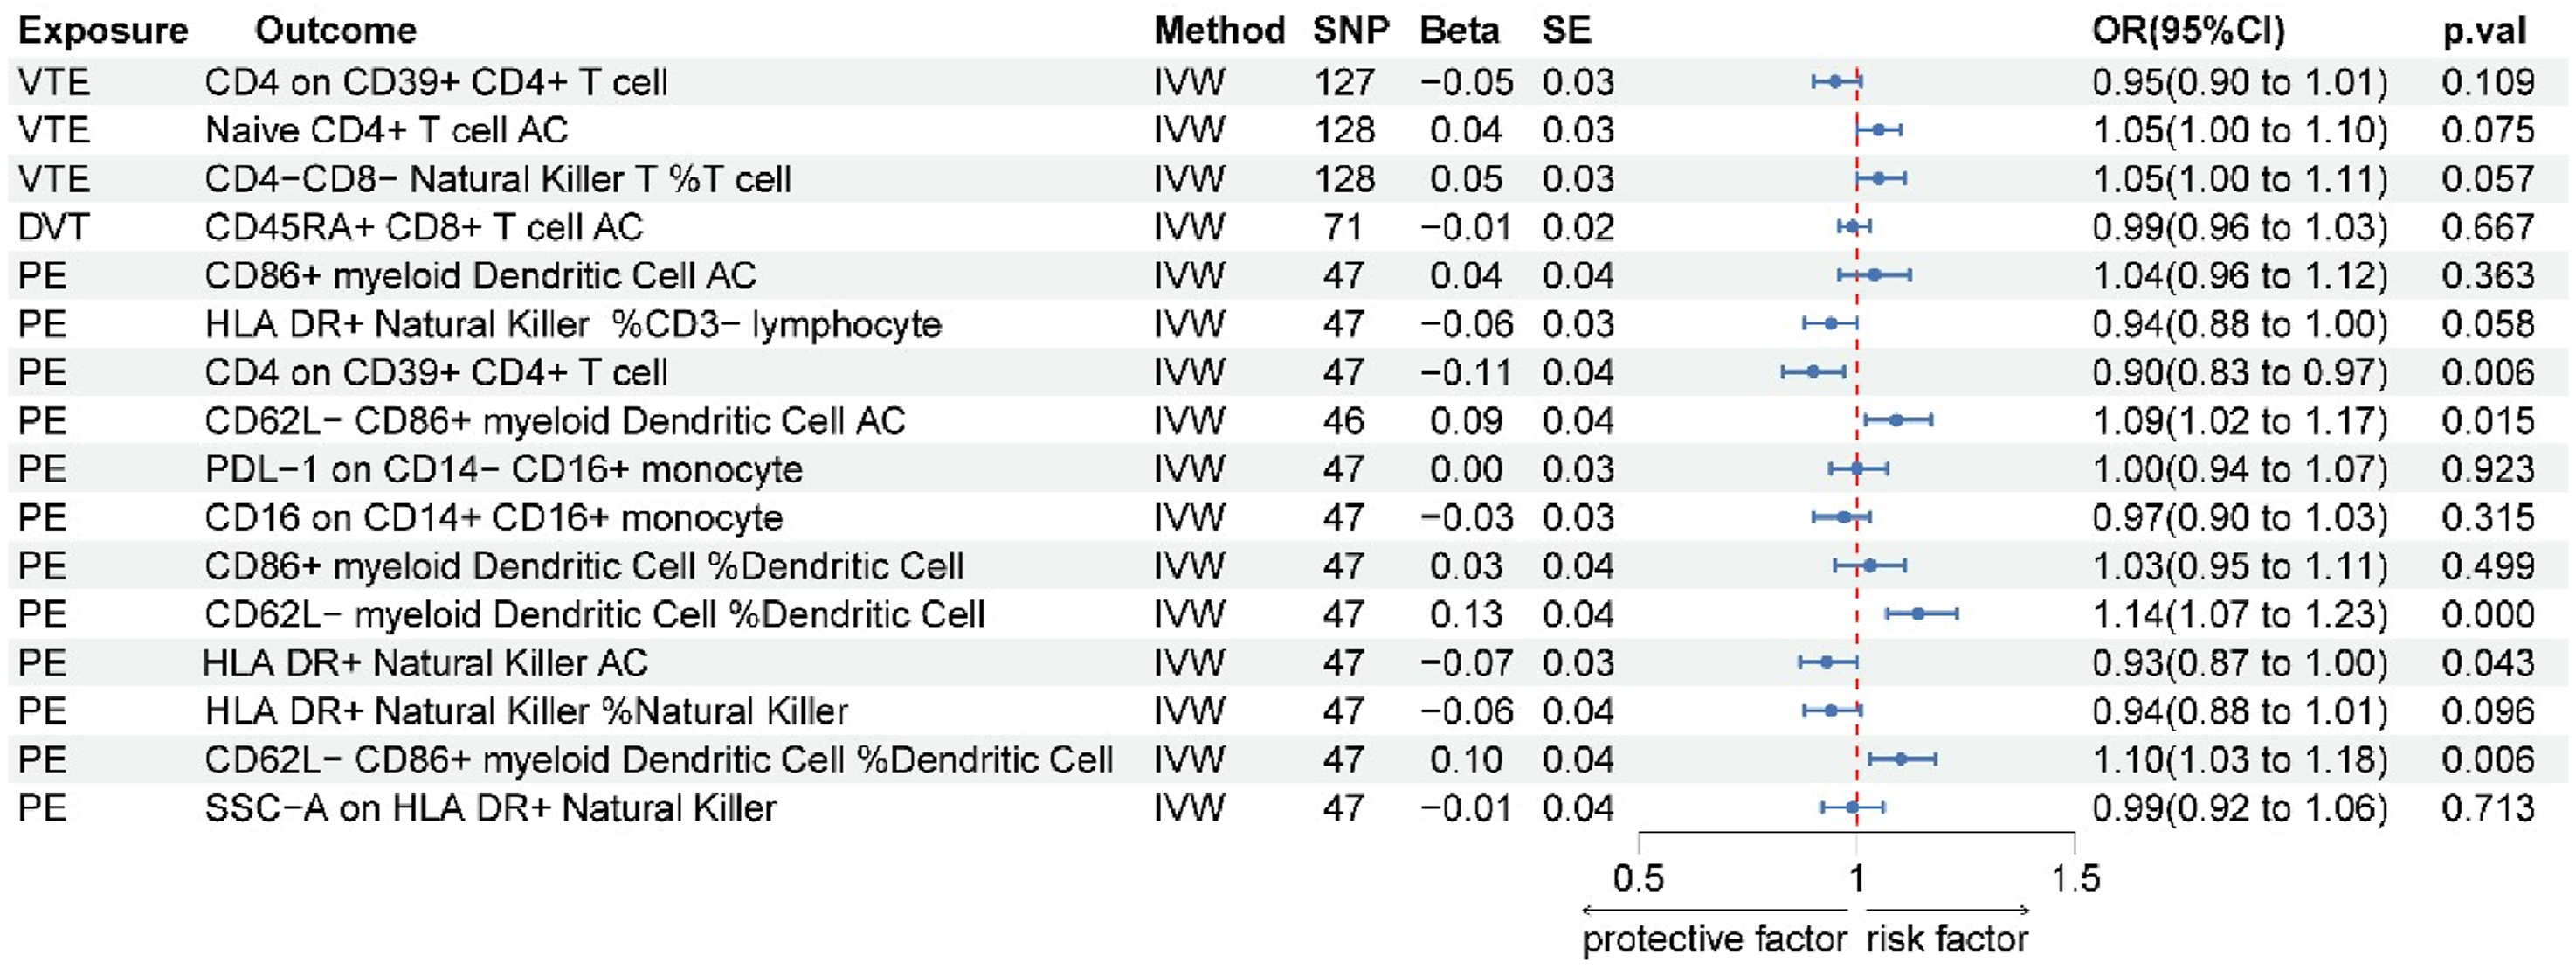
= 0.048; OR 95% CI = 0.94 (0.90, 0.97)). Additional details are provided in Figure 2 and Supplementary Figure 1. Reverse MR analyses of these three phenotypes yielded no statistically significant associations (all P > 0.05), suggesting that VTE does not exert a discernible causal effect on the levels of these immune cell traits (Figure 3). Forest map of MR results of immune cells and VTE, DVT, and PE Forest plot of reverse MR analysis evaluating the causal effect of VTE, DVT, and PE on immune cells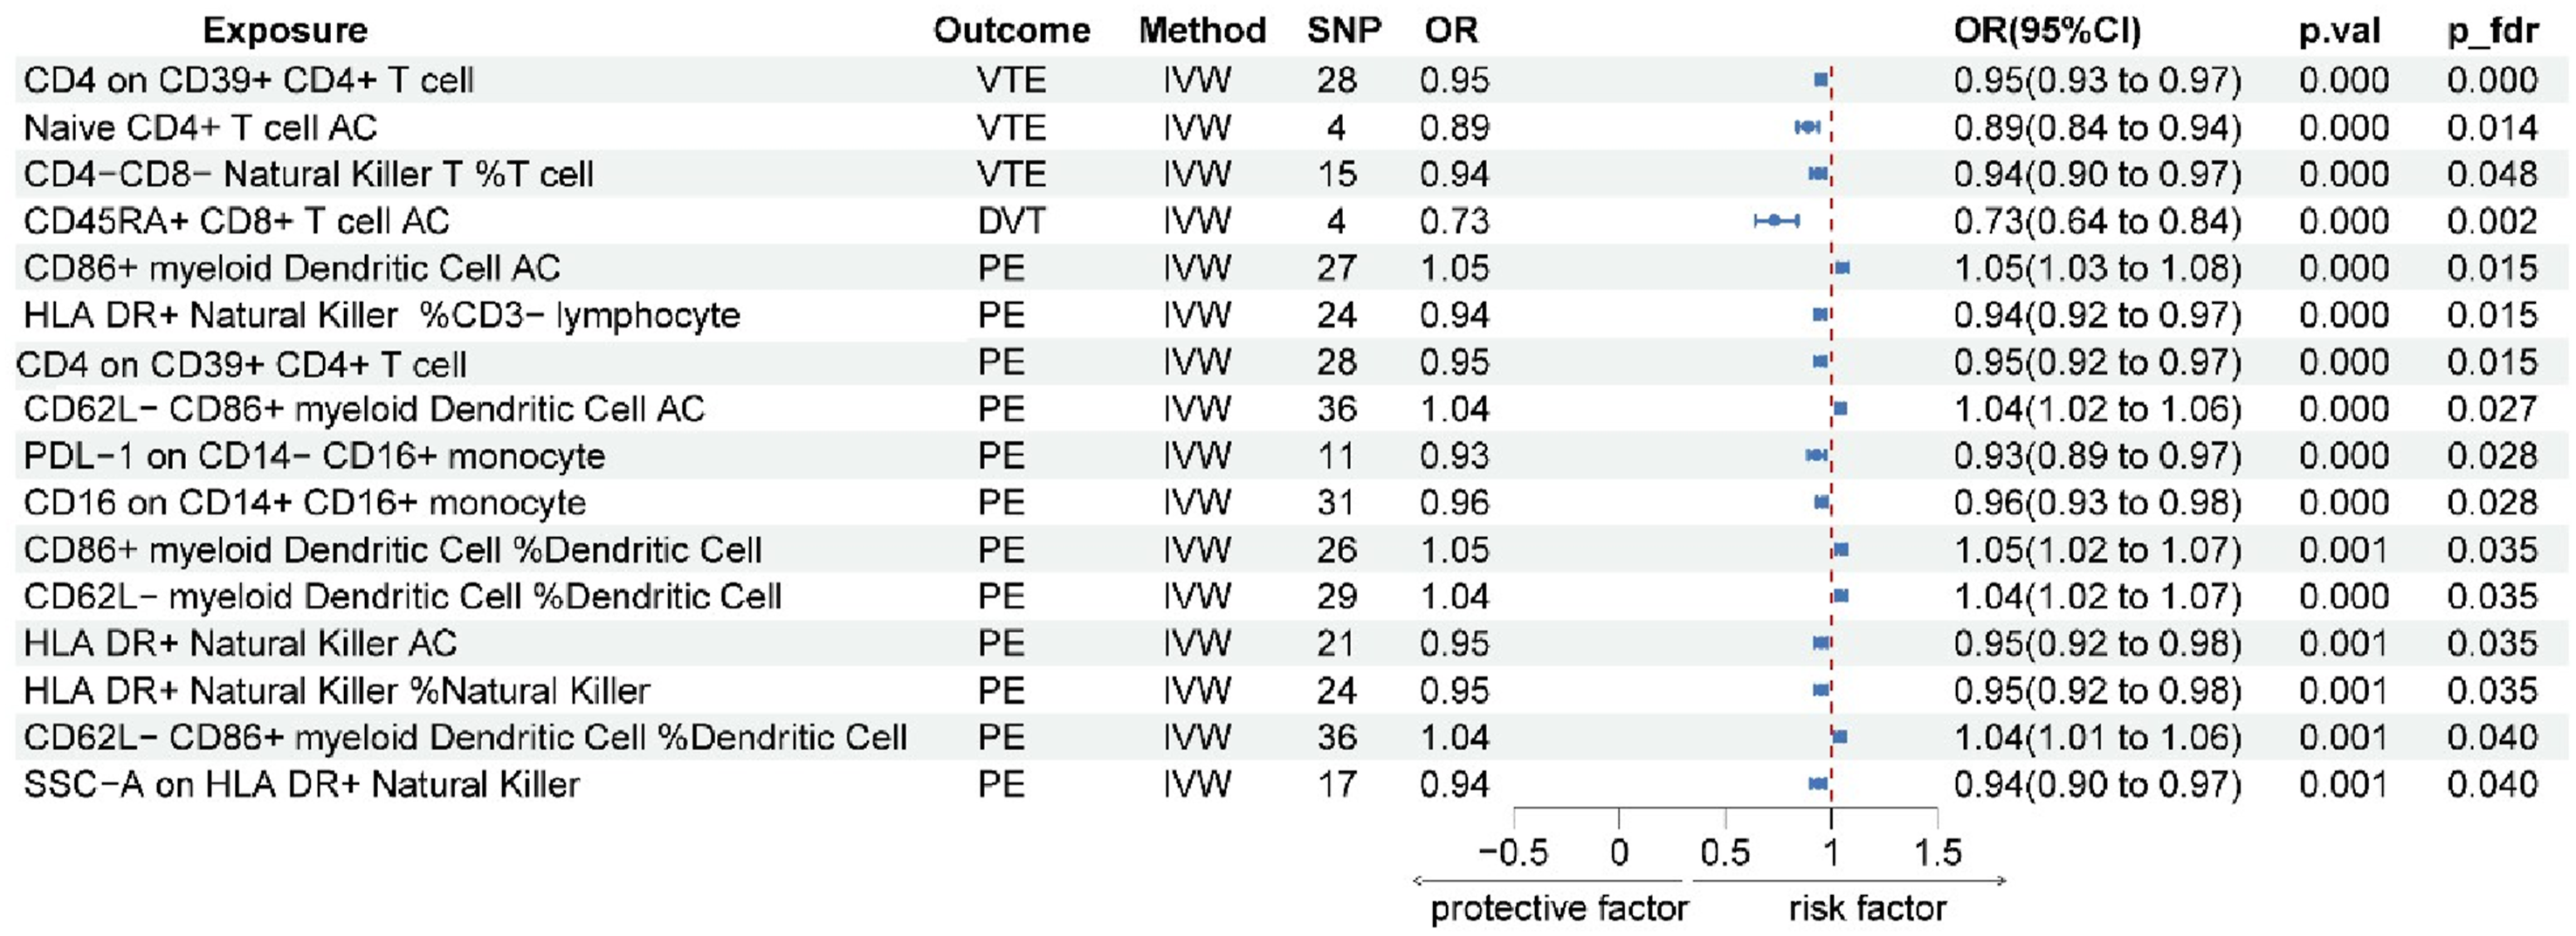
Causal Effect of Immune Cell Phenotypes on DVT
One immune cell phenotype demonstrated a potential causal association with DVT: CD45RA+ CD8+ T cell AC (P val < 0.0001; P fdr = 0.002; OR 95% CI = 0.73 (0.64, 0.84)). Genetically predicted higher levels of this immune cell phenotype were negatively associated with DVT risk (Figure 2 and Supplementary Figure 1). Reverse Mendelian randomization analysis revealed no causal effect of DVT on the immune cells we studied (P>0.05), indicating a lack of significant influence (Figure 3).
Causal Effect of Immune Cell Phenotypes on PE
Our analysis revealed a potential causal link from four immune cell types to PE. Five phenotypes from the DC panel showed positive associations with PE risk (OR > 1), indicating that genetically predicted higher levels of these myeloid dendritic cell phenotypes were associated with increased PE risk: CD86+ myeloid DC%DC (P val = 0.001; P fdr = 0.035; OR 95% CI = 1.05 (1.02, 1.07)), CD62L-myeloid DC%DC (P val < 0.0001; P fdr = 0.035; OR 95% CI = 1.04 (1.02, 1.07)), CD62L-CD86+ myeloid DC%DC (P val = 0.001; P fdr = 0.040; OR 95% CI = 1.04 (1.01, 1.06)), CD86+myeloid Dendritic Cell AC (P val < 0.0001; P fdr = 0.015; OR 95% CI = 1.05 (1.03, 1.08)) and CD62L-CD86+myeloid Dendritic Cell AC (P val < 0.0001; P fdr = 0.027; OR 95% CI = 1.04 (1.02, 1.06)).
Seven phenotypes showed inverse associations with PE risk (OR< 1, P fdr < 0.05). Treg panel: the CD4 on CD39+ CD4+ T cell (Pval < 0.0001; Pfdr = 0.015; OR 95% CI = 0.95 (0.92, 0.97)); TBNK panel: HLA DR+ natural killer% CD3-lymphocyte (P val < 0.0001; P fdr = 0.015; OR 95% CI = 0.94 (0.92, 0.97)), HLA DR+ NK%NK (P val = 0.001; P fdr = 0.035; OR 95% CI = 0.95 (0.92, 0.98)), HLA DR+ NK AC (P val = 0.001; P fdr = 0.035; OR 95% CI = 0.95 (0.92, 0.98)) and side scatter area (SSC)-A on HLA DR+ NK(P val = 0.001; P fdr = 0.040; OR 95% CI = 0.94 (0.90, 0.97)); Monocyte panel: the programmed death ligand 1 (PDL-1) marker on CD14-CD16+ monocyte(P val < 0.0001; P fdr = 0.028; OR 95% CI = 0.93 (0.89, 0.97)) and the CD16 on CD14+CD16+ monocyte(P val < 0.0001; P fdr = 0.028; OR 95% CI = 0.96 (0.93, 0.98)). These findings are depicted in Figure 2 and Supplementary Figure 1.
After excluding these five immune cell phenotypes with potential bidirectional associations, the remaining seven phenotypes retained evidence for a robust unidirectional forward causal association with PE risk, including five negatively associated phenotypes (HLA DR+ NK%CD3-lymphocyte, HLA DR+ NK%NK, SSC-A on HLA DR+ NK, PDL-1 on CD14-CD16+ monocyte, and CD16 on CD14+CD16+ monocyte) and two positively associated phenotypes (CD86+ myeloid DC AC and CD86+ myeloid DC%DC). The complete set of reverse MR results is presented in Figure 3.
Sensitivity Analysis for Immunophenotypes Associated With VTE
Cochran’s Q test for heterogeneity and MR-Egger intercept test for horizontal pleiotropy in MR analyses of immune traits with VTE, DVT, and PE.
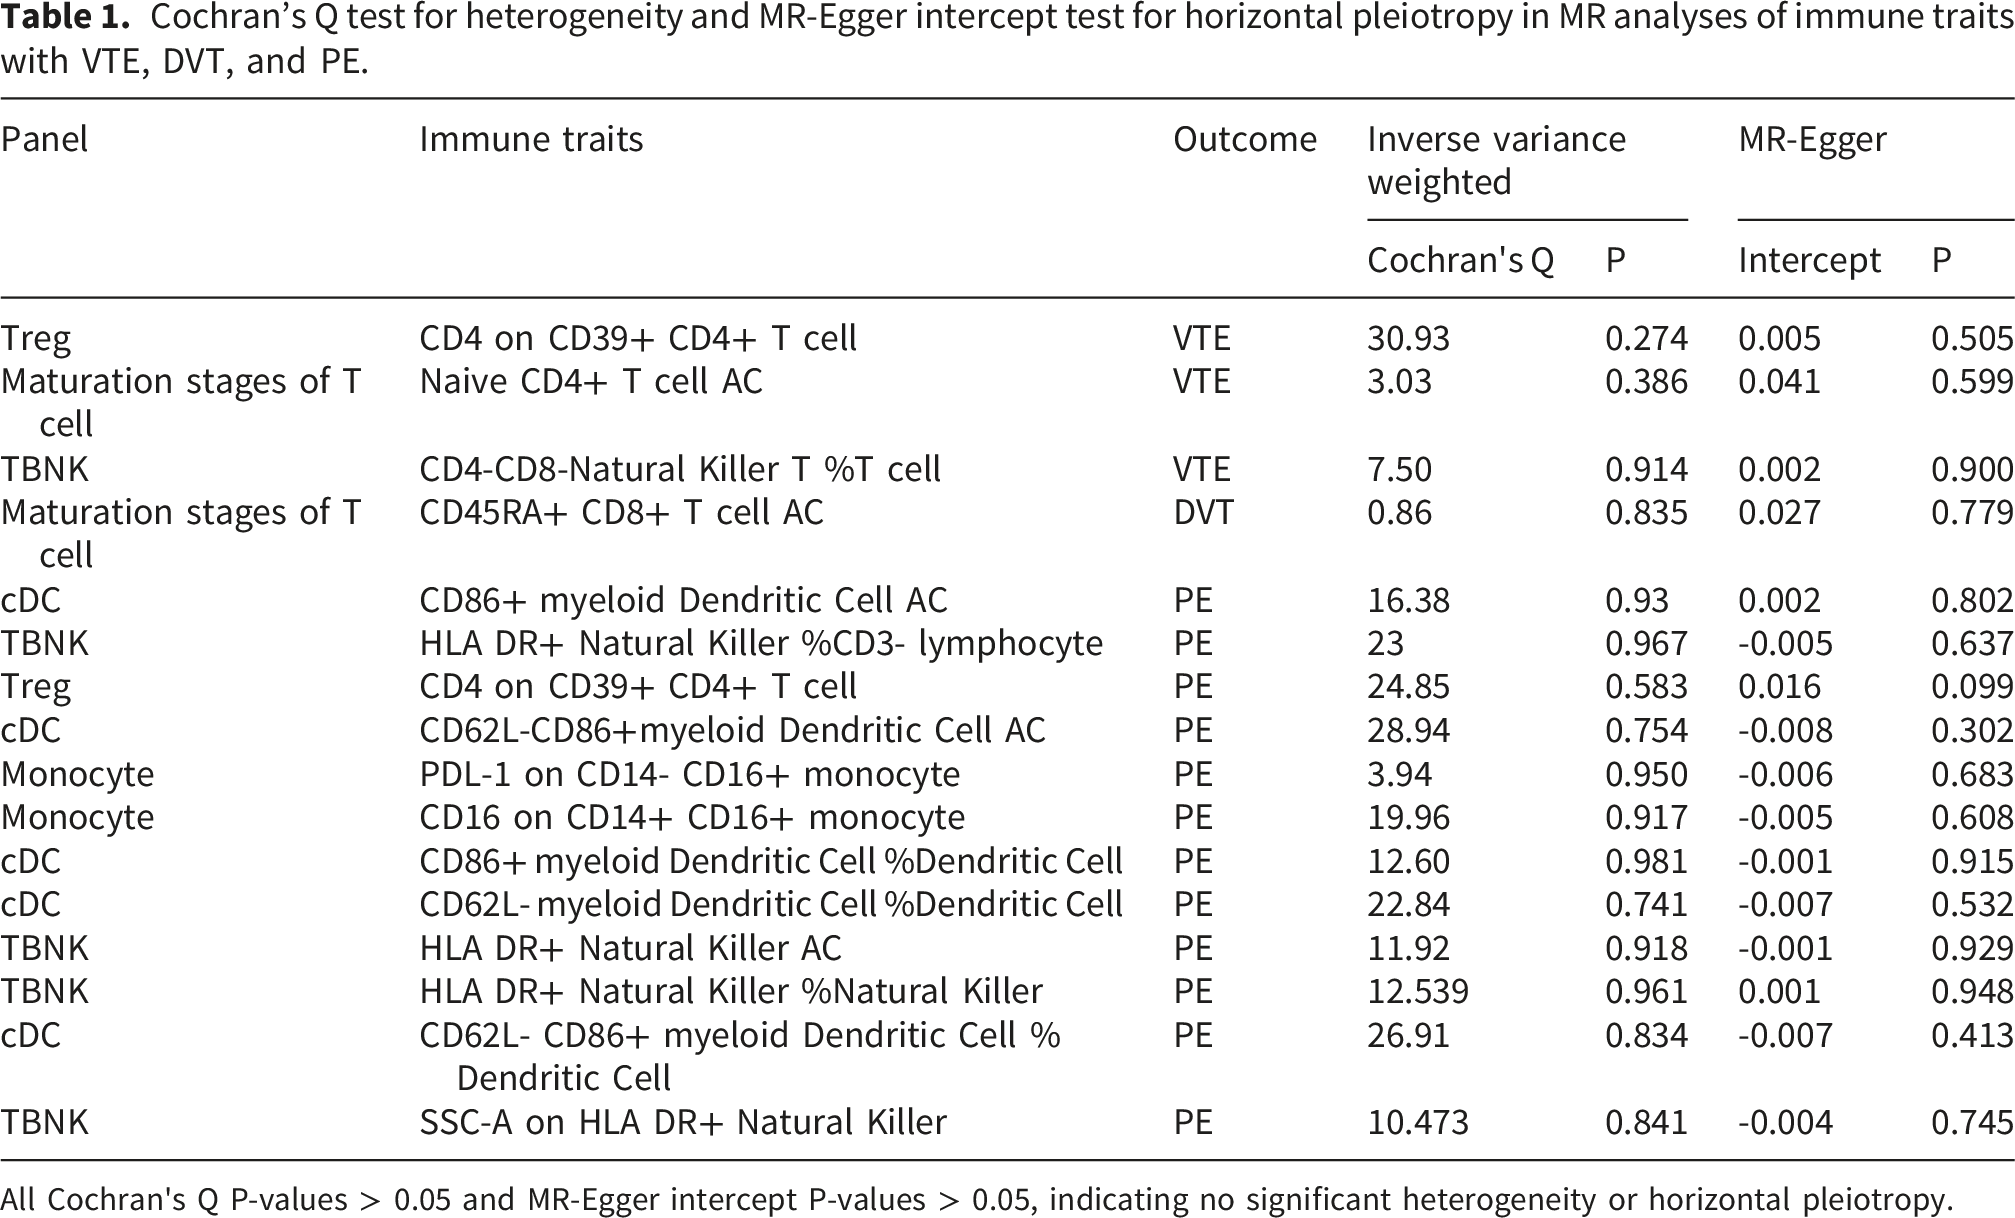
All Cochran's Q P-values > 0.05 and MR-Egger intercept P-values > 0.05, indicating no significant heterogeneity or horizontal pleiotropy.
Bayesian Colocalization Between Immunophenotypes and VTE
Bayesian colocalization analysis was performed to investigate the potential shared genetic basis between the genes underlying these immunophenotypes and VTE. The analysis identified a variant (rs3104369) in the HLA-DQA1 (human leukocyte antigen-DQ alpha 1) gene locus on chromosome 6 (chr6, GRCh38), within the major histocompatibility complex (MHC) region Figure 4. However, CD4 expression on CD39+CD4+ T cells and CD4-CD8- natural killer T cell %T cell did not demonstrate strong colocalization with VTE in this genomic region (PPH3 + PPH4 < 0.8), suggesting that these associations may be driven by distinct causal variants or confounded by linkage disequilibrium patterns. The comprehensive colocalization results are presented in Supplementary Table 8. Retrieval of rs3104369 from the gnomAD database confirmed a minor allele frequency (MAF) of 0.227 across all populations, indicating that this variant is not a rare mutation. The visualization of HLA-DQA1 gene expression (rs3104369) and the colocalization analysis with VTE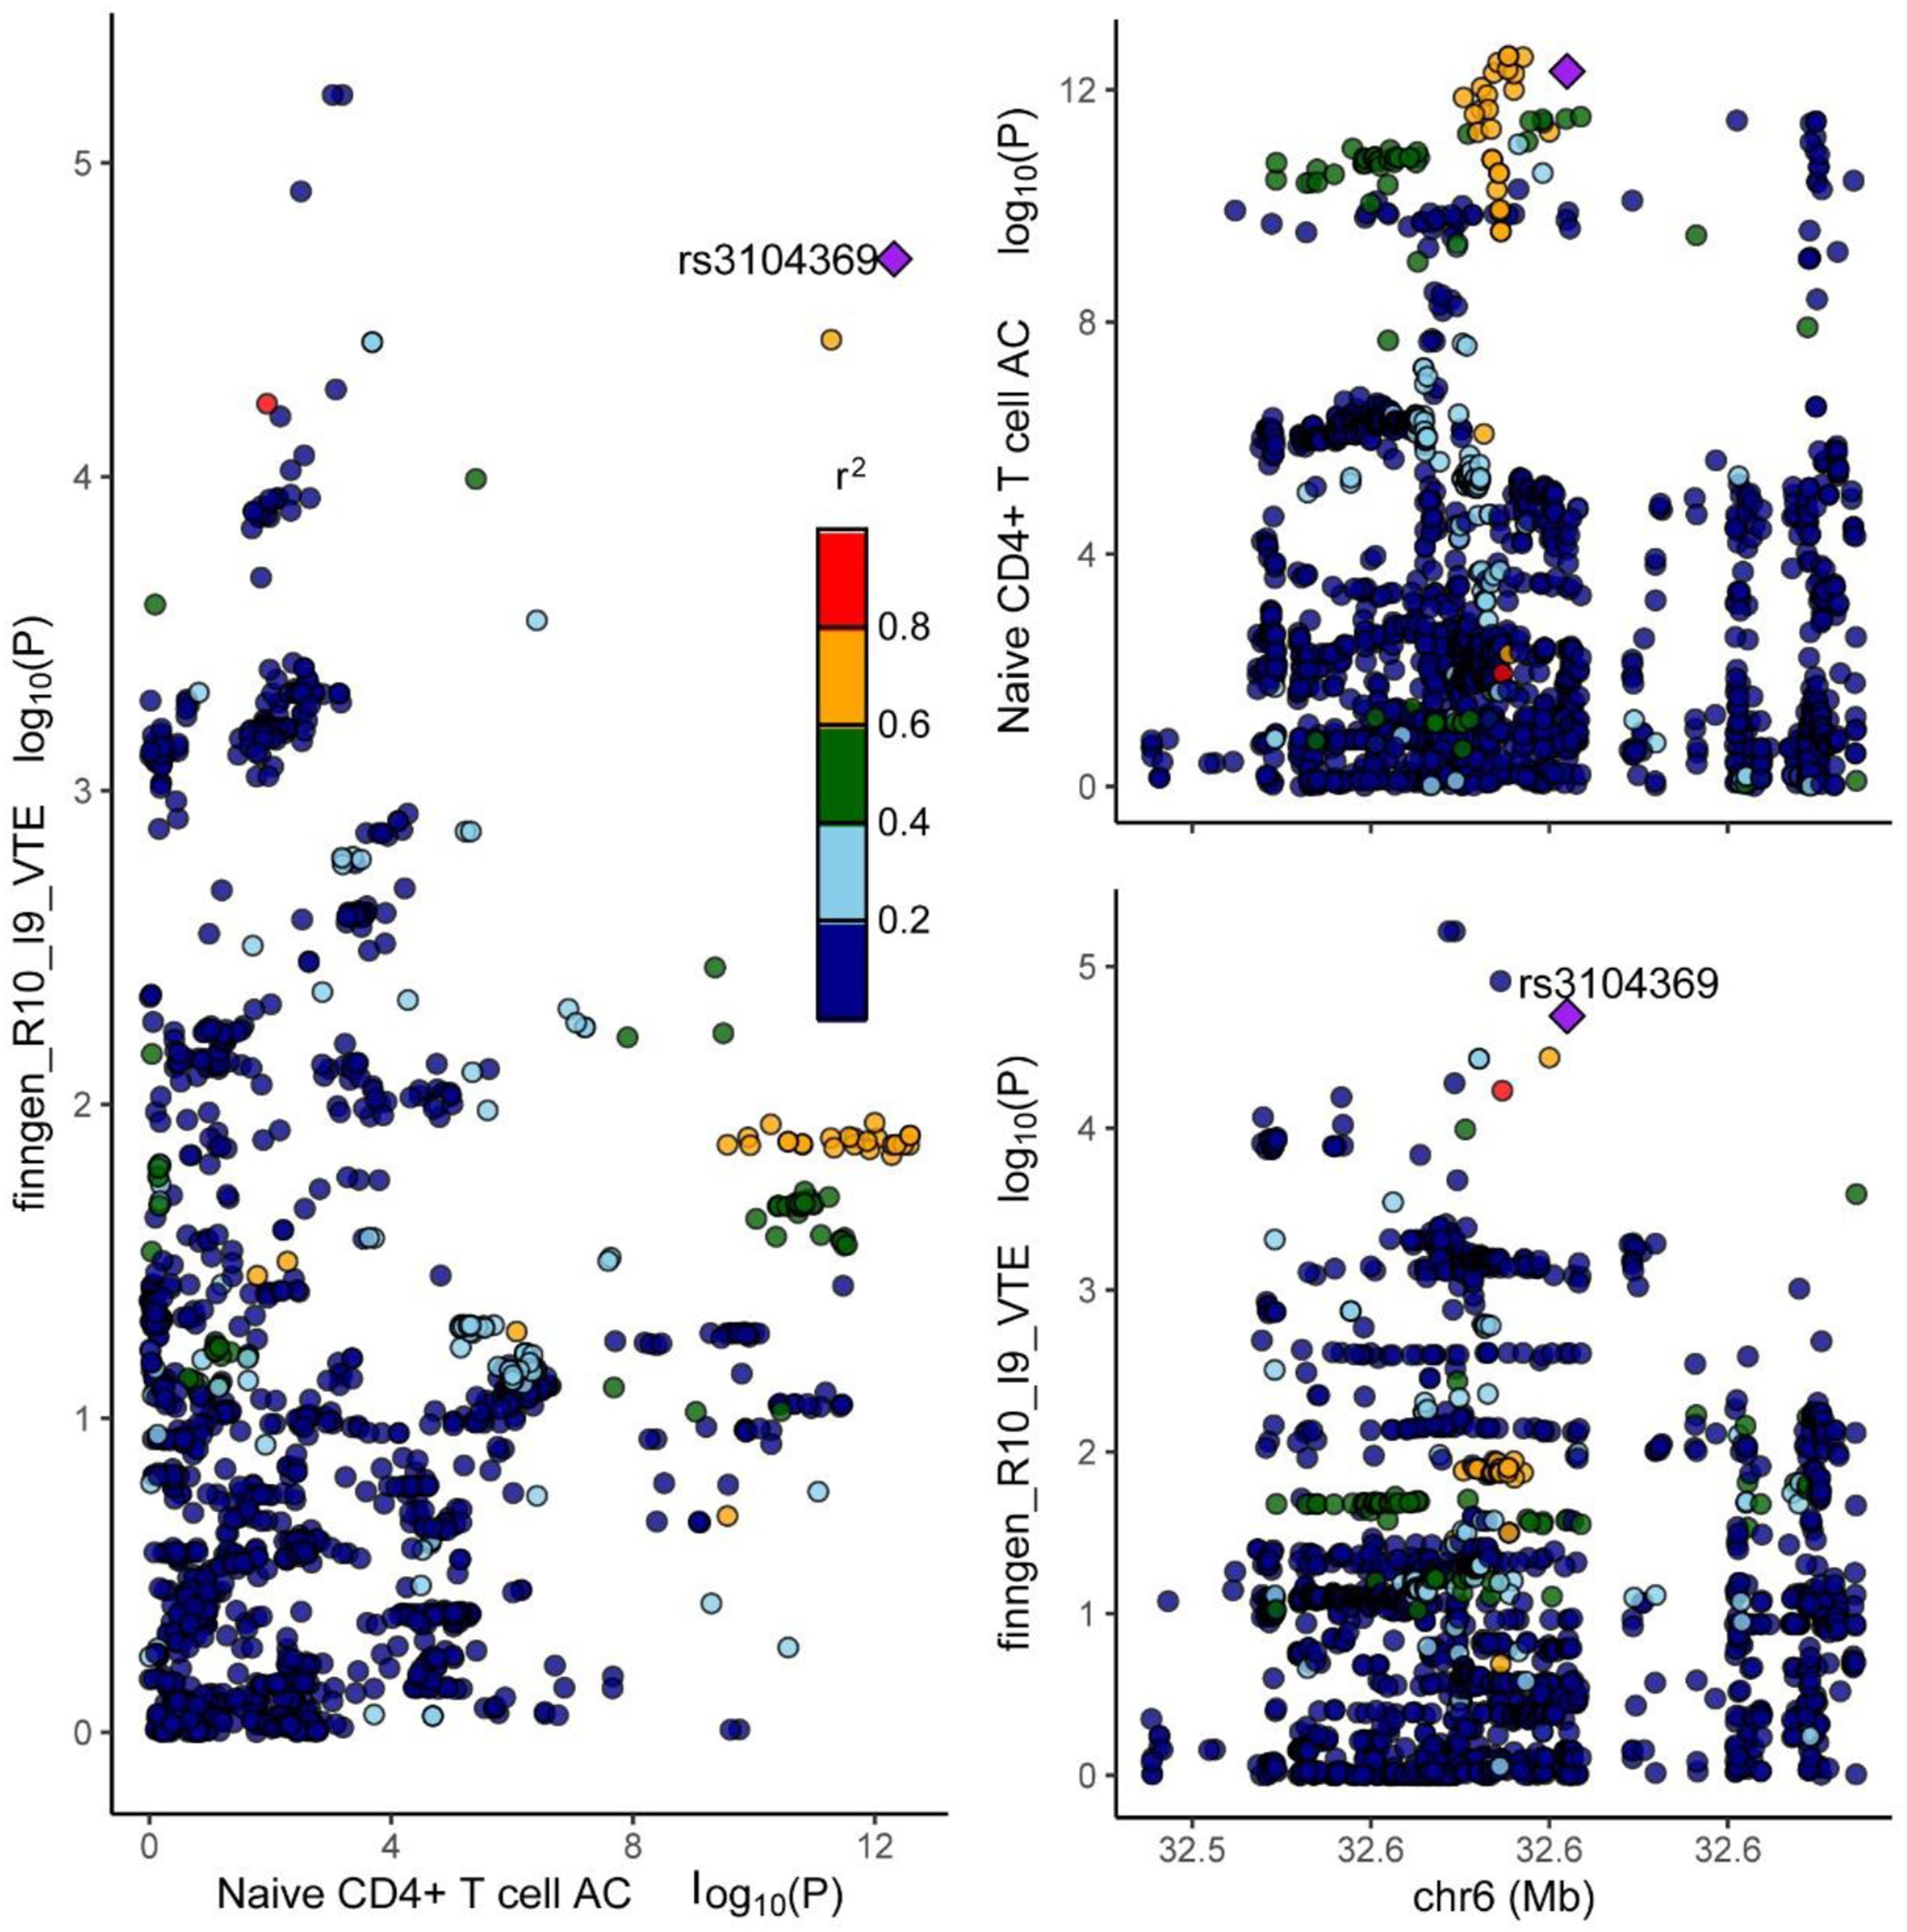
Discussion
To our knowledge, this study represents the first investigation to employ a two-sample Mendelian randomization framework integrated with Bayesian colocalization to examine potential causal relationships between immune cell phenotypes and VTE, DVT, and PE. Genetic evidence supporting potential causal associations was identified between cDC, Treg, TBNK-panel immune cells, and T cell maturation stages and VTE, DVT, and PE. Importantly, reverse MR analyses indicated the absence of significant bidirectional causal relationships for VTE and DVT associated immune cell phenotypes, strengthening the directionality of the inferred associations.
Our findings indicate that genetically predicted higher CD4 expression on CD39+CD4+ T cells is associated with reduced VTE risk. Existing literature indicates that regulatory T cells may inhibit thrombosis through the secretion of cysteine-rich acidic secretory proteins. 11 CD39 is an ectonucleoside triphosphate diphosphohydrolase that catalyzes the hydrolysis of ATP and ADP, thereby reducing prothrombotic purinergic signaling and contributing to vascular homeostasis. 30 Although the mechanism by which CD4 influences VTE remains unclear, CD4 may be pivotal in the process by which Tregs inhibit VTE, consistent with current findings. While our data cannot elucidate the precise downstream mechanism, these established biological properties of CD39 and CD4+ Tregs provide a plausible hypothesis-generating framework within which CD4 expression may be functionally relevant to VTE regulation.
We found that genetically predicted higher levels of naive CD4+ T cells and CD4-CD8-natural killer T%T cells were associated with a decreased risk of VTE. NK cells have been reported to promote the secretion of immunosuppressive regulatory factors in immune thrombocytopenia, 31 and to secrete TNF-α, 32 which has been associated with thrombus contraction and upregulation of matrix metalloproteinases MMP-2 and MMP-9 in thrombus-resident macrophages, potentially facilitating thrombus regression. 33 Furthermore, NK cells have been reported to promote T cell proliferation, 34 and T cells have been implicated in thrombus resolution. One hypothetical mechanism by which NKT cells may reduce VTE risk is through cytotoxic clearance of infected or malignant cells,35,36 which could indirectly reduce procoagulant factor release from damaged cells.
Our findings provide genetic evidence suggesting that genetically predicted higher levels of CD45RA+CD8+ T cells are associated with reduced DVT risk.Interleukin-15 (IL-15) has been reported to regulate the proliferation, activation, and migratory capacity of CD45RA+CD8+ T cells. 37 One hypothetical mechanism is that these cells may potentially exert antithrombotic effects through the secretion of interferon-gamma (IFN-γ) and TNF-α following IL-15 activation. 38 IFN-γ has been shown to induce mesenchymal stromal cells to produce IL-6 39 and to upregulate CCL2 (C-C motif chemokine ligand 2), which may promote fibrin degradation, macrophage recruitment, and increased matrix metalloproteinase (MMP) and plasminogen activator urokinase (PLAU) expression at sites of thrombosis. 40 Our results indicate that genetically predicted higher levels of CD86+ myeloid dendritic cell AC and CD86+ myeloid dendritic DC%DC were associated with increased PE risk. Conventional dendritic cells (cDCs) have been reported to stimulate NK cell activation and IFN-γ production under certain pathological conditions. 41 IFN-γ may inhibit thrombolysis by downregulating MMP-9 and vascular endothelial growth factor expression and through antiangiogenic effects. 42 Our findings provide genetic evidence consistent with this association, which necessitates further functional validation in vitro and in vivo.
Five immune cell phenotypes demonstrated genetic evidence of potential negative associations with PE, representing potentially novel candidate targets for its prevention and treatment. Among these, PDL-1 expression on CD14-CD16+ (non-classical) monocytes and CD16 expression on CD14+CD16+ monocytes are classified as monocyte-lineage phenotypes. 18 Nonclassical monocytes (CD14-CD16+) have been reported to phagocytose apoptotic vascular endothelial cells via the Toll-like receptor 7 (TLR7) pathway, potentially contributing to vascular protection and stability. 43 CD16+ monocytes secrete TNF-α and IL-12,44,45 and TNF-α has been associated with antithrombotic activity that may inhibit thrombus formation.
HLA-DR+ NK% CD3− lymphocytes and HLA-DR+ NK% NK cells belong to the major histocompatibility complex (MHC) class II antigen-presenting family, expressed predominantly on antigen-presenting cells including B cells, dendritic cells, and monocytes. 46 Elevated HLA-DR expression is generally indicative of increased immune cell activation. 47 HLA-DR+ NK cells have been reported to promote the activation and proliferation of antigen-specific T cells, 48 and it has been hypothesized that activated T cells and HLA-DR+ NK cells may promote thrombolysis through TNF-α secretion. PD-L1 is a type I transmembrane glycoprotein and a ligand for programmed cell death protein 1 (PD-1), expressed on macrophages, T lymphocytes, and epithelial cells, 49 and functions to attenuate immune activation. 50
This study has several limitations requiring cautious interpretation. First, both the exposure GWAS (immune cell phenotypes) and the outcome GWAS comprised individuals of European ancestry. While restricting analyses to matched ancestries is methodologically appropriate to minimize population stratification bias, it limits the generalizability of these findings to non-European populations. Validating the identified causal relationships in independent East Asian and other non-European cohorts represents a critical priority for future research, contingent upon the availability of adequately powered population-specific GWAS data. Second, although the two-sample MR design substantially mitigates confounding and reverse causation compared to conventional observational approaches, potential unmeasured or residual confounding cannot be entirely excluded, particularly for phenotypes with limited genetic instrument coverage. Third, while this study identifies robust genetic associations between specific immune cell phenotypes and VTE outcomes, the underlying biological mechanisms remain to be determined. Additional in vitro and in vivo experimental studies are required to delineate the specific molecular pathways through which these immune cell phenotypes regulate thrombotic risk.
Conclusion
This study provides Mendelian randomization evidence supporting a causal relationship between specific immunophenotypes and the risk of VTE, DVT, and PE. These identified immunophenotypes serve as notable candidates that require future in vitro and in vivo functional validation before their true potential for risk stratification or therapeutic intervention can be established.
Supplemental Material
Supplemental Material - The Association Between Immune Cells and Venous Thromboembolism: A Causal Inference Based on Mendelian Randomization
Supplemental Material for The Association Between Immune Cells and Venous Thromboembolism: A Causal Inference Based on Mendelian Randomization by Jingyi Zhu, Jiamei Chen, Yanxiao Wang, Xiaodong Xu, Feiyang Wang, Yixin Zhu, Qi Zhang, and Lin Zhu in Clinical and Applied Thrombosis/Hemostasis.
Footnotes
Acknowledgements
We sincerely thank the participants and investigators involved in the FinnGen study for their contributions, whose dedication and collaborative efforts enabled the generation of population-scale genomic and health data critical to this research, for their contributions. We further acknowledge Editage (www.editage.cn) for professional English language editing services, which enhanced the clarity and precision of this manuscript.
Ethical Considerations
All data employed in this study are obtainable through public channels, with the consent of relevant participants and ethical approval.
Consent to Participate
All data employed in this study are obtainable through public channels, with the consent of relevant participants.
Funding
The authors disclosed receipt of the following financial support for the research, authorship, and/or publication of this article: The current work received support from the Start-up Funding of Hangzhou Normal University, with grant number 4255C50224204010.
Declaration of conflicting interests
The authors declared no potential conflicts of interest with respect to the research, authorship, and/or publication of this article.
Data Availability Statement
The public data used in this experiment analysis is sourced from URLs: https://www.ebi.ac.uk/gwas/downloads/summary-statistics (GCST0001391 to GCST0002121) and ![]() .
.
Supplemental Material
Supplemental material for this article is available online.
References
Supplementary Material
Please find the following supplemental material available below.
For Open Access articles published under a Creative Commons License, all supplemental material carries the same license as the article it is associated with.
For non-Open Access articles published, all supplemental material carries a non-exclusive license, and permission requests for re-use of supplemental material or any part of supplemental material shall be sent directly to the copyright owner as specified in the copyright notice associated with the article.