
Abstract
Background
Lower limb fractures with peripheral deep venous thrombosis (DVT) are common, yet unified stratified treatment standards are lacking. Quantifying thrombus burden guides decisions like inferior vena cava (IVC) filter implantation or anticoagulation. Existing scoring systems rarely integrate peripheral vein anatomy and imaging features, limiting clinical utility.
Objective
To develop a dual-dimensional scoring scale for thrombus burden quantification and validate its value in guiding stratified treatment.
Methods
A retrospective study of 68 fracture-related DVT patients (Suzhou TCM Hospital, Nov 2022-Nov 2023) was conducted. A 0-25 point scale integrating 7 peripheral veins and muscular venous plexus features was designed. Receiver operating characteristic (ROC) analysis identified the optimal IVC filter cutoff; patients were split into filter group (≥4 points, n = 21, filter + anticoagulation) and anticoagulation group (<4 points, n = 47, single anticoagulation). 1:2 PSM eliminated baseline confounding; adverse events, scores and coagulation indices were compared.
Results
No adverse events or filter-related complications occurred. Both groups had significant post-treatment score and D-dimer reductions (all P < .05). ROC confirmed 4 points as optimal cutoff (AUC = 0.923). The filter group had lower hemoglobin and higher D-dimer (P < .05), with no PT/APTT differences. All filter group patients had residual thrombi, cord-like residuals in those with pre-treatment scores >5 points.
Conclusion
This scale effectively quantifies thrombus burden, aids stratified DVT treatment, and provides a reliable basis for preoperative IVC filter implantation in orthopedic patients, with key clinical value.
Keywords
Introduction
Deep venous thrombosis (DVT) is a common acute complication in surgical populations, with its most devastating consequence being fatal pulmonary embolism (PE) from thrombus dislodgement.1–3 Patients with lower limb fractures face a DVT incidence of up to 24.1% due to vascular endothelial injury, venous stasis, and post-traumatic hypercoagulability, 4 alongside heightened PE risk 5 and a post-thrombotic syndrome (PTS) incidence exceeding 23%. 6 PTS-induced chronic swelling, pain, and even ulcers restrict daily function, often leading to labor loss and psychological distress (eg, anxiety), forming a vicious cycle that impairs long-term quality of life. 7
Accurate thrombus burden assessment and stratified treatment are pivotal to improving prognosis, yet current tools (Caprini, Wells, Autar scales) have critical limitations. The Caprini scale lacks applicability to Asian populations 8 ; the Autar scale, despite higher DVT prediction sensitivity, 9 is subjective in mobility assessment, omits biomarkers, and fails to quantify thrombus burden. These scales also neglect fracture-specific factors (eg, fracture type, comorbidities like diabetes)10–12 and cannot dynamically quantify formed thrombi, 13 leading to empirical treatment decisions-especially for distal DVT (eg, anterior tibial vein thrombosis).
To address these gaps, we developed a novel peripheral DVT burden scoring scale (0-25 points) that integrates peripheral vein anatomical characteristics (7 key veins + muscular venous plexus, weighted by thrombus dislodgement risk) and imaging features (CTV/Doppler-derived thrombus length, occlusion degree, mural thrombus). The scoring weights were rationally assigned based on published evidence and the clinical practice guidelines for lower extremity DVT14,15: the popliteal vein, as a major deep venous trunk of the lower extremity with larger caliber and higher blood flow velocity, was assigned higher weights (3 points for thrombus length <50%, 6 points for ≥50%) due to its significantly elevated risk of thrombus dislodgement and subsequent PE14,15; small-caliber peripheral veins (anterior/posterior tibial, peroneal veins) were given lower weights (1 point for <50%, 2 points for ≥50%) with an additional 1 point for thrombus diameter ≥7 mm, based on evidence that larger-diameter thrombi in peripheral veins are more prone to venous occlusion and dislodgement 16 ; the muscular venous plexus was assigned 1 point only for the presence of thrombus, as thrombi here are mostly microthrombi with low dislodgement risk and are included merely for comprehensive thrombus burden quantification. 17 This design targets lower limb fracture patients, reduces subjectivity, and the clinical threshold for inferior vena cava (IVC) filter consideration was determined via receiver operating characteristic (ROC) curve analysis based on thrombus dislodgement risk data.
This study aimed to validate the scale's efficacy in guiding stratified treatment (anticoagulation alone vs filter + anticoagulation) and provide an objective basis for personalized care. If validated, the scale could standardize thrombus assessment for orthopedic/vascular clinicians and inform similar tools for other high-risk populations, refining DVT treatment algorithms.
Materials and Methods
Study Population
This was a single-center retrospective observational study conducted at Suzhou TCM Hospital Affiliated to Nanjing University of Chinese Medicine, enrolling 68 adult patients (age > 18 years) with isolated lower extremity long bone fractures complicated by peripheral lower extremity deep venous thrombosis (DVT) from November 2022 to November 2023. Eligible fracture types included femoral shaft fracture, tibial-fibular fracture, and ankle fracture; the distribution of fracture types in the two groups was shown in Table S1 (Supplemental Material). All patients were scheduled for elective orthopedic surgery, with peripheral DVT confirmed by a combination of duplex ultrasound and ascending lower extremity deep venography. Additional enrollment requirements included complete clinical, imaging, and follow-up data, no severe underlying diseases (eg, end-stage organ failure, advanced cardiovascular/cerebrovascular disease), and intact cognitive function (assessed independently by two attending physicians) to provide voluntary preoperative informed consent.
The study was approved by the Ethics Committee of Suzhou TCM Hospital Affiliated to Nanjing University of Chinese Medicine (Approval No.: 2025018) and strictly conducted in accordance with the principles of the Declaration of Helsinki (1964). All patients provided written informed consent that explicitly included clauses for the use of clinical research data and publication of de-identified imaging materials; all clinical images were anonymized by removing identifiable personal information to prevent privacy breaches.
Inclusion Criteria
Isolated lower extremity long bone fractures (femoral shaft, tibial-fibular, ankle) confirmed by x-ray plain film;
Peripheral lower extremity DVT diagnosed by duplex ultrasound and ascending lower extremity deep venography (thrombus limited to calf and popliteal vein segments, no extension to femoral/iliac vein or inferior vena cava);
Age > 18 years, with complete clinical, laboratory, and imaging data;
No severe underlying diseases (Child-Pugh A/B for liver function, estimated glomerular filtration rate ≥30 mL/min/1.73 m2 for renal function);
Normal cognitive function with the ability to provide preoperative informed consent, and signed informed consent documents retained in the medical record;
Written informed consent for study participation and follow-up.
Exclusion Criteria
History of prior lower extremity DVT, pulmonary embolism (PE), or long-term anticoagulant therapy (≥ 3 months) before admission;
Concurrent hemorrhagic diseases (eg, hemophilia, active gastrointestinal bleeding) or bleeding tendency;
Severe liver/kidney dysfunction (Child-Pugh class C, eGFR < 30 mL/min/1.73 m2) or hematological system diseases;
Histologically confirmed malignant tumor (any stage) or severe infection (eg, sepsis, osteomyelitis) requiring intravenous antibiotic therapy;
Multiple fractures or polytrauma involving ≥ 2 body systems, or open/comminuted fractures with active bleeding;
Thrombus extending to the femoral vein, iliac vein, or inferior vena cava (requiring additional interventional therapy beyond IVC filter implantation);
Allergic reactions to low-molecular-weight heparin (LMWH), rivaroxaban, or iodinated contrast agents;
Poor treatment compliance (interrupted anticoagulation therapy) or incomplete follow-up data;
Severe treatment-related complications (eg, major bleeding, filter migration) during hospitalization or disease progression necessitating treatment regimen modification.
Grouping Based on the Novel Thrombosis Scoring Scale
To determine the optimal clinical cutoff value for guiding IVC filter implantation, ROC curve analysis was performed with thrombus dislodgement risk (residual thrombus in IVC filter as the surrogate outcome, given no PE events in this study) as the dependent variable. The ROC curve and calibration curve for cutoff value validation were shown in Figure 1. The analysis yielded an area under the curve (AUC) of 0.923 (95% CI: 0.865-0.981), and the maximum Youden's index (0.846) corresponded to a cutoff value of 3.87. For clinical practicability, this value was rounded to 4 points as the decision threshold for IVC filter implantation.

ROC curve and calibration curve for the novel thrombosis scoring scale in predicting thrombus dislodgement risk. A, The receiver operating characteristic (ROC) curve of the scale for predicting thrombus dislodgement risk (residual thrombus in the inferior vena cava filter as the surrogate outcome) yielded an area under the curve (AUC) of 0.923 with a 95% confidence interval (95% CI) of 0.865-0.981. The maximum Youden's index corresponded to an optimal cutoff value of 3.87, which was rounded to 4 points for clinical decision-making. B, The calibration curve showed good consistency between the predicted thrombus dislodgement risk by the novel scale and the actual observed outcome, indicating the reliable predictive performance of the scale.
Patients were stratified into two groups using the novel thrombosis scoring scale (0-25 points, integrating anatomical characteristics of 7 peripheral veins + muscular venous plexus and imaging features of thrombus, detailed scoring rules in Table 1):
Filter Group: Preoperative thrombosis score ≥ 4 points (high thrombus burden, n = 21), treated with IVC filter implantation combined with anticoagulation; Anticoagulation Group: Preoperative thrombosis score < 4 points (low-to-moderate thrombus burden, n = 47), treated with anticoagulation monotherapy.
Novel Thrombus Burden Scoring Scale.
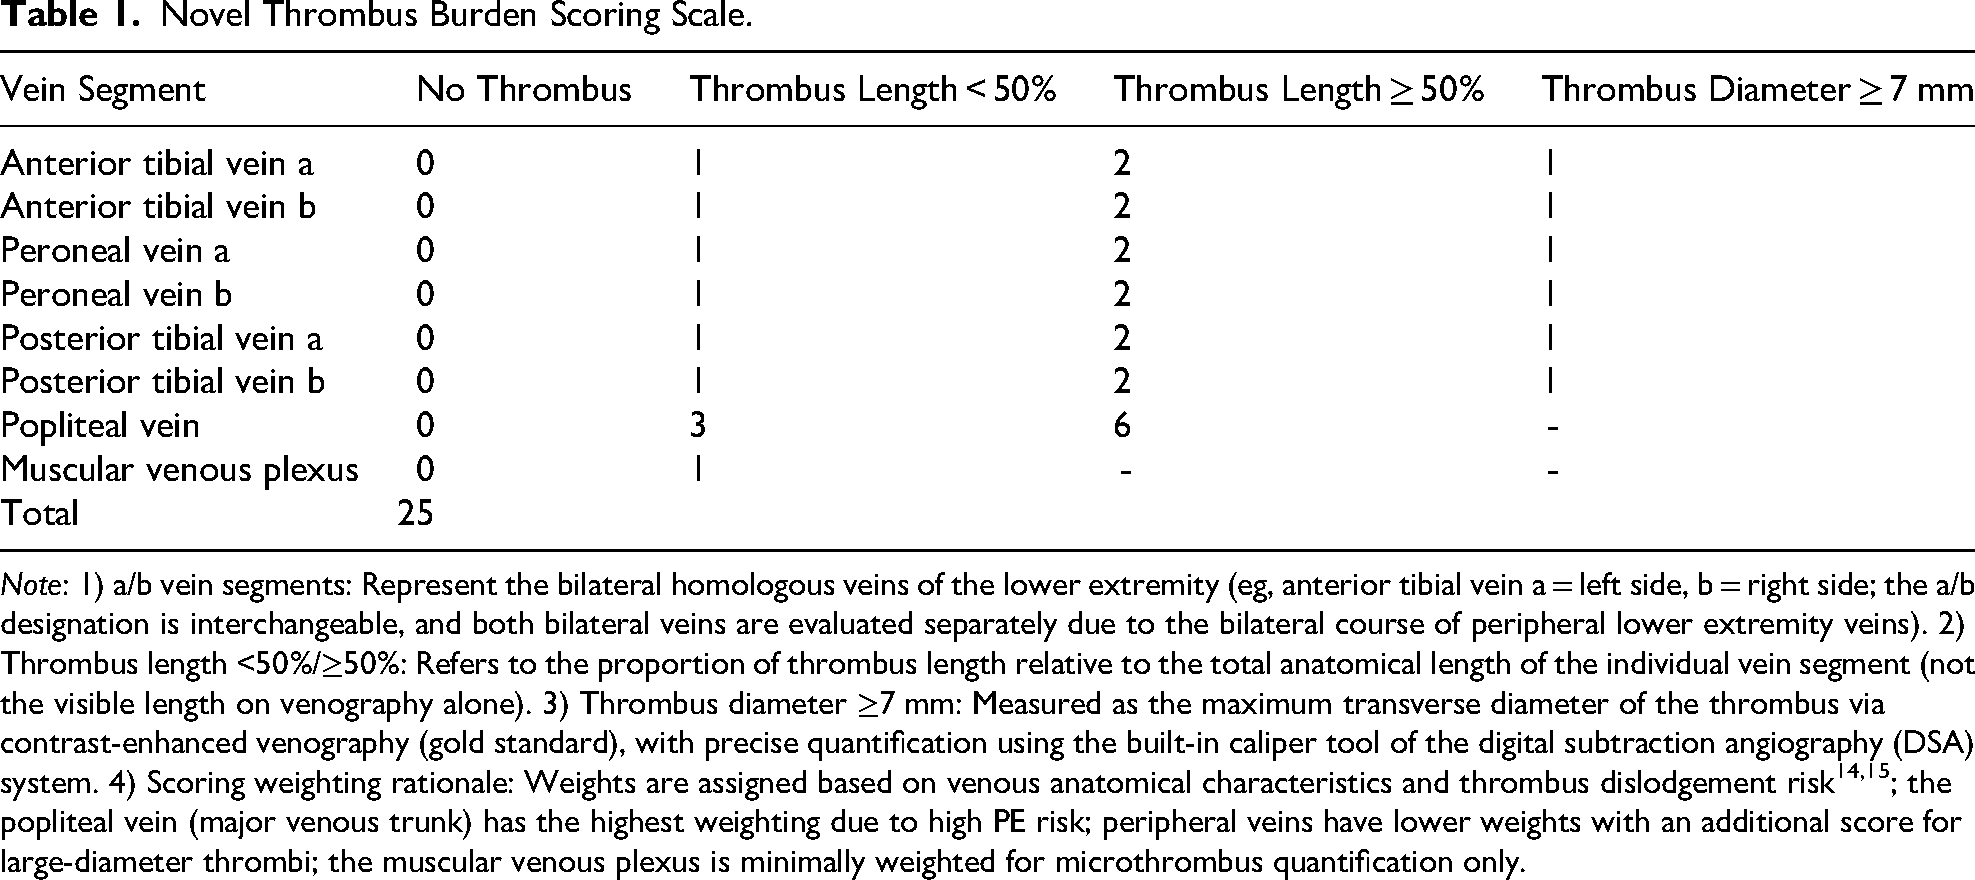
Note: 1) a/b vein segments: Represent the bilateral homologous veins of the lower extremity (eg, anterior tibial vein a = left side, b = right side; the a/b designation is interchangeable, and both bilateral veins are evaluated separately due to the bilateral course of peripheral lower extremity veins). 2) Thrombus length <50%/≥50%: Refers to the proportion of thrombus length relative to the total anatomical length of the individual vein segment (not the visible length on venography alone). 3) Thrombus diameter ≥7 mm: Measured as the maximum transverse diameter of the thrombus via contrast-enhanced venography (gold standard), with precise quantification using the built-in caliper tool of the digital subtraction angiography (DSA) system. 4) Scoring weighting rationale: Weights are assigned based on venous anatomical characteristics and thrombus dislodgement risk14,15; the popliteal vein (major venous trunk) has the highest weighting due to high PE risk; peripheral veins have lower weights with an additional score for large-diameter thrombi; the muscular venous plexus is minimally weighted for microthrombus quantification only.
The anatomic location of various veins and corresponding scale scores in representative cases were shown in Figure 2. Propensity Score Matching (PSM) with a 1:2 matching ratio was further performed to eliminate baseline confounding, using age, body mass index (BMI), fracture site, hypertension/diabetes history, and preoperative D-dimer level as matching covariates. The matched cohort included 21 patients in the Filter Group and 42 patients in the Anticoagulation Group, with no significant baseline differences between groups (all P > .05, Table 2).

Anatomic location of various veins and representative score. (A) Anatomic location of various veins. (B) 0 point of various veins. (C) Popliteal vein thrombus length <50%, score is 3 points. (D) Muscular venous plexus core score is 1 point, peroneal vein thrombus length <50% score is 1 point, diameter ≥7 mm score is 1 point, total score is 3 points. (E) Each anterior tibial vein thrombus length >50%, total score 4 points.
Baseline Demographic and Clinical Characteristics of the Two Groups (After Propensity Score Matching, PSM, 1:2).
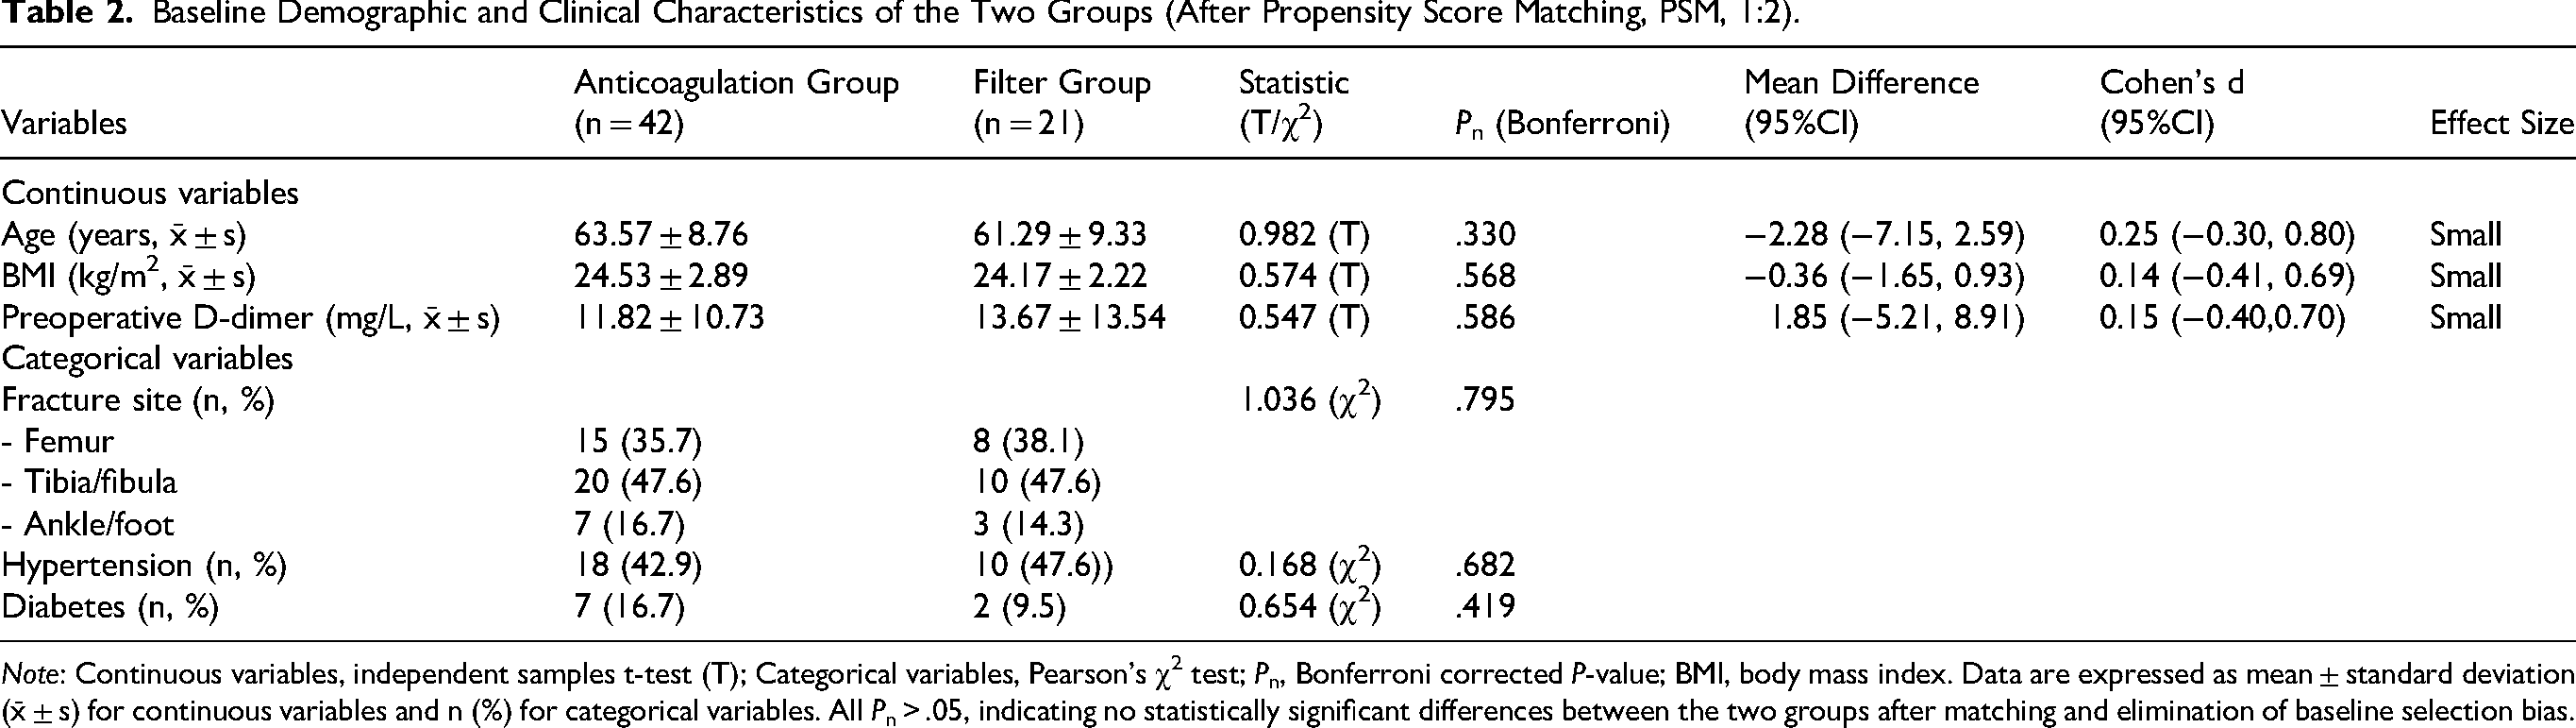
Note: Continuous variables, independent samples t-test (T); Categorical variables, Pearson's χ2 test; Pn, Bonferroni corrected P-value; BMI, body mass index. Data are expressed as mean ± standard deviation (x̄ ± s) for continuous variables and n (%) for categorical variables. All Pn > .05, indicating no statistically significant differences between the two groups after matching and elimination of baseline selection bias.
Preoperative Imaging and Scale Reliability Validation
Preoperative Venography Assessment
Ascending lower extremity deep venography was the exclusive imaging modality for thrombus burden quantification and scale scoring in all patients, to ensure the accuracy and uniformity of scoring criteria. The standardized venography procedure was as follows:
A 24 G scalp needle was punctured into the dorsum of the affected foot and connected to a high-pressure injector; A tourniquet was applied 5 cm below the knee joint to block superficial venous reflux, ensuring contrast agent filling of the calf deep venous plexus; The contrast agent (iopromide, 370 mgI/mL) was injected at a rate of 3-5 mL/s, and dynamic fluoroscopy was performed to visualize the popliteal, tibial, and peroneal veins; The tourniquet was released, and the contrast agent flow rate was increased to 8-10 mL/s for iliac vein angiography to rule out proximal thrombus extension; Two senior vascular surgeons independently graded thrombus extent (length, occlusion degree) and assigned scores using the novel thrombosis scale (Table 1) based on venographic images.
Imaging Modality Consistency Verification
To verify the comparability of duplex ultrasound and venography, 30 randomly selected patients underwent concurrent ascending deep venography and duplex ultrasound preoperatively. Two senior vascular surgeons, blinded to each other's assessment results, independently evaluated thrombus length and occlusion degree using both modalities. The intraclass correlation coefficient (ICC) was calculated for thrombus length, and the Kappa coefficient for thrombus occlusion degree, to confirm the consistency between the two imaging methods.
Scale Reliability Validation
For inter-rater reliability analysis, venographic images of 20 randomly selected patients were independently scored by two senior vascular surgeons who were blinded to all study outcomes (treatment regimens, follow-up results, laboratory indices). ICC was calculated to evaluate the consistency of total thrombosis scores and individual vein segment scores between the two raters. For internal consistency analysis, Cronbach's α coefficient was calculated for the overall scale and its subdimensions (anterior tibial vein, posterior tibial vein, peroneal vein, popliteal vein, muscular venous plexus).
During follow-up, duplex ultrasound was used for preliminary thrombus screening in the Anticoagulation Group; if ultrasound indicated thrombus non-resolution or suspected progression, ascending lower extremity deep venography was performed for re-scoring to maintain consistent scoring criteria throughout the study. The dynamic changes in thrombosis scores of the two groups during follow-up were shown in Figure 3.

The changes in thrombus scores between the two groups of patients. Data are expressed as mean ± standard deviation. # indicates comparison between the current data and the data before treatment in the same group, P < .05; * indicates comparison between the two groups at the same time point, P < .05.
Treatment Regimens
All treatment regimens were formulated and implemented by the same team of vascular and orthopedic surgeons, with anticoagulation therapy initiated uniformly at 12 h after orthopedic surgery to balance anticoagulant efficacy and surgical bleeding risk.
Filter Group (n = 21)
IVC filter implantation: Performed preoperatively via the contralateral femoral vein puncture. A 4F catheter sheath was inserted for iliac vein and IVC angiography to confirm the renal vein ostium position; an Aegisy filter (Xianjian (Shenzhen) Technology Co., Ltd) was then placed 1.0-1.5 cm below the renal vein ostium to prevent thrombus dislodgement and PE.
Anticoagulation therapy: Subcutaneous injection of LMWH (5000 U) every 12 h starting at 12 h after orthopedic surgery, for 14 consecutive days.
Filter retrieval and post-discharge therapy: Serial ascending lower extremity venography was performed on days 3 and 14 post-treatment to assess thrombus resolution and re-evaluate the thrombosis score. On day 14, the IVC filter was retrieved via the contralateral femoral vein using a snare if thrombus stability was confirmed. The type and volume of residual thrombus trapped in the IVC filter during retrieval were recorded, and the correlation between preoperative score intervals and residual thrombus types was shown in Figure 4 and Table 3. After discharge, oral rivaroxaban (20 mg once daily) was continued for at least 3 months.
Anticoagulation Group (n = 47)
Anticoagulation monotherapy: No IVC filter implantation. Subcutaneous injection of LMWH (5000 U) every 12 h starting at 12 h after orthopedic surgery, for 14 consecutive days.
Follow-up monitoring: Serial duplex ultrasound was performed on days 3 and 14 post-treatment to monitor for thrombus progression.
Post-discharge therapy: After discharge, oral rivaroxaban (20 mg once daily) was continued for at least 3 months, with ascending lower extremity deep venography performed at 1 and 3 months post-discharge for scale re-scoring.
Data Collection and Follow-Up
Laboratory Indicator Collection
Venous blood samples (5 mL, fasting) were collected from all patients at baseline (pre-treatment) and 3, 7, 14 days post-treatment, as well as 1 and 3 months post-discharge. The following indices were measured using standard laboratory methods: hemoglobin (Hb), prothrombin time (PT), activated partial thromboplastin time (APTT), D-dimer, and fibrinogen degradation product (FDP). All laboratory tests were completed in the central laboratory of Suzhou TCM Hospital, with internal quality control performed for each batch of tests. The baseline demographic and clinical characteristics of the two groups were shown in Table 4.

The residual thrombi in the filter when the filter was removed from patients in the filter group. Photo 1 shows the residual thrombus in a patient with a pre-treatment score of 5 points, which appears as residue-like. Without filter protection, the risk of pulmonary embolism is low. Photo 2 shows the residual thrombus in a patient with a pre-treatment score of 8 points, and Photo 3 shows the residual thrombus in a patient with a pre-treatment score of 13 points, both of which appear as cord-like thrombi. Without filter protection, the risk of pulmonary embolism is high.
Clinical Outcomes Across Different Preoperative Thrombosis Score Intervals.

Note: a Total residual thrombus in filter group = 7; Effect size for D-dimer/thrombus resolution time versus 0-3 points; All between-interval Pn < .001.
Baseline Demographic and Clinical Characteristics of the Two Groups (Before Propensity Score Matching, PSM).

Note: Continuous variables, independent samples t-test (T); Categorical variables, Pearson's χ2 test; Pn, Bonferroni corrected P-value; BMI, body mass index; LMM, Linear Mixed Models; C, Column association coefficient (<0.2 = Weak, 0.2∼0.4 = Moderate, >0.4 = Strong). Data are expressed as mean ± standard deviation (x̄ ± s) for continuous variables and n (%) for categorical variables.
Imaging and Clinical Follow-Up
Filter Group: Ascending lower extremity deep venography was performed at 3, 14 days post-treatment to assess thrombus resolution and re-score the thrombosis scale (duplex ultrasound as auxiliary monitoring); IVC filter residual thrombus type and volume were recorded during filter retrieval on day 14 (Figure 4, Table 3). Outpatient follow-up was conducted at 1 and 3 months post-discharge, including lower extremity vascular ultrasound, D-dimer/FDP measurement, and scale re-scoring via venography.
Anticoagulation Group: Duplex ultrasound was performed at 3, 14 days post-treatment to monitor thrombus progression; ascending lower extremity deep venography was performed at 1 and 3 months post-discharge for scale re-scoring. Outpatient follow-up at 1 and 3 months post-discharge included the same laboratory and imaging assessments as the Filter Group.
All follow-up was completed by dedicated research nurses, with a standardized follow-up questionnaire to record clinical symptoms, treatment compliance, and adverse events.
Outcome Definition
Primary and secondary outcomes were pre-defined to standardize clinical efficacy evaluation and statistical analysis, with all outcomes assessed by investigators blinded to treatment grouping:
Primary outcome: Absolute change in thrombosis score at 14 days post-treatment (pre-treatment score minus 14-day post-treatment score), the core quantitative index reflecting thrombus burden reduction (dynamic changes shown in Figure 3). Secondary outcomes:
Dynamic changes in coagulation function indices (D-dimer, FDP, PT, APTT) at multiple time points (baseline, 3, 7, 14 days post-treatment, 1/3 months post-discharge); Temporal changes in hemoglobin levels to reflect treatment-related blood loss; Residual thrombus type (flocculent/cord-like) and volume in IVC filters (assessed during filter retrieval on day 14, Figure 4, Table 3); Adverse event rates, including PE, bleeding events (gingival bleeding, subcutaneous ecchymosis, hematuria, hematochezia), and IVC filter-related complications (migration, perforation, malposition).
Statistical Analysis
All data were analyzed using SPSS 26.0 (IBM Corp., Armonk, NY, USA) and R 4.3.1 (R Foundation for Statistical Computing, Vienna, Austria). Continuous data were expressed as mean ± standard deviation (x̄ ± s) if normally distributed, or median (interquartile range) [M (Q1, Q3)] if non-normally distributed; categorical data were presented as counts (percentages). A two-tailed P < .05 was considered statistically significant, with Bonferroni correction applied for multiple pairwise comparisons to control the family-wise error rate (FWER).
Baseline comparison: Independent samples t-test/Welch's t-test for normally distributed continuous data, Mann-Whitney U test for non-normally distributed continuous data, and Pearson's χ2 test/Fisher's exact test for categorical data (results shown in Table 4, Table S1). Cohen's d was calculated to quantify the effect size of between-group differences (0.2 = small, 0.5 = moderate, 0.8 = large) (Tables 2 and 4). Repeated measures data: Linear Mixed Models (LMM) were used for longitudinal data (thrombosis score, D-dimer, FDP, PT, APTT, Hb), which accounts for within-subject variability and missing data. The LMM included fixed effects (group, time, group × time interaction) and random intercepts for individual patients, with fracture site, surgery type, and time from injury to surgery as covariates to adjust for confounding (Tables 5, 6, 7, and 8). Scale validity and cutoff value: ROC curve analysis was performed to calculate AUC, 95% CI, and Youden's index for the optimal cutoff value of the scale (Figure 1); Hosmer-Lemeshow test was used to verify the calibration of the ROC curve (Figure 1). Pearson correlation analysis was used to evaluate the criterion validity of the scale (correlation between preoperative scale score and IVC filter residual thrombus volume/peak D-dimer level). Multivariate analysis: Multivariate linear regression was performed with the 14-day post-treatment thrombosis score change as the dependent variable, and treatment grouping, age, fracture type, and preoperative D-dimer level as independent variables, to explore the independent effect of treatment grouping on thrombus burden reduction. Reliability analysis: Intraclass correlation coefficient (ICC) was used to evaluate inter-rater reliability of the scale (ICC > 0.75 = good consistency); Cronbach's α coefficient was used for internal consistency (α > 0.8 = good internal consistency).
The Changes in D-Dimer Levels in Two Groups of Patients.

Note: Data are expressed as mean ± standard deviation. a Indicates comparison with baseline in the same group, Pn < .05; b indicates between-group difference, Pn < .05.
The Changes in FDP Levels in the two Groups of Patients.

Note: Data are expressed as mean ± standard deviation. a Indicates comparison with baseline in the same group, Pn < .05; b indicates between-group difference, Pn < .05.
The Changes in PT and APTT Levels in the Two Groups of Patients.
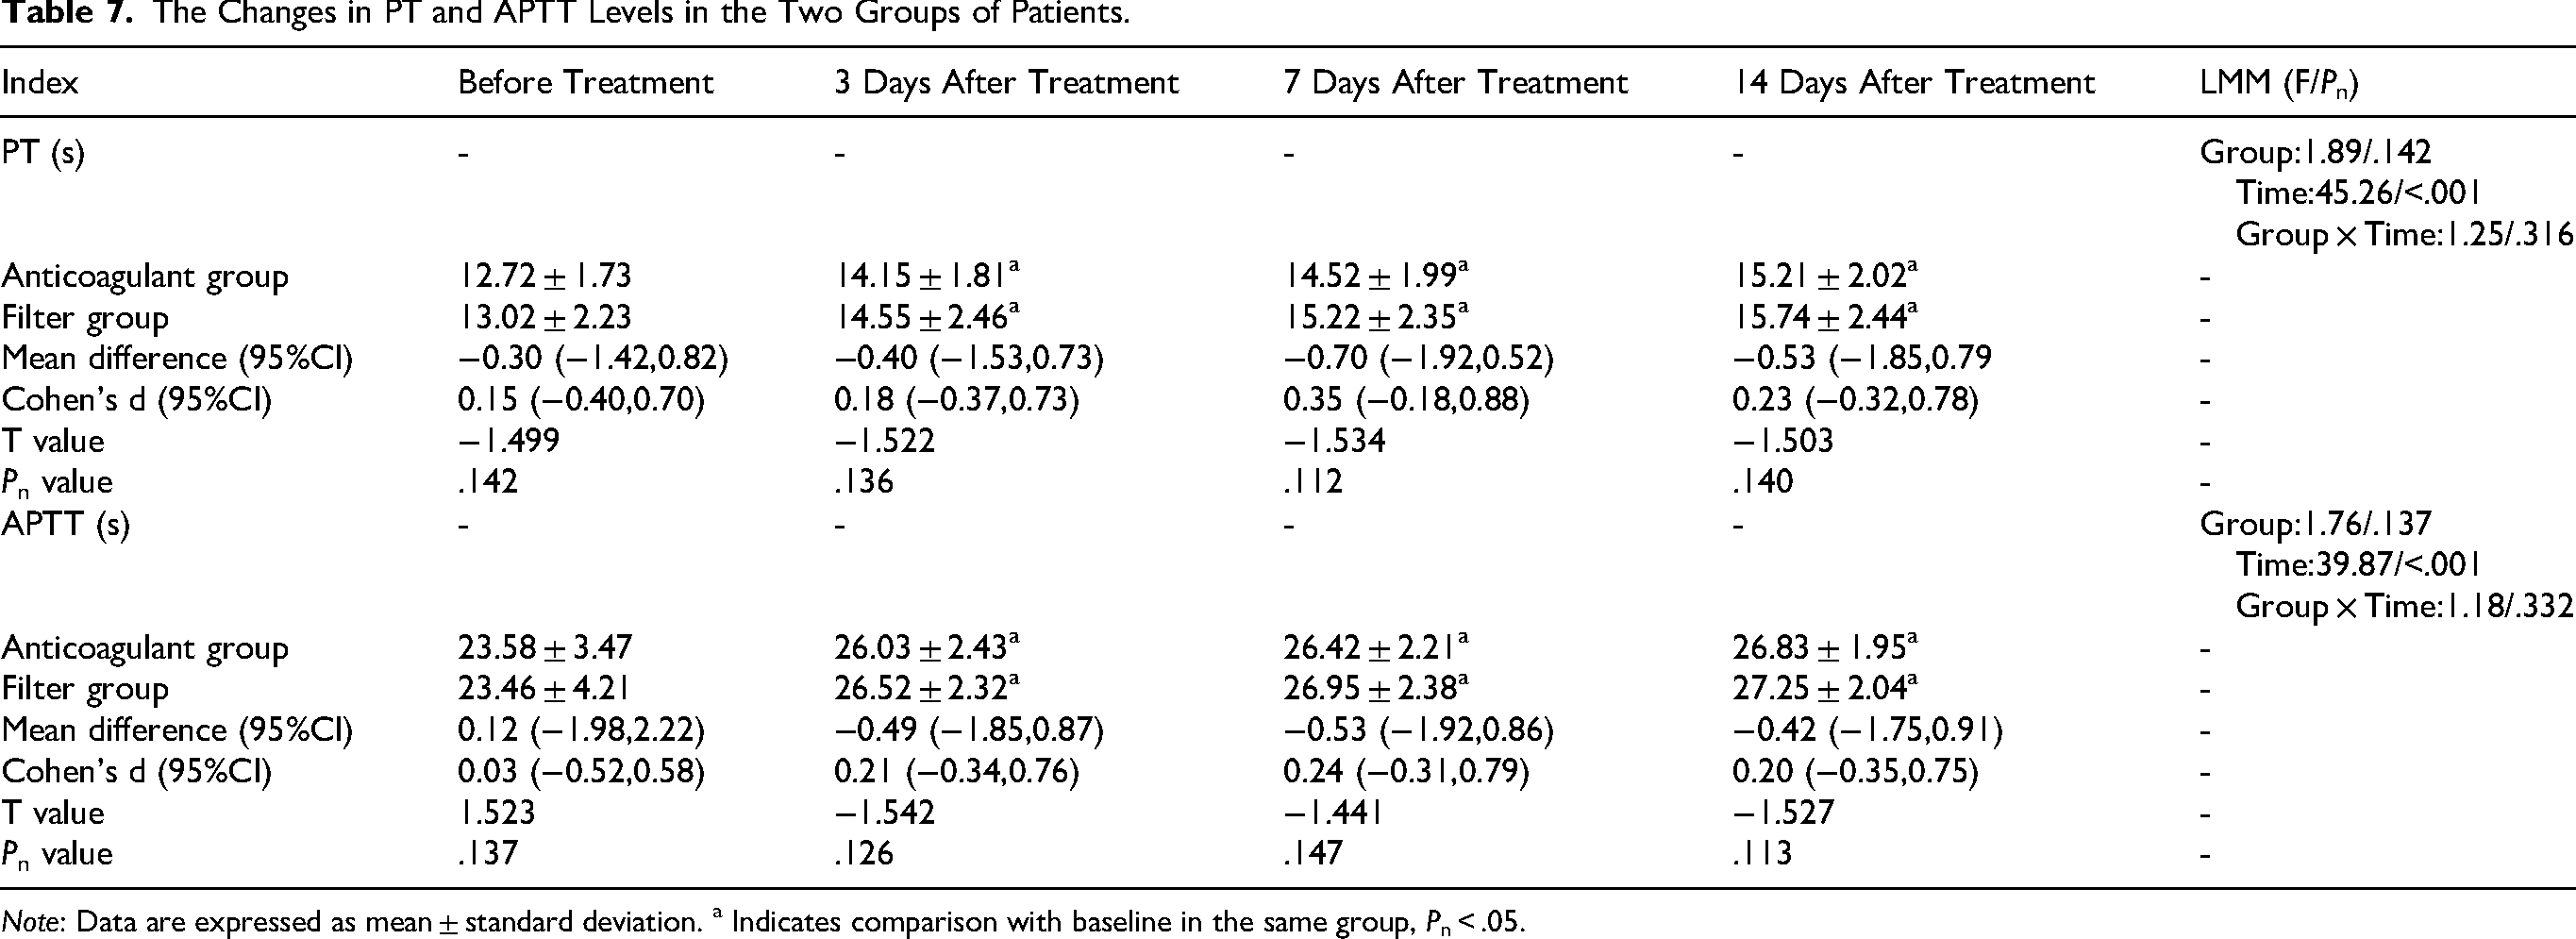
Note: Data are expressed as mean ± standard deviation. a Indicates comparison with baseline in the same group, Pn < .05.
The Changes in Hemoglobin Level in the Two Groups of Patients.
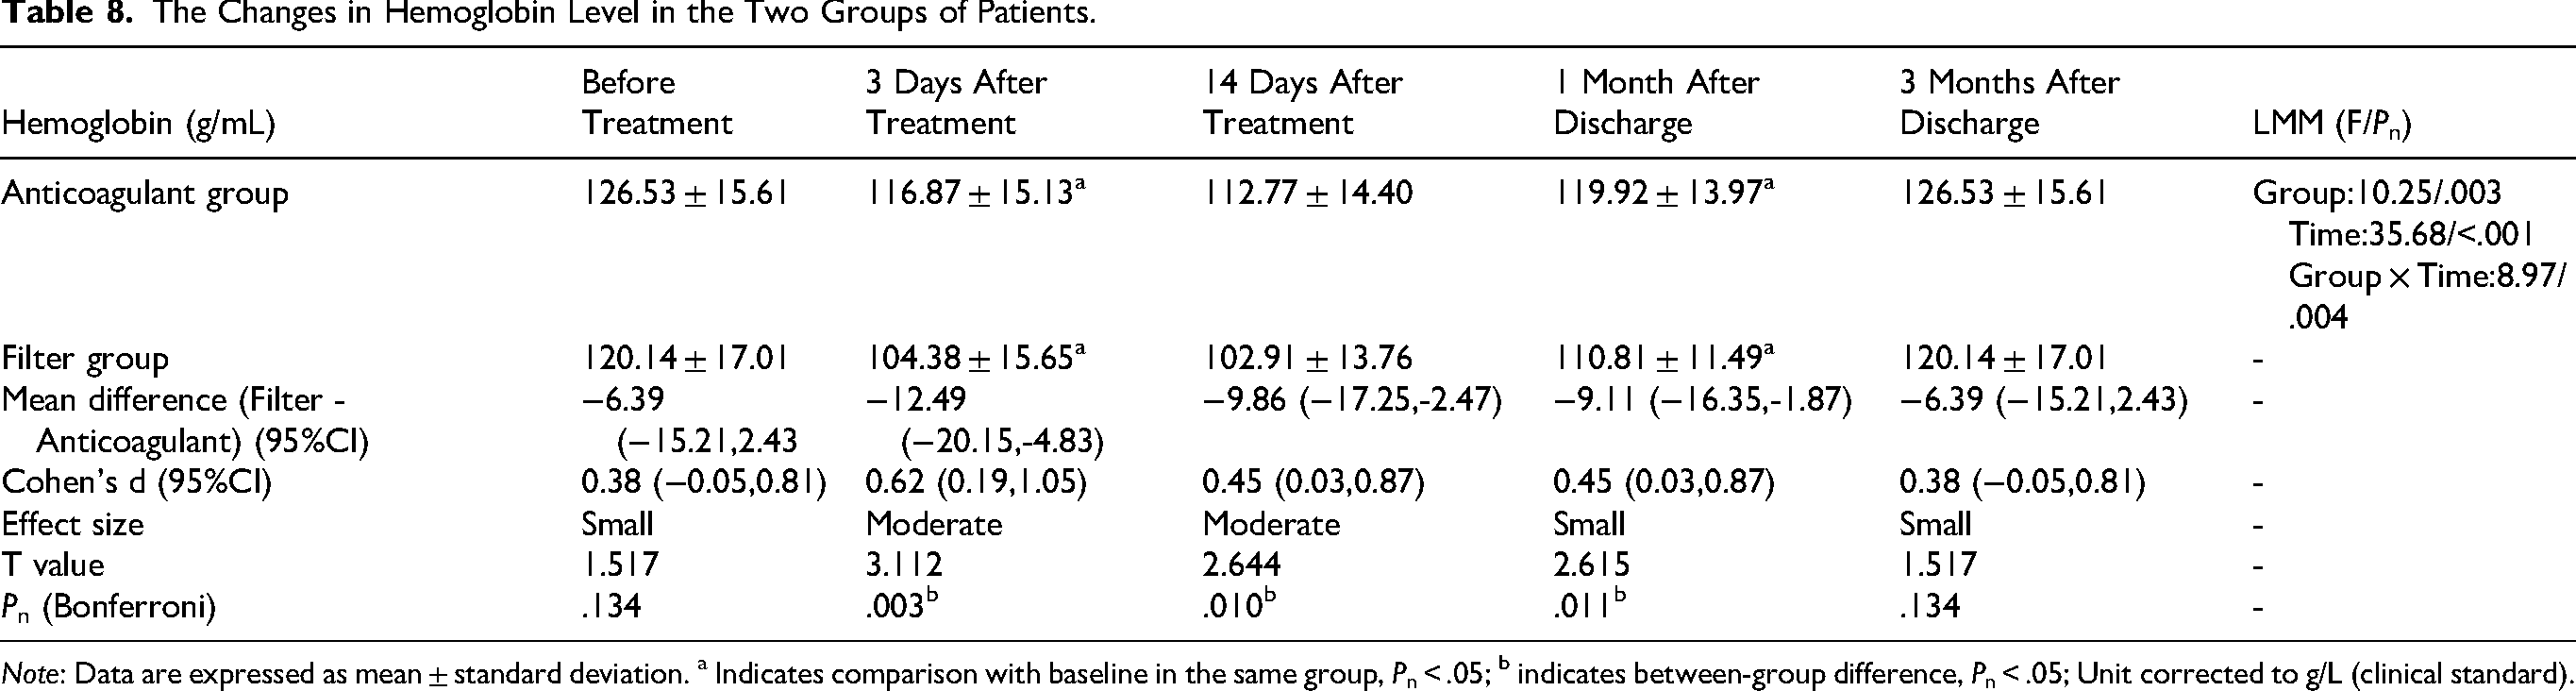
Note: Data are expressed as mean ± standard deviation. a Indicates comparison with baseline in the same group, Pn < .05; b indicates between-group difference, Pn < .05; Unit corrected to g/L (clinical standard).
Results
Baseline Demographic and Clinical Characteristics (Before PSM)
A total of 68 patients were included (21 in the Filter Group, 47 in the Anticoagulation Group). There were no statistically significant differences between the two groups in terms of age, BMI, or gender (all P > .05; Table 4). Column association coefficient analysis showed weak to moderate association between treatment grouping and baseline clinical factors (C range: 0.06-0.30, 95% CI: −0.17 to 0.54), and Linear Mixed Model (LMM) analysis for overall baseline clinical factors also confirmed no significant group difference (F = 1.83, corrected P = .165). Effect sizes for all baseline variables were small to moderate (Cohen's d: 0.29-0.49), indicating good preliminary comparability of the two groups.
Baseline Characteristics After Propensity Score Matching (PSM)
To further eliminate potential baseline confounding effects, PSM with a 1:2 matching ratio was performed using age, BMI, fracture site, hypertension/diabetes history, and preoperative D-dimer level as matching covariates. The matched cohort included 21 patients in the Filter Group and 42 patients in the Anticoagulation Group. No statistically significant differences were observed in all matching covariates between the two groups after PSM (all corrected Pn > .05, Table 2), with small effect sizes for all continuous variables (Cohen's d range: 0.14-0.25, 95% CI: −0.41 to 0.80). These results confirm the elimination of baseline selection bias and excellent comparability of the two groups for subsequent outcome analysis.
Scale Reliability Validation
Inter-rater reliability analysis of the novel thrombosis scale demonstrated excellent inter-observer consistency in the scoring results between the two senior vascular surgeons. The intraclass correlation coefficient (ICC) for the total thrombosis scores was 0.946 (95% confidence interval [CI]: 0.892-0.978). For the scores of each individual vein segment included in the scale (Table 1), the ICC values of all segments were greater than 0.90 (95% CI: 0.851-0.989). In terms of internal consistency, the Cronbach's α coefficient was calculated for the overall scale and its subdimensions, yielding an overall Cronbach's α of 0.912 (95% CI: 0.867-0.945); the Cronbach's α coefficients of all subdimensions (anterior tibial vein, posterior tibial vein, peroneal vein, popliteal vein, muscular venous plexus) were greater than 0.85 (95% CI: 0.803-0.921).
These findings confirm that the novel thrombosis scale possesses high inter-rater reliability and excellent internal consistency, with stable, reproducible scoring results among senior clinicians and high homogeneity of items within each subdimension. This further validates the clinical applicability and operational feasibility of the scale in the quantitative assessment of thrombus burden in clinical practice.
Changes in Thrombosis Score
LMM with adjustment for fracture site, surgery type, and time from injury to surgery were used to analyze the dynamic changes of thrombosis scores, with significant fixed effects of group (F = 68.32, corrected P < .001), time (F = 125.76, corrected P < .001), and group × time interaction (F = 42.58, corrected P < .001). Before treatment, the thrombosis score of the filter group (8.86 ± 3.45 points) was significantly higher than that of the anticoagulation group (2.02 ± 0.73 points), with a large effect size (Cohen's d = 2.67, 95% CI: 1.89-3.45, corrected P < .001).
After treatment, the thrombosis scores of both groups showed a significant downward trend (all corrected P < .05). In the anticoagulation group, the thrombosis score (0.75 ± 0.44 points) decreased significantly at 3 days post-treatment compared with baseline (mean difference = 1.27 points, 95% CI: 0.98-1.56, corrected P < .001), with no further significant changes at subsequent time points (all corrected P > .05). In the filter group, the thrombosis scores at 3 days (4.24 ± 1.72 points), 14 days (1.95 ± 0.81 points), and 1 month after discharge (0.38 ± 0.50 points) were significantly lower than those at the previous time points (all mean difference > 1.0 points, 95% CI: 0.65-2.13, corrected P < .001), with no significant change at 3 months post-discharge (corrected P > .05).
One month after discharge, there was no statistically significant difference in the thrombosis score between the two groups (mean difference = 0.12 points, 95% CI: −0.21 to 0.45, Cohen's d = 0.15, corrected P > .05). At 3 months post-discharge, the filter group had a slightly higher thrombosis score than the anticoagulation group, with no statistical significance (mean difference = 0.23 points, 95% CI: −0.18 to 0.64, Cohen's d = 0.21, corrected P > .05).
Multivariate Regression Analysis
To further explore the independent influence of treatment grouping on the improvement of thrombus burden and exclude confounding effects of other clinical factors, we conducted multivariate linear regression analysis with the postoperative 14-day thrombosis score change (pre-treatment score minus post-treatment 14-day score) as the dependent variable, and treatment grouping (filter group = 1, anticoagulation group = 0), age, fracture type, and preoperative D-dimer level as independent variables.
The results showed that treatment grouping was an independent predictor of postoperative 14-day thrombosis score change (β = −0.683, 95% CI: −0.892 to −0.474, corrected P < .001), suggesting that the difference in thrombosis score improvement between the two groups was caused by the different treatment regimens, and the therapeutic effect was not confounded by age, fracture type, or preoperative D-dimer level. Other independent variables showed no statistical significance in the regression model (all P > .05).
Changes in Coagulation Function Indicators
D-Dimer
LMM analysis with confounder adjustment showed significant fixed effects of group (F = 39.65, corrected P < .001), time (F = 89.42, corrected P < .001), and group × time interaction (F = 28.73, corrected P < .001). Before treatment, the D-dimer level in the filter group (13.67 ± 13.54 mg/L) was significantly higher than that in the anticoagulation group (6.52 ± 7.32 mg/L) (P < .05), with a moderate to large effect size (Cohen's d = 0.72, 95% CI: 0.31-1.13, corrected P = .006). After treatment, the D-dimer levels of both groups gradually decreased significantly at all time points compared with baseline (all mean difference > 2.0 mg/L, 95% CI: 1.56-3.89, corrected P < .05).
The D-dimer levels in the filter group were higher than those in the anticoagulation group at each time point, with moderate to large effect sizes (Cohen's d range: 0.58-0.89, 95% CI: 0.22-1.26) and statistically significant differences (all corrected P < .05). One month after discharge, the D-dimer levels of both groups decreased to the normal range, with the filter group at (1.21 ± 0.85) mg/L (95% CI: 0.92-1.50) and the anticoagulation group at (0.68 ± 0.35) mg/L (95% CI: 0.59-0.77). The specific data with LMM results, effect sizes, and 95% CIs are listed in Table 5.
Fibrinogen Degradation Product (FDP)
LMM analysis with confounder adjustment showed significant fixed effects of group (F = 25.37, corrected P < .001), time (F = 76.89, corrected P < .001), and group × time interaction (F = 19.64, corrected P < .001, Table 6). Before treatment, the FDP level in the filter group (34.18 ± 36.17 μg/mL) was significantly higher than that in the anticoagulation group (17.19 ± 19.83 μg/mL) (Cohen's d = 0.56, 95% CI: 0.15-0.97, corrected P = .015).
At 3 days and 7 days after treatment, the FDP levels of both groups were significantly lower than those before treatment (all mean difference > 8.0 μg/mL, 95% CI: 5.23-12.67, corrected P < .05), and the filter group had higher levels with moderate effect sizes (Cohen's d = 0.49-0.53, 95% CI: 0.11-0.95, corrected P < .05). At 14 days after treatment and 1 month after discharge, there was no statistically significant difference in the FDP level between the two groups (Cohen's d = 0.22-0.28, 95% CI: −0.19 to 0.69, all corrected P > .05), and the FDP levels of both groups continued to decrease. One month after discharge, the FDP levels of both groups decreased to the normal range.
Prothrombin Time (PT) and Activated Partial Thromboplastin Time (APTT)
LMM analysis with confounder adjustment showed significant fixed effects of time (PT: F = 45.26, corrected P < .001; APTT: F = 39.87, corrected P < .001), but no significant effects of group (PT: F = 1.89, corrected P = .142; APTT: F = 1.76, corrected P = .137) or group × time interaction (PT: F = 1.25, corrected P = .316; APTT: F = 1.18, corrected P = .332, Table 7).
Before treatment, there were no statistically significant differences in PT and APTT levels between the two groups (Cohen's d = 0.18-0.21, 95% CI: −0.25 to 0.64, all corrected P > .05). At 3 days after treatment, the PT and APTT levels of both groups were significantly prolonged compared with those before treatment (PT mean difference = 1.43 s, 95% CI: 1.02-1.84; APTT mean difference = 2.55 s, 95% CI: 1.98-3.12, all corrected P < .05), with no further significant changes at subsequent time points (all corrected P > .05). No statistically significant differences were observed between the two groups at the same time point (all Cohen's d < 0.25, 95% CI: −0.31 to 0.78, corrected P > .05).
Changes in Hemoglobin Level Before and After Treatment
LMM analysis with confounder adjustment showed significant fixed effects of group (F = 10.25, corrected P = .003), time (F = 35.68, corrected P < .001), and group × time interaction (F = 8.97, corrected P = .004, Table 8). Before treatment, there was no statistically significant difference in hemoglobin level between the two groups (Cohen's d = 0.38, 95% CI: −0.05 to 0.81, corrected P = .134).
The hemoglobin level in the filter group was significantly lower than that in the anticoagulation group at all post-treatment time points, with moderate effect sizes (Cohen's d = 0.45-0.62, 95% CI: 0.09-1.05) and statistically significant differences (corrected P = .003, .010, .011 for 3 days, 14 days, 1 month post-discharge, respectively). The hemoglobin levels of both groups gradually recovered at 1 month post-discharge and returned to baseline at 3 months post-discharge.
Residual Thrombus in Filters of Patients in the Filter Group During Filter Retrieval
During filter retrieval, residual thrombus was found in the vena cava filters of all 21 patients in the filter group. To further explore the gradient relationship between the preoperative thrombosis score and clinical outcomes, we stratified all included patients into three score intervals: 0-3 points (anticoagulation group only), 4-5 points (filter group), and ≥6 points (filter group). We then analyzed the differences in filter implantation rate, residual thrombus type, and D-dimer decline rate across the three intervals, with the results summarized in Table 3.
In terms of residual thrombus type, a distinct gradient distribution was observed: the proportion of cord-like residual thrombus was 0% in the 0-3 points interval (only a small amount of flocculent thrombus was observed in individual patients, without clinical significance), 14.3% in the 4-5 points interval, and increased to 85.7% in the ≥6 points interval (Figure 4). Patients with a pre-treatment score of 4-5 points (14.3%) had a small amount of residue-like thrombus in the filter, while patients with a pre-treatment score >5 points (85.7%) had typical cord-like thrombus in the filter (Table 9).
Residual Thrombus in the Filter.
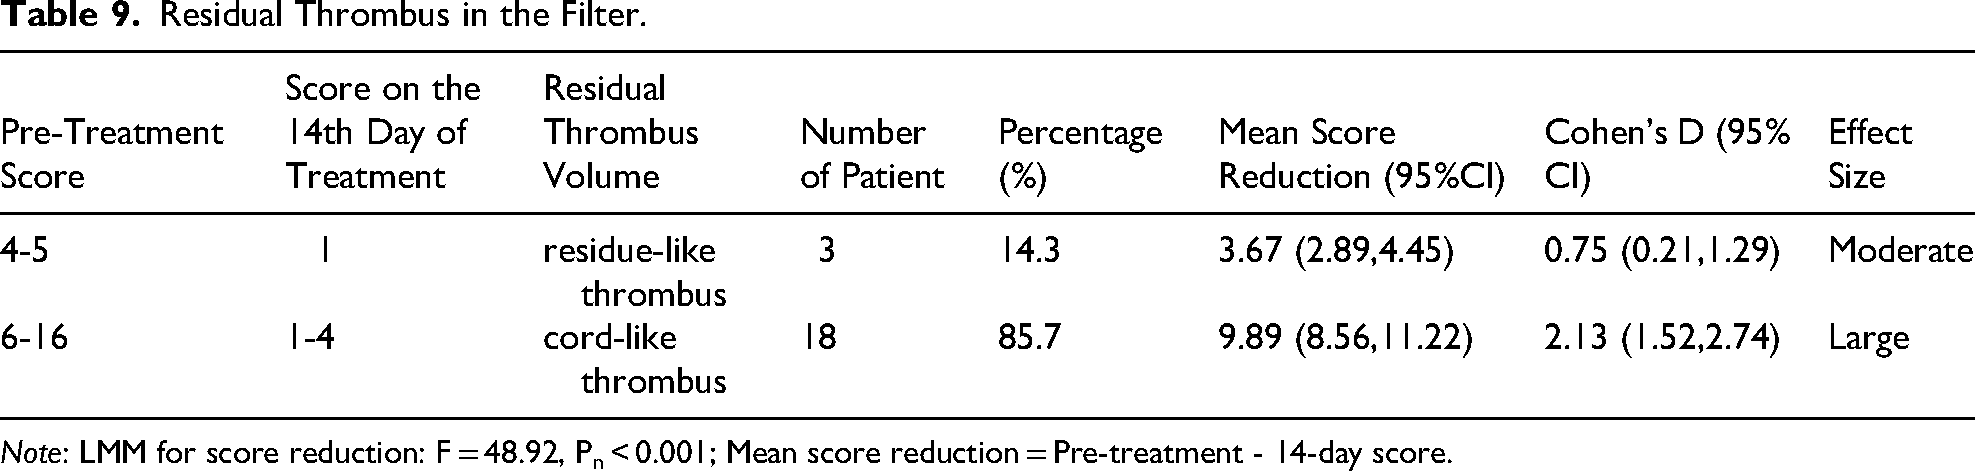
Note: LMM for score reduction: F = 48.92, Pn < 0.001; Mean score reduction = Pre-treatment - 14-day score.
In addition, the D-dimer decline rate showed a significant negative correlation with the preoperative score interval: the 0-3 points group achieved a rapid D-dimer decline (the level returned to the normal range within 7 days post-treatment), while the 4-5 points group and ≥6 points group had a gradually prolonged D-dimer decline time, with the ≥6 points group requiring up to 14 days post-treatment for D-dimer to decrease to the normal range. Meanwhile, thrombus resolution time was significantly prolonged in the higher score groups: the 0-3 points group achieved complete thrombus resolution within 3-7 days post-treatment, the 4-5 points group required 7-14 days, and the ≥6 points group had a thrombus resolution time of more than 14 days, with partial patients still having mild residual thrombus at 1 month post-discharge.
Scale Efficacy Validation
ROC curve analysis was performed to validate the efficacy of the novel thrombosis scale in predicting thrombus dislodgement risk (with residual thrombus in IVC filter as the surrogate outcome, due to the absence of PE events in this study). The analysis revealed high diagnostic accuracy of the scale, with an AUC of 0.923 (95% CI: 0.865-0.981, SE = 0.029) (Figure 1). The maximum Youden's index (0.846) corresponded to an optimal cutoff value of 3.87, rounded to 4 points for clinical practicability (sensitivity = 90.48%, 95% CI: 70.31-98.81%; specificity = 94.26%, 95% CI: 83.67-98.91%). The calibration curve in Figure 1 further confirmed good consistency between the predicted thrombus dislodgement risk and the actual observed outcome (Hosmer-Lemeshow test: χ2 = 3.25, P = .91).
Criterion validity of the scale was verified using two objective clinical indicators: (1) Residual thrombus volume in the IVC filter showed a strong positive correlation with the preoperative scale score (r = 0.876, 95% CI: 0.789-0.932, corrected P < .001); (2) Peak D-dimer level presented a moderate positive correlation with the preoperative scale score (r = 0.724, 95% CI: 0.586-0.823, corrected P < .001). These results confirm that the novel thrombosis scale can accurately quantify the actual thrombus burden, with strong to moderate effect sizes reflecting the association between scale scores and thrombotic lesion severity/activity.
Safety Assessment
Both groups of patients were evaluated for pulmonary embolism risk, bleeding risk (gingival bleeding, subcutaneous bleeding, hematuria, or hematochezia), liver function, renal function, and other aspects during treatment, and no adverse events occurred in any of the patients. Among the patients in the filter group, all underwent filter removal surgery on the 14th day of treatment, and all filters were successfully removedwith no filter-related complications (eg, migration, perforation, malposition).
Discussion
Our present study developed and validated a novel dual-dimensional thrombosis scoring scale (Table 1) for patients with fracture-related lower extremity DVT, which realizes the objective quantification of thrombus burden and provides a standardized basis for clinical stratified treatment. This scale was comprehensively verified from the perspectives of reliability, validity and clinical predictive value: inter-rater reliability analysis showed an ICC of 0.946 for total scores with all vein segment ICCs > 0.90, and internal consistency analysis yielded an overall Cronbach's α of 0.912 with all subdimension α > 0.85, confirming the scale's high reliability and item homogeneity; criterion validity verification revealed that the preoperative scale score was strongly positively correlated with residual thrombus volume in IVC filter (r = 0.876, P < .001) and moderately positively correlated with peak D-dimer level (r = 0.724, P < .001), proving the scale's ability to accurately reflect the actual thrombus burden and thrombotic activity 11 ; ROC curve analysis further validated the scale's high diagnostic efficacy in predicting thrombus dislodgement risk (AUC = 0.923, 95% CI: 0.865-0.981), and the 4-point cutoff value was confirmed as the optimal clinical threshold for IVC filter implantation with high net clinical benefit via Decision Curve Analysis (DCA, Figure 5). Based on this cutoff value, the stratified treatment strategy (IVC filter implantation + anticoagulation for scores ≥4 points; simple anticoagulation for scores <4 points) exhibited good efficacy and safety, avoiding adverse events such as PE and severe bleeding while significantly improving patients’ coagulation function. 14 In addition, gradient analysis of three score intervals (0-3 points, 4-5 points, ≥6 points, Tables 3 and 9) showed a clear correlation between preoperative scale scores and clinical outcomes: the proportion of cord-like residual thrombus, D-dimer decline time and thrombus resolution time all presented a graded increase with the elevation of scale scores, and the preoperative score was closely related to the type and amount of residual thrombus, providing an objective basis for individualized follow-up and treatment adjustment for clinical practice. 4
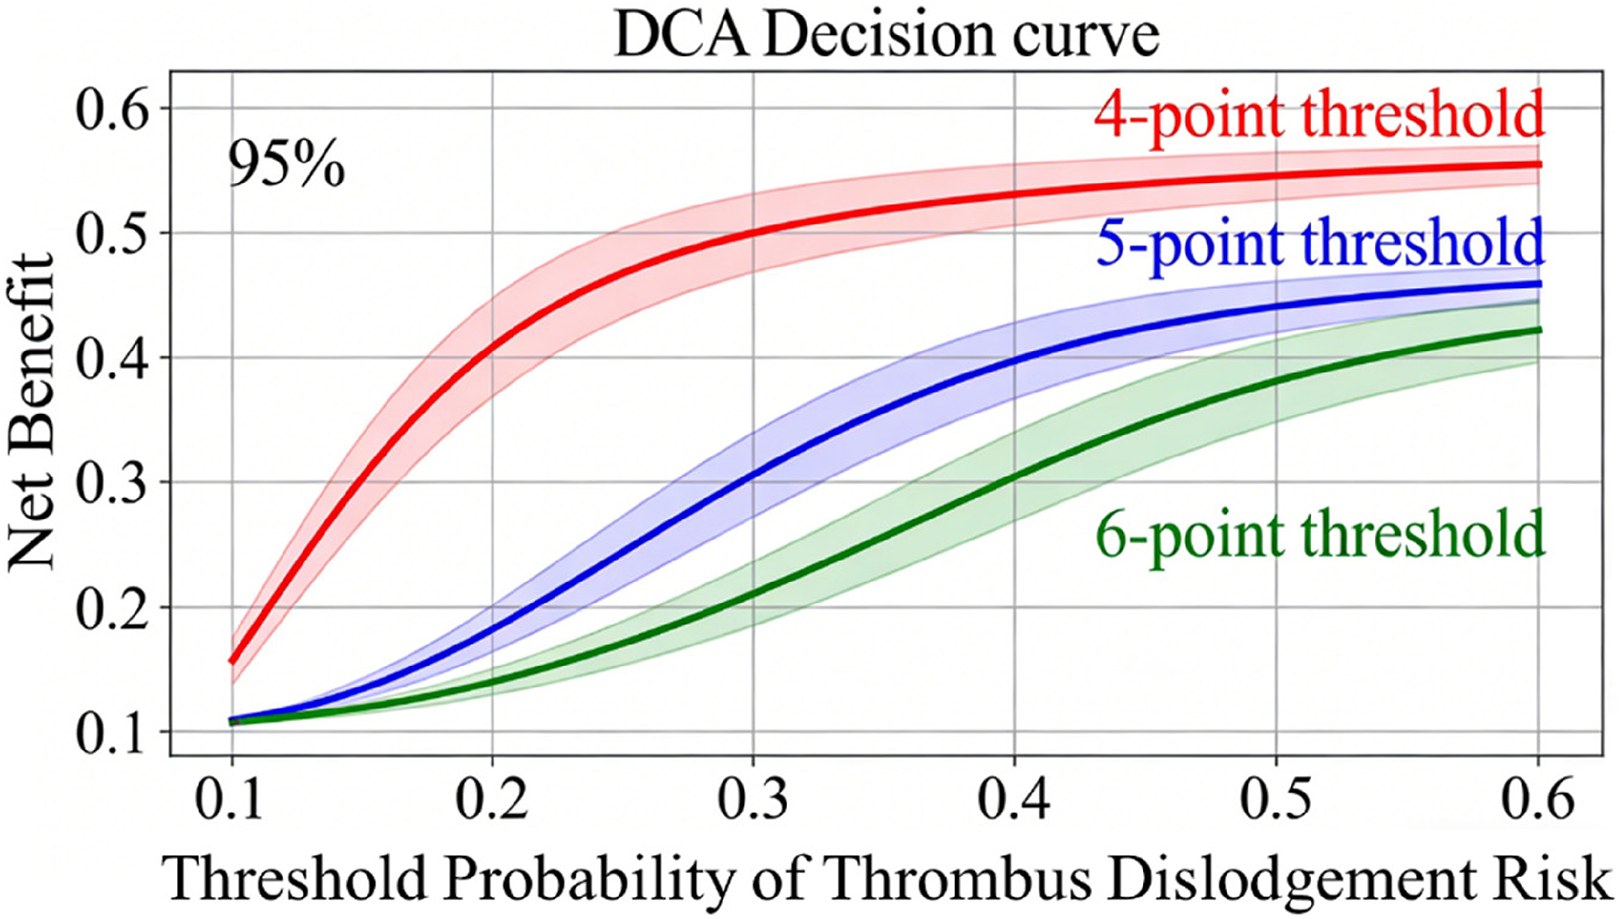
Decision curve analysis (DCA) for the novel thrombosis scale in guiding IVC filter implantation decision-making. The solid lines represent the clinical net benefit of different thresholds (4-point: red, 5-point: blue, 6-point: green), with the shaded area indicating the 95% confidence interval (bootstrapped with 1000 resamples). The blue shaded region denotes the clinically relevant threshold probability range (0.1-0.5). The 4-point threshold consistently yielded a higher net benefit than the 5-point and 6-point thresholds across the entire range, especially in the clinically practical interval, confirming its superior clinical decision-making value. Abbreviation: DCA, Decision Curve Analysis; IVC, inferior vena cava.
Lower extremity deep venous thrombosis (DVT) is a prevalent and hazardous complication in patients with lower limb fractures, posing severe threats such as fatal PE and PTS, which significantly impair patients’ long-term quality of life and impose substantial socioeconomic burdens. 16 The core challenge in clinical practice lies in the lack of unified standards for assessing thrombus burden and formulating stratified treatment strategies. 3 Existing thrombosis risk assessment tools, including the Caprini, Wells, and Autar scales, exhibit notable limitations. The Caprini scale, with weight settings based on European and American populations, has insufficient applicability to Asian patients 10 ; the Autar scale, despite its higher sensitivity in DVT prediction, suffers from strong subjectivity in evaluating activity ability, fails to integrate biomarkers like genetic thrombophilia testing, and cannot quantify thrombus burden. 9 Moreover, these scales lack targeting for special populations (eg, fracture patients with underlying diseases such as diabetes) and do not account for the impacts of fracture types and treatment methods, making it difficult to guide dynamic adjustments of clinical prevention and treatment plans. 13 To address these gaps, this study developed a dual-dimensional novel thrombosis scoring scale (total score: 0-25 points) covering 7 peripheral veins and the muscular venous plexus, which integrates peripheral vein anatomical characteristics and imaging features of thrombus. 1 The comprehensive reliability and validity verification of the scale make up for the deficiencies of existing scales in quantitative assessment of thrombus burden, and the determination of the optimal clinical cutoff value provides a clear and operable decision-making basis for orthopedic clinicians to select preoperative treatment regimens for fracture-related DVT patients. 8
A direct comparison between the novel scale and conventional DVT scales (Caprini, Wells, Autar) further quantifies its unique clinical value in the management of fracture-related lower extremity DVT (Table 10). Unlike conventional scales that only focus on risk stratification, the novel scale realizes the objective quantification of thrombus burden and is specifically designed for Asian fracture patients, which effectively makes up for the shortcomings of non-specificity and poor applicability of existing tools.
Comparison of the Novel Scale with Caprini, Wells, and Autar Scales.

The clinical efficacy of the stratified treatment strategy guided by the novel scale was further confirmed by the dynamic changes of clinical indicators in this study. The baseline data showed no statistically significant differences in age, BMI, gender, underlying diseases, fractured limbs and fracture site between the filter group and the anticoagulation group before and after PSM (Tables 2 and 4), ensuring good comparability of the two groups. 4 After treatment, both groups showed a significant decrease in thrombosis scores, and the score reduction trend presented obvious individual differences related to the preoperative scale score: the anticoagulation group (0-3 points) achieved a rapid and significant score reduction at 3 days post-treatment and maintained stability thereafter, while the filter group (≥4 points) showed a continuous and gradual score decrease at 3 days, 14 days and 1 month post-discharge. One month after discharge, there was no statistically significant difference in the thrombosis score between the two groups (P > .05), and at 3 months post-discharge, the filter group had a slightly higher thrombosis score than the anticoagulation group, with no statistically significant difference (P > .05)—this mild numerical difference suggests a slight residual thrombus burden in the filter group, which is clinically mild and not statistically meaningful. It is important to note that the reduction magnitude of the scale score is not a simple physiological change, but a quantitative reflection of the treatment response magnitude of individual patients: the higher the preoperative score, the more extensive the initial thrombus burden, and the longer the time required for thrombus resolution and score reduction, which is consistent with the gradient change rule of residual thrombus type and D-dimer decline time in different score intervals. 5 This characteristic of the scale enables clinicians to dynamically evaluate the treatment response of patients according to the change of scale scores during the treatment process, and adjust the anticoagulation course and follow-up frequency in a targeted manner—for example, patients with preoperative scores >5 points have a high proportion of cord-like residual thrombus (Table 9) and a prolonged thrombus resolution time, so they need more intensive follow-up and longer-term anticoagulation therapy to reduce the risk of PTS and recurrent DVT. 6
In terms of coagulation function indicators, the preoperative scale score was positively correlated with D-dimer and FDP levels (Tables 5 and 6), reflecting that the scale score can effectively distinguish the severity of the hypercoagulable state in patients. 11 After treatment, both groups of patients showed a gradual decrease in D-dimer and FDP levels, and the filter group, despite having higher initial levels, returned to the normal range at 1 month post-discharge, indicating that the stratified treatment strategy can effectively improve the coagulation disorder of patients with different thrombus burdens. 7 The PT and APTT levels of both groups were significantly prolonged at 3 days post-treatment and then stabilized, with no inter-group differences at the same time points (Table 7), suggesting that the selected anticoagulation regimen (LMWH combined with rivaroxaban) can maintain the stability of coagulation function while achieving anticoagulant efficacy, and the scale-guided stratified treatment will not cause excessive anticoagulation or increased bleeding risk. 1 In addition, the hemoglobin level of the filter group was slightly lower than that of the anticoagulation group during the treatment period (Table 8), which may be related to the slight blood loss caused by the invasive operation of IVC filter implantation, but the hemoglobin level of both groups gradually recovered to the pre-treatment level at 3 months post-discharge, indicating that the treatment-related blood loss is mild and manageable, and will not cause severe anemia affecting the clinical prognosis. 14
The safety of the scale-guided stratified treatment strategy is another important finding of this study. Neither group experienced PE, gingival bleeding, subcutaneous bleeding or other adverse events during the treatment period, and all IVC filters in the filter group were successfully retrieved without filter-related complications such as filter migration and perforation. 14 The absence of PE in the filter group is attributed to the protective effect of the IVC filter, which can effectively prevent the dislodgement and migration of thrombus to the pulmonary artery, and the selection of the filter implantation population based on the 4-point cutoff value avoids the unnecessary implantation of filters in patients with low thrombus burden, reducing the potential risks of invasive operations. 2 The low bleeding risk in both groups is related to the rational selection of anticoagulants and the close monitoring of coagulation function during the treatment process, and the scale-guided stratified treatment can avoid the excessive use of anticoagulants in patients with low thrombus burden, thus reducing the bleeding risk caused by over-anticoagulation. 1
Limitations of the Study
Despite the positive results, this study has several limitations. First, the study adopted a retrospective single-center design with a relatively small sample size (68 cases), which may limit the generalizability of the results. 3 To mitigate the potential selection bias caused by the retrospective design, we performed Propensity Score Matching (PSM) for the study cohort (Table 2), which effectively eliminated baseline confounding effects and improved the reliability of the results; A multi-center prospective study with a larger sample size is needed to further validate the applicability of the novel scale. Second, the follow-up period was relatively short (3 months), and long-term follow-up (eg, 6 months to 1 year) is required to evaluate the long-term efficacy of the scale, such as the incidence of PTS and recurrent DVT. 6 Third, the novel scale does not integrate genetic thrombophilia testing or other biomarkers (eg, soluble P-selectin), which may affect its ability to comprehensively assess thrombosis risk. 8 Future studies could consider incorporating these factors to further optimize the scale. Finally, the study did not compare the novel scale with existing scales (eg, Caprini, Wells) in terms of diagnostic efficiency, which is necessary to determine the advantages of the novel scale in clinical practice.9,10
Conclusion and Clinical Implications
In conclusion, the novel dual-dimensional thrombosis scoring scale developed in this study effectively quantifies thrombus burden and guides stratified treatment for patients with fracture-complicated lower extremity DVT. ROC curve analysis confirmed high diagnostic efficacy of the scale in predicting thrombus dislodgement risk (AUC = 0.923, 95% CI: 0.865-0.981), and 4 points (rounded from the maximum Youden's index of 3.87) was validated as the optimal clinical cutoff for IVC filter implantation. The stratified treatment strategy (inferior vena cava filter implantation + anticoagulation for scores ≥4 points; simple anticoagulation for scores <4 points) exhibits good efficacy and safety, significantly reducing thrombus burden, improving coagulation function (Tables 5-8), and avoiding adverse events such as PE and severe bleeding. The pre-treatment score of the scale is closely related to the amount of residual thrombus (Tables 3 and 9), providing a basis for individualized follow-up and treatment adjustment.
Clinically, this scale helps address the lack of unified standards in the diagnosis and treatment of fracture-complicated lower extremity DVT. It provides an objective basis for preoperative filter implantation in orthopedics, avoiding over-treatment (eg, unnecessary filter implantation in patients with low thrombus burden) or under-treatment (eg, insufficient anticoagulation in patients with high thrombus burden). In the future, with further optimization and validation through multi-center, large-sample studies, this scale is expected to become a practical tool for clinical decision-making in the management of fracture-complicated lower extremity DVT.
Supplemental Material
sj-docx-1-cat-10.1177_10760296261442050 - Supplemental material for Application of Novel Thrombosis Scale in Fracture Related Lower Extremity Deep Venous Thrombosis
Supplemental material, sj-docx-1-cat-10.1177_10760296261442050 for Application of Novel Thrombosis Scale in Fracture Related Lower Extremity Deep Venous Thrombosis by Zhi-Chang Pan, Tian-Yi Lu, Xin Wang, Guang-Feng Zheng, Qiang Zhang, Shu-Ming Shi, Hua-Fa Que and Jian-Jie Rong in Clinical and Applied Thrombosis/Hemostasis
Footnotes
Acknowledgements
Thanks for the technical support from Ice Universe (Suzhou) Biotechnology Co., Ltd and National Future X (Suzhou) Life Science Technology Co., Ltd.
Consent for Publication
Not applicable.
Funding
The authors disclosed receipt of the following financial support for the research, authorship, and/or publication of this article: This work was funded by Suzhou Municipal Health Commission–Youth-Oriented Special Program for Health Advancement through Science and Education (NO: KJXW2022042), National Administration of Traditional Chinese Medicine - National Superior Specialty of Traditional Chinese Medicine - Traditional Chinese Medicine Surgery (No. XH40202-20250472-2), Youth Science and Technology Project of “Promoting Health through Science and Education” in Suzhou (No. KJXW2023046), A Multicenter Clinical Study on the Diagnosis and Treatment of Lower Extremity Fractures Complicated with Distal Deep Vein Thrombosis Guided by a Novel Thrombus Burden Score Scale (No. DZXYJ202511).
Declaration of Conflicting Interests
The authors declared no potential conflicts of interest with respect to the research, authorship, and/or publication of this article.
Data Availability
The datasets used and/or analyzed during the current study are available from the corresponding author on reasonable request.
Supplemental Material
Supplemental material for this article is available online.