
Abstract
Objective
The aim of this study was to construct a novel nomogram prediction model and to investigate the value of the new predictors in predicting perioperative deep vein thrombosis formation in lower limb traumatic closed fracture (LTCF).
Methods
In this study, we reviewed data from 1,608 patients with LTCF, developed a new predictive model through analysis, and used Lasso regression to screen for the final reliable variables. Modeling was followed by using the ROC curve analysis, calculation of area under the ROC curve and Validation function. Calibration curves, decision curve analysis and clinical impact curves were used to comprehensively assess the performance of the model, and used to construct new predictors, inflammatory immune factors and traditional scores by using ROC analysis model, which was compared with the new predictive model.
Results
The novel nomogram model was constructed with an AUC = 0.918, 95% CI: 0.894-0.942, C-index = 0.913. The new predictors (PHR and PDR), inflammatory-immune domain factors (NLR, PLR, and SII), and traditional scoring systems (Wells and Caprini) had AUC values of 0.689, 0.838, 0.552, 0.557, 0.542, 0.897, and 0.872.
Conclusion
The novel nomogram model constructed in this study is feasible for predicting the occurrence of perioperative DVT in LTCF. PHR and PDR demonstrated superior predictive performance for perioperative DVT in LTCF patients, integrating platelet, metabolic, and fibrinolytic pathways. Associated inflammatory indices (NLR, PLR, SII) offered adjunctive risk assessment value. Threshold analysis indicated optimal performance at a 0.35 cutoff (F1 = 0.828), with perfect precision achievable at ≥0.65, highlighting the model's clinical adaptability through adjustable thresholds.
Keywords
Introduction
Deep vein thrombosis (DVT) is a common perioperative complication in patients with fractures, and its incidence has been reported in the literature to be as high as 13.5-33.7%.1,2 It is the third most common vascular disease after acute myocardial infarction and stroke, and it is one of the major causes of unintended death in hospitalized patients. Several studies have shown that hip, femoral, and tibial fractures are independent risk factors for the development of DVT.1,3 This is mainly because fractures can directly lead to vascular endothelial injury, which together with the fact that braking is often required for a longer period of time after a fracture, is also consistent with Virchow's triad proposed in 1884 consisting of the following three elements of thrombosis: vascular endothelial injury, stagnation of blood flow, and the presence of hypercoagulability of blood.
With increasing attention being paid to venous thromboembolism (VTE) by the medical community, it has now become a preventable and treatable disease.4,5 Nowadays, many methods are used in clinical practice to predict the risk of VTE, and the more commonly used ones are the Caprini scale and Wells scale recommended by the American Association for Thoracic Surgery.6,7 However, Ageno et al 6 stated that the Wells Scale was developed and validated in an outpatient setting and was not accurate in an inpatient setting. Silveira et al 8 concluded that Wells Scale risk stratification was not sufficient to rule out DVT or to influence management decisions in an inpatient setting by evaluating the performance of the Wells Scale system for predicting the formation of DVT in an inpatient setting. Price et al 9 also demonstrated that the Wells score tool was not well suited for prediction of DVT formation in hospitalized patients. Thus, we understand that these traditional scoring systems have some limitations and they have not been developed for LTCF. Also, many recognized risk factors have not been included in the scoring details of both scales. Similarly, Nisio et al 10 published an article in The Lancet stating that the true prevalence of clinically suspected DVT or pulmonary embolism(PE) is only about 20%, and that the diagnosis of VTE based solely on the clinical presentation or scoring systems is unreliable. This suggests that the specificity of existing scoring systems needs to be improved.
In the past, a few scholars have also attempted to overcome the shortcomings of existing scoring scales by constructing different nomogram prediction models. Lv Bing et al 11 constructed a nomogram model to predict DVT in patients with spinal fracture due to high energy injury. Zongyou Yang et al 12 constructed a nomogram model to predict DVT in patients with pelvic and acetabular fractures. Jiang et al 13 predicted preoperative DVT in hip fractures in the elderly by constructing a nomogram model. These experts and scholars have undoubtedly shown us a new path. However, the application scenarios targeted by these models are very limited and they cannot be widely used in clinical practice.
Currently, the hotspot for developing DVT prediction models lies more in the search for reliable and highly specific biomarkers. On the one hand, an increasing number of studies have been devoted to identifying risk factors affecting the development of DVT in fracture patients during hospitalization, including age, gender, underlying disease, past history, fracture type, surgical procedure, bedtime, and blood biochemical indicators.14,15 These studies have provided us with a better understanding of the various risk factors for DVT in hospitalized patients. However, these high-risk factors often do not stand alone as predictors of DVT formation. On the other hand, research on this topic has turned to the field of post-traumatic inflammatory immunity.16–18 We consider the potential adverse effects of DVT formation in patients with LTCF, as well as the low cost and accessibility of these inflammatory immune biomarkers; thus, there is a need to determine the relationship between post-traumatic inflammatory immune factors and DVT as well as their predictive value for DVT occurrence.
The pathogenesis of perioperative DVT in fracture patients is multifactorial, involving endothelial injury, stasis, and hypercoagulability (Virchow's triad). Individual biomarkers often reflect only one aspect of this complex process. To capture the interplay between key pathways—specifically, platelet activation, endothelial/ metabolic function, and fibrinolytic activity—we developed two novel composite indices: the Platelet distribution width to HDL-C ratio (PHR) and the Platelet distribution width to D-dimer ratio (PDR). We hypothesized that PHR, integrating a marker of platelet activation (PDW) with an indicator of endothelial protection and anti-inflammatory capacity (HDL-C), could reflect the balance between pro-thrombotic stimuli and vascular resilience. Similarly, PDR, combining platelet activation (PDW) with a marker of ongoing coagulation and fibrinolysis (D-dimer), might quantify the relative contribution of platelet activity to the overall thrombotic burden. This integrative approach aims to provide a more holistic risk assessment than evaluating individual biomarkers in isolation.
Based on the integrated advantages of PHR and PDR in the key pathways of thrombosis formation, for the high-risk group of DVT patients in LTCF, it is crucial to quickly identify their thrombosis risks and intervene promptly. Therefore, this study aims to construct a new prediction model, compare and analyze it with the Caprini and Wells scores, which are widely used in clinical practice, and investigate PHR and PDR as potential new predictors.
Materials and Methods
Patient Section
This retrospective cohort study was approved by the Ethics Committee of Yueyang Hospital, Hunan Normal University, and the need for obtaining informed consent was waived because of de-identified processing of the data used. Between January 2021 and December 2023, patients with LTCF were used as the study population. Inclusion Criteria: (1) Age ≥ 18 years; (2) Patients admitted due to acute trauma (time from injury to admission ≤ 3 months) with imaging-confirmed lower limb fractures; (3) Completion of blood biochemistry tests and lower limb vascular ultrasound within 24 h of admission. Exclusion Criteria: (1) Fracture type was open fracture, pathological fracture, or multiple fractures (≥3 fracture sites); (2) Treatment or history interference: history of hemodialysis within 3 months prior to admission; long-term use (≥1 week continuous) of anticoagulants or antiplatelet agents within 3 months prior to admission; history of blood transfusion within 3 months prior to admission. (3) Incomplete data or follow-up: Hospitalization duration <72 h (<3 days); critical clinical or examination data missing, rendering analysis impossible. All patients received standardized perioperative thromboprophylaxis according to institutional protocols aligned with current clinical guidelines. Mechanical prophylaxis was applied on admission, and pharmacological prophylaxis (primarily low-molecular-weight heparin) was initiated within 12 h post-admission unless contraindicated. The exclusion of patients with recent anticoagulant/antiplatelet use pertained only to pre-admission medication history and did not affect the administration of guideline-recommended perioperative prophylaxis. DVT occurrence was defined as a thrombus event confirmed by lower extremity vascular ultrasound during hospitalization, with the diagnostic window spanning from admission to 14 days post-surgery for surgical patients.
Variable Section
In this study, we collected the data from the patients’ hospitalized medical records, which included gender, age, smoking, drinking, hypertension, diabetes, cardiovascular disease, chronic liver disease, and the type of fracture (femoral, tibial, fibular, tibiofibular, or ankle fracture), Surgical time(ST), Bed time(BT), and Trauma time(TrT), as well as Caprini and Wells scores at the time of admission to the hospital. In terms of laboratory tests, in order to minimize the time-dependence of the study, we assessed the patients’ routine blood, biochemical tests, and specific biomarkers within the first hour of admission, which included red blood cell(RBC), white blood cell(WBC), platelets(PLT), hemoglobin(HG), neutrophils (NE), lymphocytes(LYM), platelet distribution width(PDW), erythrocyte sedimentation rate(ESR), C-reactive protein (CRP), lipid quadruple counts (Triglyceride, Cholesterol, HDL, and LDL), albumin (ALB), and six coagulation parameters (APTT, PT, TT, PTA, fibrinogen (FIB), and D-Dimer). PHR = platelet distribution width/high density lipoprotein cholesterol, PAR = platelet distribution width/albumin, NLR = neutrophil count/lymphocyte count, PLR = platelet count/lymphocyte count, and SII = platelet count × neutrophil count/lymphocyte count were calculated. These composite ratios were conceptualized to reflect integrated pathophysiological processes, PHR as an indicator of platelet activation relative to endothelial protection, and PDR as a marker of platelet activity against fibrinolytic response, both aligning with the multifactorial model of thrombosis.
Statistical Analysis
All statistical analyses were performed using SPSS version 27.0, SPSS Modeler version 18.0, and R version 4.3.3. A two-sided P-value < .05 was considered statistically significant.
Handling of Missing Data
Missing data were handled using Multiple Imputation (MI) with the Fully Conditional Specification (FCS) method. The overall missing data rate was 2.6% across all candidate variables. Variables with higher missing rates included HDL (19.59%), LDL (19.59%), TC (18.78%), CHOL (18.78%), ESR (1.06%), etc A total of 5 imputed datasets were generated to account for the uncertainty in the imputation process. The imputation model included all candidate predictor variables listed in the Variable section as well as the outcome variable (DVT status), ensuring the relationships between variables were preserved. Multiple imputation was performed prior to splitting the data into training, validation, and test sets to prevent data leakage and ensure that all derived sets reflected the same underlying distribution of the imputed data. The final analysis estimates were obtained by pooling the results across the 5 imputed datasets using Rubin's rules.
Data Splitting
The total cohort of 1608 patients was randomly divided into three independent sets using stratified randomization (SPSS Modeler) based on DVT outcome: a training set (70%, n = 1126), a validation set (20%, n = 321), and a test set (10%, n = 161). This ensured proportional distribution of DVT cases across sets and maintained independence between them for model development, tuning, and evaluation.
Model Development Workflow
The predictive model was developed following a sequential training–validation–test approach to ensure robustness and avoid overfitting. Univariate logistic regression was first performed on the training set to identify candidate variables associated with DVT (P < .05). Continuous variables were expressed as mean ± SD or median (IQR) and compared using independent t-test or Mann–Whitney U test; categorical variables were presented as frequencies and compared using chi-square or Fisher's exact test. Variables significant in univariate analysis were entered into a multivariable logistic regression model (backward stepwise selection) to identify independent predictors. Results were expressed as odds ratios (OR) with 95% CI. To further refine the predictor set and address potential multicollinearity, least absolute shrinkage and selection operator (LASSO) regression with 10-fold cross-validation was applied to the training set. The optimal penalty parameter (λ) was chosen via cross-validation based on the minimum mean squared error criterion. Variables with non-zero coefficients after shrinkage were retained as the final predictors.
Nomogram Construction and Evaluation
A nomogram was built based on the coefficients of the LASSO-selected predictors using the training set. The model's discriminative ability was evaluated by the area under the receiver operating characteristic curve (AUC) and the concordance index (C-index). Calibration was assessed using the Hosmer–Lemeshow goodness-of-fit test and calibration plots. Decision curve analysis (DCA) and clinical impact curves (CIC) were used to estimate clinical utility. The nomogram was applied to the validation set to determine optimal probability cut-off points using the Youden index, balancing sensitivity and specificity. Model performance metrics (AUC, C-index) were recalculated on the validation set to assess generalizability. The finalized nomogram (with predictors and cut-off derived from the training and validation sets) was applied to the held-out test set for independent performance evaluation. Accuracy, precision, recall, F1-score, and AUC were reported.
Handling Class Imbalance and Threshold Optimization
Given the imbalanced distribution of DVT (9.7%) versus non-DVT cases, we adopted a comprehensive threshold analysis strategy to evaluate model performance across different clinical decision boundaries. While maintaining the conventional 0.5 threshold as a baseline, we systematically evaluated model performance across a range of thresholds from 0.05 to 0.95. For each threshold, we calculated accuracy, precision, recall, specificity, and F1 score to characterize the trade-off between sensitivity and specificity. Precision-recall (PR) curves were generated to complement ROC analysis, providing a more informative evaluation under class imbalance. Based on clinically relevant scenarios, we identified three representative thresholds: a high-specificity threshold (0.65) for confirmatory testing, a balanced threshold (0.35) for routine clinical practice, and a high-sensitivity threshold (0.10) for screening purposes (Supplementary Figure 1).
Comparison with Other Predictors and Scores
For comparative purposes, the predictive performance of the new nomogram was evaluated against individual novel predictors (PHR, PDR), inflammatory-immune markers (NLR, PLR, SII), and traditional scores (Wells, Caprini) using ROC analysis across the entire cohort.
Variance inflation factor (VIF) values were computed for all predictors included in the final model to confirm the absence of significant multicollinearity (VIF < 5 considered acceptable).
Results
Demographic and Clinical Characteristics of Enrolled Patients
In this study, a total of 1805 patients with LTCF met our inclusion criteria, and 197 patients were excluded according to the exclusion criteria, leaving 1608 patients for data analysis (Figure 1). Of these 1608patients, 1452 patients had NDVT, 156 patients had DVT, and the incidence rate of DVT was 9.7%. The mean patient age was 63 years, and the predominant age range was 48-87 years. There were 754 males (46.89%) and 854 females (53.11%). The baseline data of the DVT and NDVT groups were analyzed. All the baseline data and clinical characteristics of patients in both groups are shown in Table 1.

Flow chart of this study.
Demographic and Clinical Characteristics of Perioperative post-Traumatic Closed Lower Extremity Fracture Patients with and Without DVT.

Comparisons between two groups of data expressed as n (percentage) were performed using Fisher's exact test or chi-square test; comparisons between two groups of data expressed as [median (IQR)] were performed using Mann-Whitney U test; and comparisons between multiple groups of data were performed using Kruskal-Wallis H test.
As shown in Table 1, there were statistically significant differences between the two groups in terms of age, fracture type, history of hypertension, diabetes mellitus, history of alcohol consumption, history of cerebrovascular disease, history of chronic hepatitis, chronic kidney disease, TrT, BT, and ST (P < .05). The proportion of patients aged ≥ 60 years who developed DVT was higher than that of patients aged <60 years, suggesting that LTCF patients aged ≥ 60 years were more likely to develop DVT. Moreover, femoral fractures accounted for most of the LTCF types, with femoral fractures followed by occurrence of DVT accounting for 69.87% of all DVT groups. In addition, LTCF patients with TrT, BT, and longer ST showed increased its risk of DVT, indicating that these three risk factors also had an impact on the occurrence of DVT. Gender, smoking history, and history of cardiovascular disease had no effect on the occurrence of VTE. Meanwhile, in order to confirm that there was no group bias in this study, we used the Kruskal-Wallis H-test to compare the baseline data of the patients in the training, validation, and test sets (Table 2), which showed that there was no statistically significant difference among the baseline data of patients in the training, validation, and test sets (P > .05), which proved the comparability of data.
Biochemical Indicators and Clinical Characteristics of the DVT and NDVT Groups in the Training set, Validation set, and Test Set.

Data with a normal distribution in the three groups are expressed as ̅x±s and compared using the independent samples t test; data with a non-normal distribution are expressed as [median (IQR)] and compared using the Mann-Whitney U test.
Biochemical Indices and Clinical Characteristics of Patients in Each Group
To be able to better control for effects due to differences in baseline data while ensuring the independence between datasets and obtaining more comparable results, we used SPSS Modeler software to stratify the included 1608 patients into randomized groups based on whether or not they had DVT (group seed value: 980703), with 112 of the 1126 patients being included in the training set, 30 of the 321 patients being included in the validation set, and 14 of the 161 patients being included in the test set. This ensured independence among the three datasets and obtainment of more comparable results.
The biochemical indices and clinical characteristics of LTCF patients in the training, validation, and test sets are shown in Table 2. The correlation was inconsistent in factors, such as erythrocytes, hemoglobin, platelet distribution width, lymphocyte count, PT, and PTA, Leukocytes, platelets, hemoglobin, neutrophil count, ESR, CRP, triglycerides, cholesterol, high-density lipoproteins, low-density lipoproteins, FIB, APTT, TT, D-Dimer, and Caprini score, Wells score, and other factors were consistently correlated. The above characteristics laid the foundation for our subsequent use of the validation set in terms of adjusting the parameter variables of the final model. The differences in erythrocytes, hemoglobin, lymphocyte count, ESR, CRP, HDL, albumin, FIB, D-Dimer, Wells score, and Caprini score between the DVT and NDVT patient groups in the training set were statistically significant (P < .05). Differences in, FIB, D-Dimer, Caprini score, and Wells score were statistically significant (P < .05).
Unifactorial and Multifactorial Logistic Analyses of the Occurrence of DVT
We performed one-way logistic regression analysis of each parameter in the training set. The results showed that among the categorical variables in the training set, Gender (Female, 1.52 [1.02, 2.29] P = .040), Age (over 60 years, 2.60 [1.68, 4.15] P < .001), Hypertension (Yes, 1.70 [1.14, 2.53] P = .010), and Fracture type (ankle fracture, 0.15 [0.02, 0.47] P = .010) were significant; among continuous variables, RBC (0.43 [0.33, 0.58] P < .001), HGB (0.97 [0.96, 0.98] P < .001), Lymphocyte (0.63 [0.41, 0.93] P = .030), ESR (1.02 [1.01, 1.02] P < .001), CRP (1.01 [1.00, 1.01] P < .001), high-density lipoprotein cholesterol (HDL-C) (0.09 [0.05, 0.18] P < .001), ALB (0.89 [0.85, 0.93] P < .001), FIB (2.65 [2.15, 3.30] P < .001), PT (1.15 [1.01, 1.30] P = .020), D-Dimer (1.28 [1.22, 1.35] P < .001), TrT (1.00 [1.00, 1.00] P < .001), ST (1.27 [1.11, 1.50] P < .001), and BT (1.37 [1.28, 1.47] P < .001) were significant (Figure 2). Significant factors found in the one-way study (P < .05) were included and analyzed by using multifactor logistic regression. The data presented in Figure 3 showed that Fracture type (Fibular fracture, 9.40 [1.15, 57.89] P = .020), HDL-C (0.17 [0.07,0.38] P < .001), FIB (2.81 [2.09, 3.84] P < .001), D-Dimer (1.33 [1.24, 1.44] P < .001), TrT (1.00 [1.00, 1.00] P < .001), and BT (1.34 [1.23, 1.47] P < .001) were the predictors in the training set that could predict the occurrence of DVT in the perioperative period of LTCF.
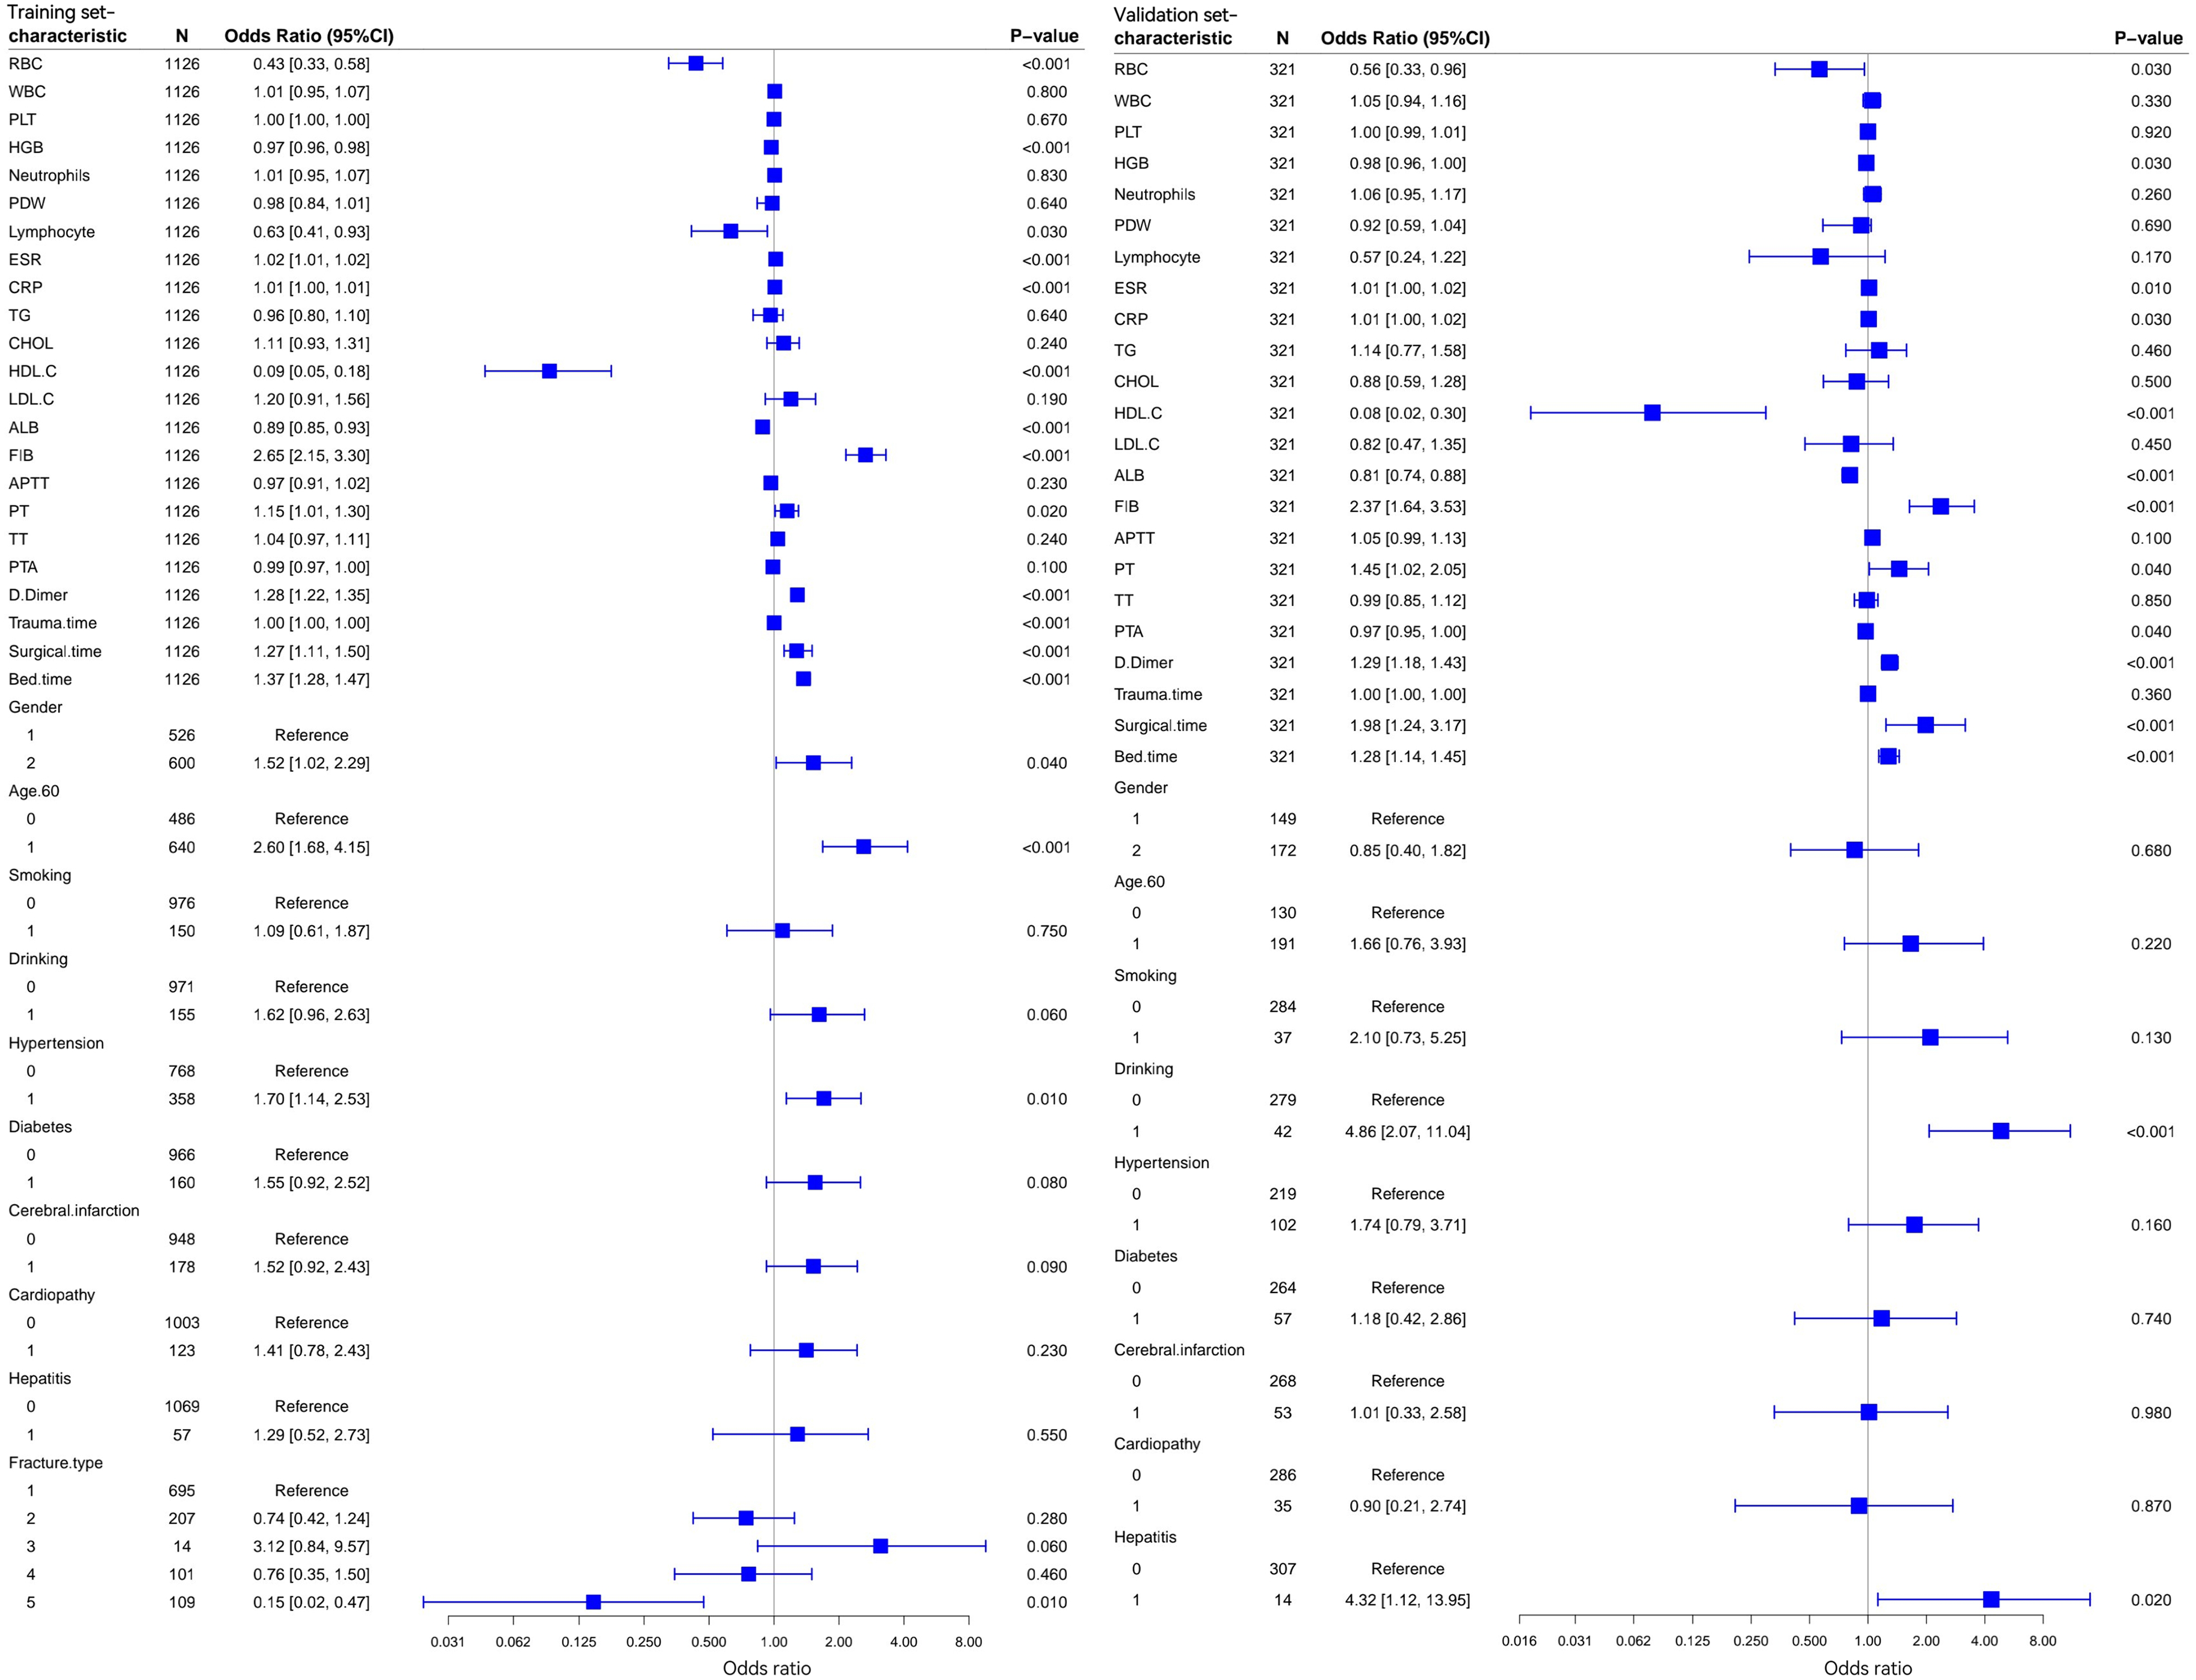
One-way logistic regression results and dendrogram of factors related to lower extremity deep vein thrombosis in the training set and validation set. Training set one-factor logistic regression analysis (left); validation set one-factor logistic regression analysis (right).

Multifactorial logistic regression and dendrogram of factors associated with lower extremity deep vein thrombosis in the training and validation sets. Training set multifactor logistic regression analysis (left); validation set multifactor logistic regression analysis (right).
Meanwhile, we also processed the validation set as described above and analyzed the results as shown in Figures 2 and 3. We found that factors, including Drinking, Hepatitis, RBC, HGB, PDW, ESR, CRP, HDL-C, ALB, FIB, PT, PTA, D-Dimer, Surgical time, and Bed time, had an independent predictive value for DVT. Factors, including Surgical time and Bed time, had an independent predictive value for the occurrence of DVT. After multifactorial analysis, the results showed that Drinking (Yes, 25.59 [5.87, 139.30] P < .001), ALB (0.73 [0.59, 0.88] P = .040), FIB (2.29 [1.23, 4.39] P = .010), D-Dimer (1.34 [1.18, 1.56] P < .010), and BT(1.20 [1.04, 1.37] P < .001) were the predictors validating the concentration to predict the occurrence of DVT in the perioperative period of LTCF.
By comparing the analysis results of the two data sets, we learned that the significance was consistent for factors, such as FIB, D-Dimer, and BT, and inconsistent for factors, such as Drinking, Fracture type, HDL-C, ALB, and TrT. We needed to maximize the predictive value after constructing the clinical nomogram prediction model. Hence, we next tried to combine these 8 factors with the 6 significant factors in the training set and 5 significant factors in the validation set into the test set for comparative analysis, and the results are shown in Figure 4. The C-index obtained by analysis using the 6 significant factors in the training set was 0.974, and the C-index after calculating the correction was 0.945. The C-index was 0.945, and the AUC of its ROC curve was 0.974; the C-index obtained by analysis using the 5 significant factors in the validation set was 0.950, the C-index of the corrected C-index was calculated as 0.926, and the AUC of its ROC curve was 0.949; the C-index of the combined training and validation sets was 0.976, and the C-index of the corrected C-index was 0.948; and the C-index of the 8-factor C-index of the combined training and validation set was 0.976. The C-index was 0.948, and AUC of its ROC curve was 0.976. By comparison, it is obvious that we could determine that the 8-factor of the combined training set and validation set had a better prediction ability for DVT. However, when we performed logistic regression analysis with these 8 factors in the internal dataset, it was found that the factor Fracture type was not significant in the model (P = 0.129), and the remaining seven factors were significant (P < .05); therefore, we finally identified these seven factors (HDL-C, ALB, FIB, D-Dimer, TrT, BT, and Drinking) as the ideal variables of the model. In order to further screen out and verify the above results, we used the internal dataset to conduct Lasso regression analysis (Figure 5) by adding a penalty term to the regression coefficients, making the regression coefficients of the variables of lower importance converge to zero, so as to eliminate the unimportant variables. It was noted that, the final ideal variables obtained from the Lasso regression analysis were consistent with the above results. The final Lasso regression analysis yielded ideal variables that were consistent with the results described above. Finally, in order to rule out the existence of multicollinearity in the new prediction model, we calculated the variance inflation factor (VIF) values of each factor in the new prediction model as follows: Drinking: 1.102, HDL-C: 1.084, ALB: 1.155, FIB: 1.235, D-Dimer: 1.194, Trauma time: 1.084, Bed time: 1.027, and the VIF among all variables was < 1.2, which shows that our results were not affected by multicollinearity.

Plot of 3 different ROC curves as tested by the test set: A 6 factors that were significant after logistic analysis using multifactor regression for the training set. B 5 factors that were significant after regression analysis using multifactor logistic analysis for the validation set. C 8 factors that were significant after multifactor logistic regression analysis for the combined validation set using the training set.

Lasso regression plot
Building a new Nomogram Model
We created a nomogram model based on multifactorial analysis to further test the predictive ability of multiple factors for the perioperative development of DVT in patients with LTCF. We used data from the internal dataset to create the nomogram model (Figure 6) and plotted the ROC curve of the predictive model (Figure 7A), which showed excellent predictive ability with a C-index of 0.918% and 95% CI: 0.894-0.942. The predictive performance of the nomogram was validated using the validation function, which yielded a calculated corrected C-index of 0.913. We then performed the Hosmer-Lemeshow goodness-of-fit test, and the result P = .916 indicated that there was no significant difference between the predicted and true values by the goodness-of-fit test. The calibration curve of the model (Figure 7B) showed a mean error of 0.011. The decision curve analysis (DCA) of the internal dataset (Figure 7C) showed a threshold range of 0.01-0.85, and plotting the clinical impact curve (CIC) (Figure 7D) showed a large deviation between the number of high-risk individuals and the outcome number within the threshold range of 0-0.3; however, the two curves were closer after a threshold range of > 0.3. Both the DCA curve and the CIC curve showed a good clinical benefit through the DCA curve.

Model performance evaluation chart.

Figure A shows the ROC curve of the nomogram model; Figure B shows the calibration curve of the model; Figure C shows the decision analysis (DCA) curve of the model; and Figure D is the clinical impact analysis (CIC) curve of the model.
Threshold Analysis and Performance Optimization Under Different Clinical Scenarios
To address the imbalanced nature of DVT incidence and to provide clinically actionable decision boundaries, we conducted a comprehensive threshold analysis on the independent test set. As shown in Supplementary Table 1, model performance varied substantially across different decision thresholds.
The precision-recall curve (Supplementary Figure 1) illustrates the trade-off between precision and recall across thresholds. Notably, the model achieved perfect precision (1.000) at thresholds ≥0.65, indicating zero false positives when using these high thresholds. The F1 score peaked at threshold 0.35 (F1 = 0.828), representing an optimal balance between precision (0.800) and recall (0.857). Interestingly, recall remained stable at 0.857 across thresholds 0.10-0.35, suggesting that threshold reduction in this range increased false positives without improving sensitivity. Confusion matrices for the three selected thresholds are presented in Supplementary Figure 2, demonstrating the differential classification behavior under each clinical scenario.
Comparative Analysis among new Predictive Models, new Predictors, Inflammatory Immune Domain Factors, and Traditional Scoring Systems
First, we performed logistic regression analyses of the new predictors (PHR and PDR), inflammatory immune domain factors (NLR, PLR, and SII), and traditional scores (Wells and Caprini) (Table 3). Among them, the new predictors, inflammatory immune factors, and traditional scores had an independent predictive value for the occurrence of perioperative DVT in LTCF patients. Next, in order to more intuitively understand the correlation between each factor and DVT, we used box plots and correlation heat maps to visualize them, as shown in Figure 8; and their correlation with the occurrence of DVT was ranked in the order of emphasis and significance as follows: PDR > PHR > NLR > PLR > SII.
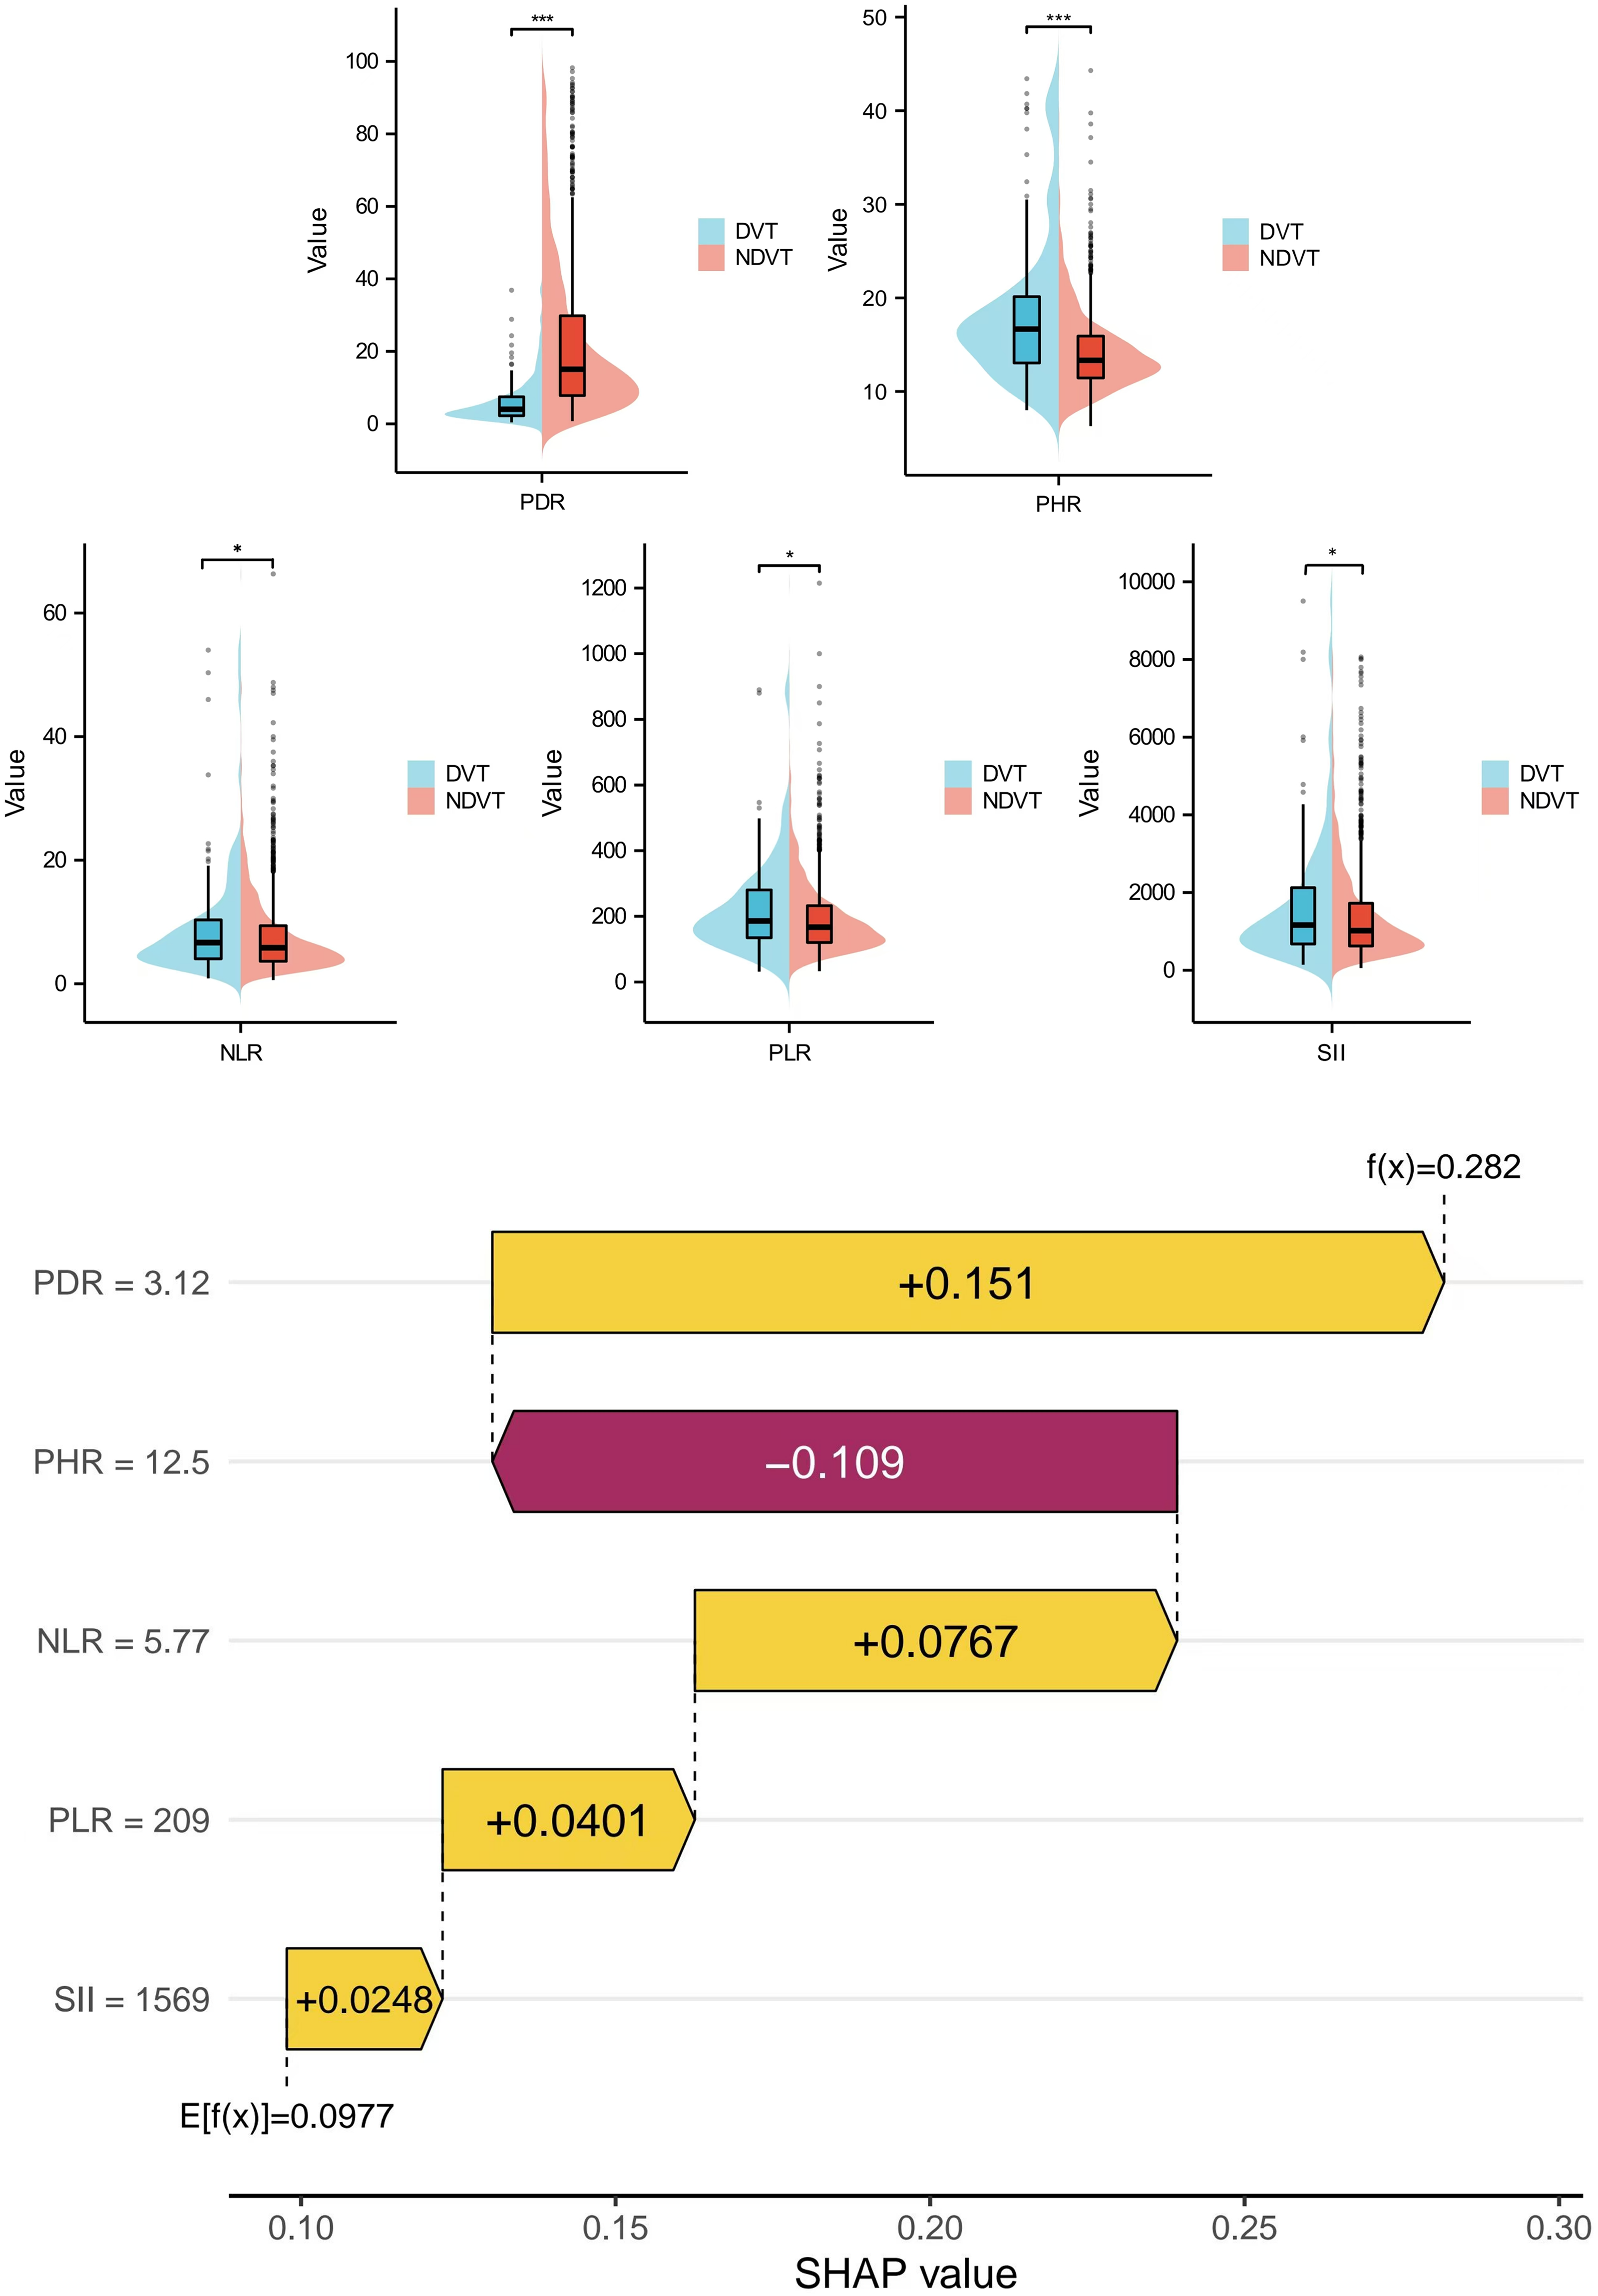
New predictor box plots and correlation diagrams:the strength and importance of the associations between the new predictors (PHR, PDR), inflammatory immune domain factors (NLR, PLR, SII) and the occurrence of DVT were visualized. The ranking of the strength and importance of their association with the occurrence of DVT was PDR > PHR > NLR > PLR > SII.
Characterization of new Predictors and Traditional Scoring Systems.

Logistic regression analysis of new predictors (PHR, PDR), inflammatory immune domain factors (NLR, PLR, SII), and traditional scores (Wells, Caprini), with statistical results expressed using Median (IQR).
Secondly, we compared the new predictive model constructed with the traditional Caprini and Wells scoring systems between the new predictors. The results are shown in Figure 9. The final constructed model showed the following findings: AUC: 0.918, 95% CI: 0.894-0.942; Caprini scoring system AUC: 0.872, 95% CI: 0.843-0.901; Wells scoring system AUC: 0.897, 95% CI: 0.875-0.920; The continuous variables in the new prediction model were used as indicators of the occurrence of DVT in patients with LTCF, corresponding to AUC values of 0.615, 0.681, 0.700, 0.734, 0.769, and 0.836. The AUCs of the new predictors, PHR: 0.689, 95% CI: 0.638-0.740, and PDR: 0.838, 95% CI: 0.807-0.868; The AUC of the inflammatory immune factor NLR: 0.552, 95% CI: 0.504-0.600, The AUC of PLR: 0.557, 95% CI: 0.506-0.607, and The AUC of SII: 0.542, 95% CI: 0.493-0.591. Through comparative analysis, we learned that the efficacy of the constructed prediction model for predicting the occurrence of perioperative DVT in LTCF patients was superior to that of the traditional scoring systems Wells and Caprini. The new predictors PHR and PDR, as well as the inflammatory immune factors NLR, PLR, and SII, were valuable biomarkers for predicting the occurrence of DVT after LTCF.

Comparative analysis:
Discussion
In this retrospective cohort study, to determine the ability to predict perioperative DVT formation in patients with LTCF, we evaluated various biomarkers and compared them with the traditional Wells and Caprini scores. We focused more on LTCF. By comparing the factors that characterize different thrombotic outcomes in the two groups of LTCF patients, we identified numerous factors that were associated with them, such as leukocytes, platelets, hemoglobin, neutrophil counts, ESR, CRP, triglycerides, cholesterol, high-density lipoproteins, low-density lipoproteins, FIB, APTT, TT, and D-Dimer, among others. In order to reduce the effect of confounding factors, we considered performing separate logistic regression analyses of these factors before performing multivariate regression analyses. Based on these findings, we developed a new nomogram-based prediction model, which showed that seven factors, HDL-C, ALB, FIB, D-Dimer, TrT, BT, and Drinking, were independent predictors of perioperative DVT in patients with LTCF. The generalizability and reliability of our observations are underscored by the extensive patient review and validation of our findings in a large, independent cohort, and by validation studies with the test dataset.
The relationship between demographic indicators and clinical characteristics, among which factors such as age, fracture type, history of hypertension, history of diabetes mellitus, history of alcohol consumption, history of cerebrovascular disease, history of chronic hepatitis, chronic kidney disease, TrT, BT, ST, and other aspects of the disease, and the formation of DVT, has been confirmed in many previous studies.19–21 This is not controversial. One point of interest in this study was the relationship between Drinking and DVT formation, although some studies have shown that there is no association between Drinking and the occurrence of DVT.22–24 But for patients who have been drinking alcohol for a long time, a long-term history of alcohol consumption can lead to elevated blood lipids, and then high blood lipids and high cholesterol can put the body in a prolonged low-inflammatory state and increase blood viscosity. 25 This suggests that Drinking has a strong association with the formation of DVT. However, there are no clear studies in the literature that have found Drinking to be associated with DVT, and the relationship between the two parameters needs to be further validated by performing higher quality studies.
Our findings reaffirm the established association of several biomarkers with DVT risk in LTCF patients. Elevated levels of D-Dimer and FIB, along with decreased levels of HDL-C and ALB, were confirmed as significant independent predictors in our cohort (all P < 0.05). These results align with extensive literature linking hypercoagulability, hypoalbuminemia, and dyslipidemia to thrombotic risk.26–30 The relationship between PDW and DVT, however, showed inconsistency across our datasets, reflecting the ongoing debate about its standalone predictive value.31,32 This very limitation of single-parameter biomarkers—their inability to fully capture the multifactorial nature of thrombogenesis—motivated our development of composite indices. The superior predictive performance of PDR and PHR can be interpreted through an integrated pathophysiological framework aligned with Virchow's triad. Venous thrombogenesis requires endothelial injury, stasis, and hypercoagulability — a process involving dynamic interplay between platelets, the coagulation cascade, and the vascular endothelium. PHR quantifies the balance between a pro-thrombotic driver and endogenous vascular protection. The numerator, PDW, is a marker of platelet activation and size heterogeneity. Activated platelets provide a catalytic surface for thrombin generation and release procoagulant mediators, directly fostering hypercoagulability.33,34 The denominator, HDL-C, exerts potent anti-inflammatory, antioxidant, and endothelial-protective effects, helping to maintain vascular integrity and inhibit platelet activation.35,36 An elevated PHR, therefore, represents a high-risk milieu where heightened platelet activity coincides with diminished endothelial defense, conceptually encapsulating both the hypercoagulability and endothelial dysfunction axes of Virchow's triad. PDR integrates signals of platelet-specific activity and global coagulation/fibrinolysis. D-Dimer is a sensitive marker of fibrin degradation and ongoing thrombin generation.37,38 A high PDR suggests a state where platelet activation (PDW) is disproportionately prominent relative to the systemic fibrinolytic response (D-dimer). This may identify patients in whom platelet-driven thrombus formation is a predominant mechanism, a pathology particularly relevant in the post-traumatic inflammatory state following fracture. 39 Thus, PDR and PHR are designed to synthesize biologically interconnected pathways. Their predictive advantage stems from their capacity to reflect a holistic thrombotic risk profile, moving beyond the limitations of single biomarkers.
For other biochemical indicators, high FIB was associated with thrombotic susceptibility in patients with post-traumatic DVT The present study obtained essentially the same results as previous studies with respect to the relationship between FIB, ALB, D-Dimer, HDL-C, and DVT. In the field of post-traumatic inflammatory immunity, it is noteworthy that the systemic immune-inflammation index (SII) can be used as a supplementary diagnostic index in patients with DVT, which is characterized by high sensitivity and specificity in these patients. 40 Currently, the more mainstream predictors in the field of inflammatory immunity, NLR and PLR, have been shown to be significantly associated with DVT in numerous studies.41–43 Our current study tended to investigate the association between inflammatory immune factors and the occurrence of DVT in patients after LTCF, and it showed that there was a significant correlation between NLR, PLR, and SII and the occurrence of perioperative DVT in patients with LTCF, which has a certain value in terms of prediction.
Our nomogram model was constructed based on demographic clinical characteristics of hospitalized patients and specific biomarkers. It had a superior predictive performance for perioperative DVT formation in LTCF patients, with an AUC of 0.918 in this study, and it performed very well in terms of analysis by various tests such as the validation function, the Hosmer-Lemeshow goodness-of-fit test, calibration curves, clinical decision curves, and clinical impact curves. This also proves that our nomogram model fitted our data very well and was clinically applicable. Similarly, some studies have shown some value in constructing nomogram models to predict the risk of developing DVT in related diseases. 22 Compared with some line graphs and risk models constructed in previous studies, the nomogram and diagnostic criteria in our study were explicit, avoiding the selective bias in some previous studies. Meanwhile, we used a relatively large patient population with 1126 patients in the training set and 321 patients in the validation set, and passed the validation of 161 test datasets; and our study was not limited to a specific site or a specific fracture, which expands the scenarios for the use of the new nomogram model in clinical practice. It is worth stating that we followed the Transparent Reporting of Individual Prognostic or Diagnostic Multivariate Predictive Models (TRIPOD) statement. 44
Our threshold analysis reveals that the nomogram's clinical utility extends beyond a single decision point. The model demonstrates remarkable flexibility, with performance characteristics that can be tailored to specific clinical needs through threshold adjustment. High-Specificity Confirmation (Threshold ≥0.65): At these thresholds, the model achieves perfect precision (1.000) and specificity (1.000), making it an ideal tool for confirmatory testing in high-risk situations. When anticoagulation carries significant bleeding risks—such as in elderly patients with frailty, hepatic impairment, or recent surgical procedures—this high-threshold approach ensures that only patients with near-certain DVT risk receive pharmacological prophylaxis, thereby minimizing iatrogenic harm. Balanced Clinical Practice (Threshold 0.35): With the highest F1 score (0.828), this threshold represents the optimal balance between sensitivity (0.857) and precision (0.800) for routine clinical practice. In general orthopedic wards where both missed DVT and unnecessary anticoagulation carry moderate risks, this threshold provides pragmatic guidance, identifying the majority of at-risk patients while maintaining reasonable confidence in positive predictions. High-Sensitivity Screening (Threshold 0.10): Although precision decreases to 0.462 at this threshold, the maintained high recall (0.857) makes it suitable for initial screening in high-stakes environments. In emergency departments or preoperative assessment clinics where missed DVT could lead to catastrophic pulmonary embolism, this sensitive screening approach can identify most at-risk patients for subsequent confirmatory testing with color Doppler ultrasonography. Importantly, our analysis revealed a recall plateau between thresholds 0.10 and 0.35, where sensitivity remained constant at 0.857. This finding has practical implications: reducing the threshold below 0.35 does not improve case detection but substantially increases false positives. Therefore, for most clinical applications, threshold 0.35 represents the lower bound for meaningful sensitivity improvement.
Furthermore, it should be emphasized that all patients in this cohort received guideline-adherent thromboprophylaxis, including mechanical measures and LMWH, unless contraindicated. Therefore, the observed DVT incidence (9.7%) reflects outcomes under real-world standard-of-care conditions, rather than an artifact of omitted prophylaxis.
However, the following limitations of the present study have to be acknowledged: first, retrospective studies may be subject to various biases and there may be potentially unmeasured confounders as well as missing data. Therefore, prospective trials are needed to validate our findings. Second, our analysis only considered biomarkers that are routinely used in clinical practice, thus ignoring other more complex combinations that may have a better predictive ability than the new predictors (PHR and PDR) and inflammatory immune domain factors (NLR, PLR, and SII). Notably, although NLR, PLR, and SII showed statistical significance in univariate analysis, their individual predictive performance as standalone biomarkers was limited (AUC < 0.6). This suggests that these inflammatory indices may be more useful as supplementary indicators within a broader assessment model rather than as independent diagnostic predictors. While PHR and PDR demonstrated significant predictive value in our cohort, their precise pathophysiological roles in venous thrombogenesis warrant further mechanistic investigation. Future studies integrating serial biomarker measurements, endothelial function assays, and platelet activity tests could elucidate whether these ratios truly reflect the dynamic interplay between platelet activation, endothelial health, and fibrinolysis in perioperative settings. Third, this study only collected the baseline biomarker levels of patients on admission, and did not dynamically monitor the fluctuation of indicators at key time points after surgery (such as the peak inflammatory response at 72 h after surgery). Although relying on baseline levels helped reduce confounding, inflammation and coagulation system activation caused by postoperative traumatic stress are dynamic changes, and the level of indicators at this stage may better reflect the real-time risk of thrombosis. Future studies can explore the dynamic monitoring of PHR, PDR and other core indicators, and evaluate their dynamic predictive value for thrombosis risk. Fourth, while our threshold analysis demonstrates the model's adaptability to different clinical scenarios through decision threshold adjustment, real-world implementation would require careful consideration of institutional resources and patient populations. The optimal threshold may vary across different healthcare settings, and future prospective studies should validate these thresholds in diverse clinical environments. Finally, this study is a single-center retrospective analysis, and all data were obtained from Yueyang Hospital affiliated to Hunan Normal University. The enrolled LTCF patients may exhibit region-specific characteristics in terms of age distribution and comorbidity profiles, which could potentially affect the external generalizability of the prediction model. Although internal validation demonstrated robust performance, multi-center prospective studies involving diverse geographical and institutional settings are warranted to confirm its applicability across broader populations. Therefore, we hope to further validate our findings by expanding the study to more centers and larger external datasets, which will ultimately benefit more patients.
Conclusions
The novel nomogram model constructed in this study can effectively predict the risk of perioperative DVT in LTCF. PHR and PDR can be used as new predictors to predict the occurrence of perioperative DVT in LTCF. NLR, PLR, and SII can be used as biomarkers in the field of inflammatory immunity for the formation of perioperative DVT in LTCF. While NLR, PLR, and SII demonstrated significant associations with DVT in univariate analyses, their individual predictive performance was moderate. These inflammatory indices may serve as supplementary biomarkers in conjunction with other clinical predictors, rather than as standalone diagnostic markers.
Supplemental Material
sj-pdf-1-cat-10.1177_10760296261427175 - Supplemental material for New Predictive Model and Predictors for Perioperative Deep Vein Thrombosis Formation in Fractures of the Lower Extremity Versus Traditional Scoring
Supplemental material, sj-pdf-1-cat-10.1177_10760296261427175 for New Predictive Model and Predictors for Perioperative Deep Vein Thrombosis Formation in Fractures of the Lower Extremity Versus Traditional Scoring by Xiaochao Zeng, Hao Liu, Hao Yang, Wenjie Xu and Zhizheng Xiong in Clinical and Applied Thrombosis/Hemostasis
Supplemental Material
sj-pdf-2-cat-10.1177_10760296261427175 - Supplemental material for New Predictive Model and Predictors for Perioperative Deep Vein Thrombosis Formation in Fractures of the Lower Extremity Versus Traditional Scoring
Supplemental material, sj-pdf-2-cat-10.1177_10760296261427175 for New Predictive Model and Predictors for Perioperative Deep Vein Thrombosis Formation in Fractures of the Lower Extremity Versus Traditional Scoring by Xiaochao Zeng, Hao Liu, Hao Yang, Wenjie Xu and Zhizheng Xiong in Clinical and Applied Thrombosis/Hemostasis
Supplemental Material
sj-pdf-3-cat-10.1177_10760296261427175 - Supplemental material for New Predictive Model and Predictors for Perioperative Deep Vein Thrombosis Formation in Fractures of the Lower Extremity Versus Traditional Scoring
Supplemental material, sj-pdf-3-cat-10.1177_10760296261427175 for New Predictive Model and Predictors for Perioperative Deep Vein Thrombosis Formation in Fractures of the Lower Extremity Versus Traditional Scoring by Xiaochao Zeng, Hao Liu, Hao Yang, Wenjie Xu and Zhizheng Xiong in Clinical and Applied Thrombosis/Hemostasis
Footnotes
Abbreviations
Acknowledgements
We thank Selin for Medjaden Inc. for technical editing and writing assistance.
We would like to express our gratitude to the Ultrasound Department of Yueyang People's Hospital for providing relevant data and unwavering collaboration on this work.
Ethical Approval and Consent to Participate
The study was conducted in accordance with the Declaration of Helsinki (revised 2013) and approved by the Ethics Review Committee (2024014) of Yueyang People's Hospital. Patients’ informed consent was waived with the consent of the Ethics Committee.
Author Contributions
ZX and XZ designed the study. HL, HY and WX acquired the data.
XZ analyzed the data and wrote the article.
All authors reviewed the article and approved the final version to be published.
Other individuals not listed as authors did not make substantial contributions to the article.
Funding
The authors received no financial support for the research, authorship, and/or publication of this article.
Declaration of Conflicting Interests
The authors declared no potential conflicts of interest with respect to the research, authorship, and/or publication of this article.
Data Availability Statement
The datasets used and analyzed during the current study are available from the corresponding author on reasonable request.
Supplemental Material
Supplemental material for this article is available online.
References
Supplementary Material
Please find the following supplemental material available below.
For Open Access articles published under a Creative Commons License, all supplemental material carries the same license as the article it is associated with.
For non-Open Access articles published, all supplemental material carries a non-exclusive license, and permission requests for re-use of supplemental material or any part of supplemental material shall be sent directly to the copyright owner as specified in the copyright notice associated with the article.