
Abstract
Objective
The purpose of this study is to develop and validate an improved CA-VTE risk prediction model based on semi-supervised learning (SSL) algorithm.
Methods
This study used a combined retrospective and prospective cohort design. First, data from 2100 cancer patients in a tertiary hospital in Beijing were retrospectively collected, including a “labeled cohort” with CA-VTE outcomes (N = 1036) and an “unlabeled cohort” without outcomes (N = 1064). Then, another dataset were prospectively collected as an external validation set (N = 321). Eight supervised machine learning (ML) algorithms were used to develop CA-VTE risk prediction models and one SSL algorithm was used to improve generalizability of the models (pre- and post-imputation ML models). Model performance were evaluated using the Area Under the Curve (AUC) and Brier score in the prospective cohort, and compare them with the Khorana score.
Results
The eight post-imputation ML models (AUC: 0.816-0.868; Brier score: 0.118-0.160) performed better on the external validation set than the pre-imputation models (AUC: 0.798-0.841; Brier score: 0.133-0.171). In contrast, the AUC of the Khorana score remained unchanged (AUC: 0.693), while its Brier score increased (Brier score: 0.172 vs 0.178).
Conclusion
Based on a retrospective and prospective cohort study design, this study developed eight ML models that outperformed the Khorana score. Using SSL algorithm improved the external validation performance of the models and enhanced prediction accuracy. This study can provide an important reference for the early identification of high-risk factors and stratified preventive care for CA-VTE.
Introduction
Deep vein thrombosis (DVT) and/or pulmonary embolism (PE) occurring in cancer patients are defined as cancer-associated venous thromboembolism (CA-VTE). 1 CA-VTE would occur in 4∼20% of cancer patients at some stage, with the highest risk immediately following cancer diagnosis. 2 Previous studies showed that the presence of cancer increased the risk of VTE by 4 to 9-fold.3–5 VTE is a common and life-threatening condition in patients with cancer, which can cause the increase of need for emergency care visits and/or hospitalization, prolonged therapeutic anticoagulation, increased risk of bleeding and recurrent VTE and other symptoms or morbidity, delay or interruption of anti-cancer treatment, higher mortality and health-care costs, worsened overall survival and quality of life. 1 Therefore, it is crucial to conduct CA-VTE related risk factors identification, risk assessment, and prevention management. 6
CA-VTE related risk factors and mechanisms are multidimensional and interactive, including individual-related factors, tumor-related factors, treatment related factors, and multiple biomarkers. 1 Many cancer-specific VTE risk assessment or prognostic prediction tools using clinical features, biomarkers, and genetic have been developed such as Khorana Score, 7 Vienna CATS Score, 8 Protecht Score, 9 CONKO Score, 10 ONKOTEV Score, 11 COMPASS-CAT Score, 12 CATS/MICA Score, 13 Tic-ONCO Score, 14 MD Anderson Cancer Center CAT Score, 15 and Rising-VTE/NEJ037 Score.16,17 However, many of them have low discriminatory capability and have not yet been validated.2,18,19 Khorana Score remains the most used method, but it also has the same limits and need more research to modify and improve its generalizability.20,21
In recent years, machine learning (ML) algorithms have been increasingly applied in clinical prediction model related research. Many studies have used ML algorithms to develop CA-VTE prediction models, achieving higher prediction accuracy than the previous traditional tools such as the Khorana Score.22–28 However, the following limitations hinder the clinical application and model generalizability of these ML based CA-VTE models: i. insufficient sample size to train models: i.large sample size, for example, at least more than 10∼20 Events Per Variable (EPV)29,30 was required to train accurate ML based CA-VTE models and reduce the risk of model overfitting regardless of the fact that few studies met the sample size requirement; ii. lack of external validation: most studies of ML based CA-VTE models and previous traditional tools have not yet been sufficiently validated; iii. existence of missing data about VTE labels in clinical practice: not all cancer patients will undergo routine venous ultrasound or pulmonary artery CT examination, so that a large number of cases lack outcome labels of VTE. Most ML based CA-VTE models were trained using supervised learning (SL) algorithms and all patients with VTE labels were essential.
Fortunately, semi-supervised learning (SSL) algorithms have received more attention for the ability to simultaneously use labeled and unlabeled data for model development and improvement. 31 Several studies mainly developed multiple disease diagnosis and prognosis prediction models such as osteoporosis, 32 colorectal cancer,33,34 type 2 diabetes, 35 sepsis, 36 and cardiovascular disease 37 based on image data and electronic health records (EHR) using SSL algorithms, which have basically demonstrated that SSL algorithms may have the potential to enhance the generalizability of clinical prediction models. However, few studies were conducted to improve the CA-VTE model generalizability using SSL algorithms based on the labeled and unlabeled EHR data. Therefore, the purpose of this study was to apply SSL algorithms to improve and validate the CA-VTE risk prediction models for healthcare providers, based on a retrospective and prospective cohort study.
Material and Methods
Study Design and Participants
The Retrospective and Prospective Cohort Study
The retrospective cohort of 2100 cancer patients (with CA-VTE label: N = 1036; without CA-VTE label: N = 1064) who were treated in a tertiary hospital in Beijing from January 2017 to October 2019 was used as training set for model development; The prospective cohort of 321 cancer patients who were treated in the same hospital from November 2019 to October 2021 was used as external validation set to evaluate the model performance and generalizability.
The Inclusion and Exclusion Criteria
The inclusion criteria have five items: i) patients ≥18 years old; ii) hospital stay ≥48 h; iii) patients with a confirmed pathological diagnosis of a malignant tumor before being diagnosed with CA-VTE; iv) having at least one test result of blood routine and D-Dimer; v). informed consent (only required for the prospective cohort).
The exclusion criteria include three items: i) having a diagnosis of acute leukemia; ii) being pregnant or lactating; iii) having a diagnosis of VTE (DVT or PE) upon admission or receiving anticoagulation treatment instead of thromboprophylaxis.
Sample Size
This study will include 30 alternative predictive variables, and the sample sizes of two datasets were estimated separately. For training set, according to the 10 EPV rule of thumb, 29 316 patients developed CA-VTE. For external validation set, a study 38 suggested that the sample size for external validation set should be at least 200 cases, with 100 positive cases and 100 negative cases respectively. The sample size of negative group (n = 243) meets the requirement, while the sample size of positive cases (n = 78) is slightly below the recommended threshold.
Candidate Predictors
Based on the literature review of CA-VTE related risk factors, this study included a total of 30 candidate predictive factors from four dimensions: patients-related factors, cancer-specific factors, treatment-related factors, and laboratory variables (Supplementary Figure 1). More details about candidate predictors can be found in our past studies.26,39
Outcomes
The outcome of this study were the occurrence of CA-VTE (1 = yes; 0 = no) including CA-DVT and CA-PE. The diagnosis of CA-DVT was objectively confirmed by color Doppler ultrasonography during hospitalization. The diagnostic methods of CA-PE included computed tomography (CT), magnetic resonance imaging (MRI), pulmonary arteriography, radionuclide lung ventilation or blood flow perfusion scanning, etc.
Ethical Considerations
This study was approved by the Institutional Review Board of Peking University (IRB00001052-18037).
Data Collection, Model Development, and Model Validation
Data Collection
All data were manually collected in an electronic medical record system (EMRS) from a tertiary hospital by two well-trained researchers using standard case report form (CRF). To control the data quality, all CRFs were recorded twice and double-checked in the Epidata software (v 3.1). Both in the retrospective and prospective cohorts, all candidate predictors were recorded before the screen for CA-VTE.
Data Preprocessing
Before model development, missing rate for candidate variables were calculated. Categorical variables had no missing values. Missing rate of continuous variables were low (0.2%∼0.9%) and the median values were used to fill the missing continuous variables.
Statistical Description and Statistical Inference
Continuous variables were described by median with interquartile range. Categorical variables were described by frequency and percentage. The chi-square test, Mann-Whitney test, Kruskal-Wallis test, and one-way ANOVA were appropriately used to conduct univariable analysis.
Predictors Selection
Predictors selection was conduct in training set using univariable analysis and Lasso regression. Variables with a P-value <.100 in univariable analysis and having a non-zero coefficient in the Lasso regression were entered into the model.
Model Development and Validation Based on SSL Algorithm
This study used self training algorithm, a kind of typical SSL algorithm, to perform pseudo label imputation of CA-VTE and model retraining. Model development and validation in self training algorithm: i) Eight ML algorithms, including linear discriminant analysis (LDA), logistic regression (LR), classification, regression and tree (CART), random forest (RF), gradient boosting machine tree (GBM), extreme gradient boosting tree (XGB), support vector machine (SVM), and artificial neural network (ANN), were firstly used to train the “before imputed models” in the “labeled cohort”(N = 1036, before imputed training set); ii) The best model was selected to perform “CA-VTE pseudo label imputation” on the “unlabeled cohort” (N = 1064); iii) The “labeled cohort” and “unlabeled cohort” were merged as the “imputed training set” (N = 2100) and to retrain the eight “imputed models”; iv) Compared the external validation performance between the “imputed models” and the “before imputed models” in the same prospective cohort (N = 321); v) Selected the optimal model, and finally make model presentation and report. To determine the best hyperparameters of CART, RF, GBM, XGB, SVM, and ANN, five-fold cross-validation (repeated three times) and grid research method were used both in “before imputed training set” and “imputed training set”, respectively. The study flowchart was shown in Figure 1.

The study flowchart.
Model Performance
Model performance were compared among eight ML models and Khorana Score. This study comprehensively evaluated model performance from four dimensions: discrimination, calibration, clinical utility, and model improvement. i) Model discrimination: AUC and ROC curves; ii) Model calibration: Brier Score and calibration curves; iii) Clinical utility: Decision curve analysis (DCA) curves; iv) Model improvement: Category based net reclassification index (Category based NRI) and integrated discrimination improvement (IDI).
Model Presentation and Report
It is necessary to conduct model presentation, report, and explanation for the recommended optimal CA-VTE risk prediction model. Among eight ML models trained in this study, LDA, LR, and CART belong to interpretable models, while RF, GBM, XGB, SVM, and ANN belong to black box models. If the optimal model is LDA or LR, this study will present it in nomogram; If the optimal model is CART, present it in a decision tree; If the optimal model is a black box model such as RF, GBM, XGB, SVM, and ANN, it can be explained from two dimensions: dataset level and instance level.40,41 For the dataset level, global explanation method such as variable importance ranking (VIM) will be used. In terms of the instance level, local explanation method such as break-down plot will be used.40,41
We used Statistical Package for Social Sciences 20.0 and R 3.6.1 (https://www.r-project.org/) to conduct statistical analysis. A two-sided P value <.05 was regarded as statistically significant. This study was written and reported in accordance with the TRIPOD + AI guideline and the BMJ step-by-step guide.42,43
Results
Characteristics of the Retrospective Cohort and Prospective Cohort
The results of the comparison of variable characteristics of the two cohorts were shown in Table 1. A total of 2100 patients (mean [SD] age, 58.71 [12.51] years; 1060 [50.50%] male) and 321 patients (mean [SD] age, 62.54 [13.28] years; 194 [60.40%] male) were included in the retrospective cohort and prospective cohort, respectively. There were 316 patients (15.00%) who developed confirmed CA-VTE in the retrospective cohort and a total of 78 patients (24.30%) were diagnosed with CA-VTE in the prospective cohort. The differences in the following variables in the two cohorts were significant: Gender, Age, Smoking, Bed rest, Site of tumor, Tumor stage, Radiotherapy, Targeted or immunotherapy, CVC, PICC, Transfusion, NSAID, Previous VTE history, Edema, CCI, BMI, Hb, FIB, Khorana Score, Khorana Score + D-dimer, Khorana + D-dimer risk level, and CA-VTE.
Characteristics of the Retrospective Cohort and Prospective Cohort(n(%)/Mean(SD)).

†CVC, Central venous catheter; PICC, Peripherally inserted central catheter; NSAID, Nonsteroidal Anti-inflammatory Drugs; ICU/CCU, intensive care unit or cardiology intensive care; CCI, Charlson Comorbidity Index; BMI, body mass index; WBC, white blood cell count; PLT, platelet count; Hb hemoglobin; PT, Prothrombin time; APTT, activated partial thromboplastin time; TT, thrombin time; FIB, fibrinogen.
Univariate Analysis and Predictor Selection
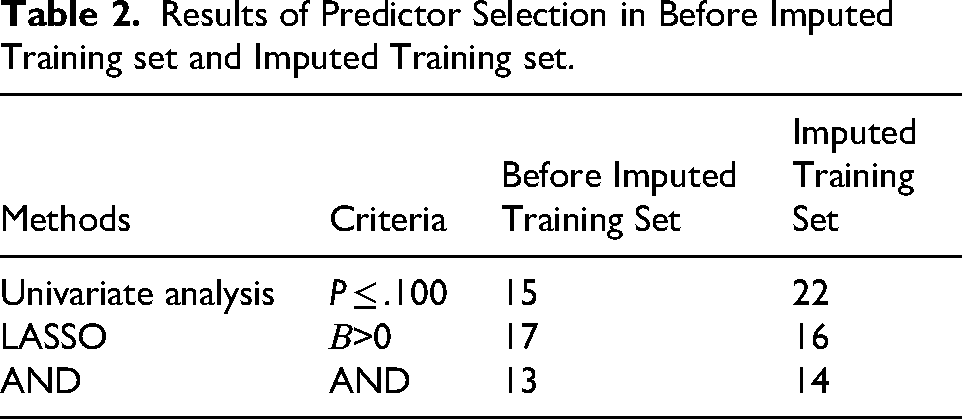
In the Before imputed training set, univariate analysis (P ≤ .100) and LASSO regression (the regression coefficient was not zero) screened out 22 and 16 variables, respectively (Supplementary Tables 1 and Table 2). In the Imputed training set, univariate analysis and LASSO regression screened out 15 and 17 variables, respectively (Supplementary Tables 1 and Table 2). Finally, 13 and 14 variables were selected in the Before imputed training set and the Imputed training set, respectively (Table 2), according to two screening criterias, univariate analysis (P ≤ .100) and LASSO regression (the regression coefficient was not zero).
Results of Predictor Selection in Before Imputed Training set and Imputed Training set.
Hyperparameter Tuning and Model Training
This study trained eight models in the Before imputed training set and the Imputed training set, respectively, including LDA, LR, CART, RF, GBM, XGB, SVM and ANN. This study used the five-fold cross-validation (repeated three times) and grid research method for hyperparameter tuning, and the reference indicator was AUC. Hyperparameter tuning results can be found in Supplementary Table 2. LDA and LR have no hyperparameters and do not require tuning.
Model Validation and Model Performance
Model Discrimination
The model discrimination results of the Before imputed training set, Imputed training set, and External validation set were shown in Table 3 and Supplementary Figure 2. In the three datasets, all model AUC in Imputed training set were higher than those in the Before imputed training set. As for the same algorithm model, the AUC of the joint D-Dimer model was higher than the AUC of the model non-combined D-Dimer. Among different models, the RF model had the highest AUC in both Before imputed and Imputed training set, and the RF model AUC in the external validation set is medium.
Results of Model Performance in Training set and Validation set.

†LDA, linear discriminant analysis; LR, logistic regression; CART, classification, regression and tree; RF, random forest; GBM, gradient boosting machine tree; XGB, extreme gradient boosting tree; SVM, support vector machine; ANN, artificial neural network; Khorana, Khorana Score.
Model Calibration
The model calibration results of the three datasets were also shown in Table 3 and Supplementary Figure 3. In the three datasets, all model Brier Score in Imputed training set were lower than those in the Before imputed training set. As for the same algorithm model, the Brier Score of the joint D-Dimer model was lower than the Brier Score of the model non-combined D-Dimer. Among different models, the RF model had the lowest Brier Score in both Before imputed and Imputed training set, and the RF model Brier Score in the external validation set is medium.
Model Clinical Utility
Figure 2 presented the DCA curves of the before imputed models and imputed models in the external validation set, respectively. In the external validation set, the DCA curves of the eight imputed models were all closer to the upper right of the coordinate axis than the DCA curves of the before imputed models. The clinical net benefit of the eight imputed models were higher than the eight before imputed models within the same probability threshold range.

DCA curves for eight models and Khorana Score in validation set. ‡Figure A, B, C, and D show DCA curves in validation set; “_DD” indicates models combing with D-dimer; “_imp” indicates the imputed models; †LDA, linear discriminant analysis; LR, logistic regression; CART, classification, regression and tree; RF, random forest; GBM, gradient boosting machine tree; XGB, extreme gradient boosting tree; SVM, support vector machine; ANN, artificial neural network; Khorana, Khorana Score.
Model Improvement
Taking into account the model discrimination, calibration and clinical utility, the RF model was determined as the optimal model. Table 4 presented the comparison results of two model improvement indicators of the before imputed and imputed RF models: Category-based NRI and IDI. There was no significant difference in Category-based NRI of the two models (Category-based NRI=−0.009, P = .765; Category-based NRI=−0.027, P = .434). There was a significant difference in IDI between the two models (IDI = 0.083, P < .001).
Category-Based NRI and IDI of RF Models in Validation set.

‡RF, random forest; “_DD” indicates models combing with D-dimer; “_imp” indicates the imputed models; NRI, net reclassification index; IDI, integrated discrimination improvement.
Model Report and Interpretation
Supplementary Figure 4 and Figure 3 respectively present the variable importance ranking (VIM) of the eight models and Khorana score before and after imputation in the training set. The VIM for the eight models before and after imputation are similar. The first two predictive factors are D-Dimer and Age, while the top five predictive factors are mostly D-Dimer, Age, VTEHistory, Bed rest, and CCI.

Variable importance (VIM) of eight models and Khorana Score in imputed training set. ‡Figure A, B, and C show VIM in imputed training set; “_DD” indicates models combing with D-dimer; “_imp” indicates the imputed models; †LDA, linear discriminant analysis; LR, logistic regression; CART, classification, regression and tree; RF, random forest; GBM, gradient boosting machine tree; XGB, extreme gradient boosting tree; SVM, support vector machine; ANN, artificial neural network; Khorana, Khorana Score; §DDimer, D-Dimer; VTEHistory, Previous VTE history; NSAID, Nonsteroidal Anti-inflammatory Drugs; TumorStage, tumor of stage; CCI, Charlson Comorbidity Index; Hb hemoglobin; WBC, white blood cell count; APTT, activated partial thromboplastin time; tumor_of_site, tumor of site; PICC, Peripherally inserted central catheter; ICUCCU, intensive care unit or cardiology intensive care; K_DDimer, D-Dimer≥243 µg/L; K_Hb_EPO, Hb < 100 g/L or using erythropoietin drugs; K_WBC, WBC>11 × 109/L; K_PLT, PLT≥350 × 109/L; K_BMI, BMI≥24 kg/m2.
Taking the RF_DD model and the RF_DD_imp model as an example, the break-down plot method of locally interpretable models was used to randomly selected three patients from the external validation set for model interpretation. The three patient IDs were 103 (CA-VTE = no), 194 (CA-VTE = yes), and 298 (CA-VTE = no). The interpretation results are shown in Figure 4.

Break-down plot of RF models in validation set. ‡RF, random forest; “_DD” indicates models combing with D-dimer; “_imp” indicates the imputed models; †Randomly select three patients from validation set: ID = 103 (CA-VTE = No), 194 (CA-VTE = Yes), and 298 (CA-VTE = No); §Intercept, RF model intercept, baseline risk of CA-VTE for this patient; prediction, the probability of CA-VTE for this patient predicted by RF model; ξDDimer, D-Dimer; Bed, Bed rest≥3days; VTEHistory, Previous VTE history; NSAID, Nonsteroidal Anti-inflammatory Drugs; TumorStage, tumor of stage; CCI, Charlson Comorbidity Index; Hb hemoglobin; WBC, white blood cell count; APTT, activated partial thromboplastin time; tumor_of_site, tumor of site; PICC, Peripherally inserted central catheter; ICUCCU, intensive care unit or cardiology intensive care; Target_Immuno, targeted therapy or immunotherapy.
Discussion
This study is based on a retrospective cohort of 2100 cases (1036 labeled and 1064 unlabeled) and a prospective cohort of 321 cases. The SSL (self-training) algorithm was used to perform “labeled outcome imputation” on the CA-VTE of the unlabeled cohort. Eight machine learning algorithms CA-VTE risk prediction models (LDA, LR, CART, RF, GBM, XGB, SVM, and ANN) were trained and validated, and the before and after imputation models were compared based on model discrimination, calibration, clinical utility, and model improvement indicators. The results were also compared with the Khorana Score, and the models with and without combining with D-Dimer were also compared.
More Predictive Factors Were Selected from the Imputation Training set
Two methods were used to screen predictive factors: univariate analysis (P ≤ .100) and LASSO regression (retaining variables with non-zero coefficients). The imputation training set screened more predictive factors compared to the before imputation training set. When conducting univariate analysis, 15 variables with P ≤ .100 were selected from the before imputation training set, while 22 variables with P ≤ .100 were selected from the imputation training set. Using LASSO regression analysis, 16 and 15 variables were selected from before and after imputation training set, respectively. Simultaneously considering two criteria, 13 and 14 variables were selected, respectively. After imputation, two variables (site of tumor and radiotherapy) were added compared to before imputation, and one variable (targeted or immunotherapy) was removed.
The “site of tumor” variable added after imputation is important. The classification of “site of tumor” is mainly based on Khorana Score 7 and other tumor specific scores.8,13 When considering cancer-related variables, non-specific score mostly only includes one variable “patients with advanced cancer".44–46 However, the CA-VTE risk varies among different types of tumor patients. The “site of tumor” did not meet the criteria in the univariate analysis of the before imputation training set (P ≤ .100), but meet the criteria in the imputation training set, which may be related to sample size expansion. Some studies suggest that the larger the sample size, the easier it is for statistical tests to be significant. 47 Therefore, it is necessary to expand the sample size as much as possible when conducting research on predictive models. When selecting predictive factors, the screening criteria can be appropriately relaxed (such as P ≤ .100, P ≤ .150, etc) to avoid missing important predictive factors. At the same time, even if some important predictive factors are not statistically significant, considering the support of literature evidence and professional understanding, they should still be included in the model.
The Model Performance After Imputation Was Superior to That Before Imputation
This study compared the performance of the models before and after imputation across four dimensions: model discrimination (Table 3 and Supplementary Figure 2), calibration (Table 3 and Supplementary Figure 3), clinical utility (Figures 2), and model improvement metrics (Table 4). The comprehensive performance of the models after imputation was superior to that before imputation. This study also compared the performance of the eight CA-VTE models with and without the inclusion of D-Dimer, as well as the performance of these eight CA-VTE models compared to the Khorana score. For the same model, performance was superior when combined with D-Dimer compared to without it. Among different models, all eight CA-VTE models outperformed the Khorana score. Among the eight CA-VTE models, the RF model demonstrated the best overall performance. Wang et al, 48 who compared the effectiveness of nine machine learning algorithms in predicting VTE risk in general patients (27.13% were cancer patients), also found that the RF model performed better than others. Similarly, Lei et al, 24 who compared five models (RF, Adaboost, Xgboost, logistic regression, and KNN) for predicting VTE risk in lung cancer patients, also found the RF model to be optimal. Therefore, this study recommends the RF model combined with D-Dimer as the optimal model.
Based on the comparison of model metrics across multiple dimensions, this study found that the models after imputation demonstrated better performance upon external validation. This finding is consistent with conclusions from other related studies. Hou et al, 49 utilizing a SSL algorithm developed by their team with 271 labeled cases and 19,945 unlabeled cases, improved the prediction accuracy for the risk of type 2 diabetes patients. Within the same dataset, their SSL model achieved an AUC of 0.763, whereas the LASSO model only achieved an AUC of 0.488. Chi et al 34 developed a semi-supervised logistic regression (SSLR) algorithm, which showed superior overall performance compared to LR, NB, RF, SVM, and ANN models in predicting mortality risk in colorectal cancer patients. To date, few studies have applied SSL algorithms to train CA-VTE risk prediction models based on data after “label outcome imputation”. By applying the SSL algorithm, this study effectively utilized the vast amount of clinical “unlabeled” data, expanded the sample size of the training set, and uncovered more predictors, which is beneficial for the external validation and generalization of the model.
Interpretability Analysis Can Be Performed for Black-Box Machine Learning Models
Unlike traditional models (eg, LR, COX) that use regression coefficients, ORs (or HRs), score tools, and nomograms for interpretation, the optimal model in this study is RF. The Random Forest (RF) is an ensemble model composed of multiple CART decision trees. Ensemble models belong to the category of black-box models and are not easily interpretable. Therefore, this study employed two interpretation methods for black-box models – Variable Importance Measure (VIM) and break down plot – to provide explanations at the dataset level and the instance level, respectively.
This study compared the VIM ranking results of the eight models and the Khorana score on the training sets before and after imputation (Supplementary Figure 4). The ranking results were similar across the eight models, with slight differences for the Khorana score. It was observed that predictors such as D-Dimer, age, prior VTE history, bed rest, and CCI were consistently ranked relatively high across all eight models, generally within the top five positions. This indicates the strong association of these five predictors with CA-VTE; even when different algorithms are used for modeling, it does not affect their importance ranking. Yuan et al 50 developed a nomogram based on LR for predicting gastric cancer-associated VTE, which included predictors such as advanced malignant tumor (OR = 3.870, P < .001), CVC (OR = 2.239, P < .001), D-Dimer (OR = 2.096, P < .001), ECOG score (OR = 1.406, P = .001), and adjuvant chemotherapy (OR = −0.366, P = .550). In the study by Lei et al 24 predicting lung cancer-associated VTE, according to the RF model's ranking, prior VTE history was the most important variable among many, followed by tumor stage, with age being less important. The VTE risk prediction model for Chinese breast cancer patients developed by Li et al 51 also included predictors such as age, D-Dimer, and number of cardiovascular comorbidities.
At the instance level, this study used the break down plot, taking the RF_DD model with the best overall performance as an example, to provide detailed, personalized explanations for the predictions of three randomly selected patients from the external validation set (ID = 103, CA-VTE = no; ID = 194, CA-VTE = yes; ID = 298, CA-VTE = no) (Figure 4). Taking patient 194 who developed CA-VTE as an example, both the pre- and post-imputation RF_DD models predicted this patient as high risk (RF_DD: cut-off = 38.7%, predicted risk 44.8%; Imputed RF_DD: cut-off = 45.0%, predicted risk 47.0%). Using the break down plot, it is possible to explain in detail the magnitude and direction (ie, increasing or decreasing risk) of the contribution of each predictor to the predicted risk value for patient 194. Furthermore, based on the break down plot method, the same value of a predictor might contribute differently for different patients. This reflects the complexity of the CA-VTE pathogenesis, involving the combined effect of multiple risk factors, where the relationship between risk factors and CA-VTE risk is not simply linear. This aids in personalized risk assessment and guides CA-VTE prevention and management. The application of black-box model interpretation techniques like break down plot, LIME and Shapley in disease risk prediction is increasingly common and garnering significant attention.40,52 Lundberg et al 53 used various machine learning algorithms for modeling and applied the Shapley method to dynamically assess and interpret the predicted risk of intraoperative hypoxemia. Karhade et al 54 used multiple machine learning algorithms to predict the 90-day and 1-year mortality risk in patients with spinal metastases and employed the LIME method to interpret the prediction results.
Strengths and Limitations
This study has the following strengths: i) This study employed a SSL algorithm for “outcome label imputation” in an “unlabeled cohort,” thereby expanding the training set sample size, uncovering more useful predictors, improving the external validation performance of the CA-VTE prediction model, and enhancing its generalizability. ii) The model performance was comprehensively compared across multiple dimensions—including model discrimination, calibration, clinical utility, and model improvement metrics—among eight ML CA-VTE prediction models, against the Khorana score. This comparative analysis ultimately identified the optimal models in this study (RF_DD and Imputed RF_DD). iii) Interpretations of the optimal black-box model were provided at both the dataset level and the instance level. This involved comparing the importance of different predictors and offering personalized explanations using patient examples, which aids clinical healthcare staff in understanding and applying the model, thereby facilitating CA-VTE risk assessment and preventive management.
This study also has the following limitations: i) Study design: This is a single-center study with retrospective and prospective cohorts. Model training was primarily based on the retrospective cohort. The generalizability of the models still requires further validation through future multi-center, prospective studies. Nevertheless, the application of the SSL algorithm in this study improved the model's external validation performance to some extent. ii) Predictors: This study included readily available multi-dimensional clinical predictors (tumor-related, individual, treatment-related, and laboratory indicators) but could not incorporate novel tumor-specific molecular markers that are currently of widespread interest, such as soluble P-selectin. iii) Sample size: The sample size of this study was somewhat insufficient. The pre-imputation training set met the 5 Events Per Variable (EPV) rule but not the 10 EPV rule, while the post-imputation training set met the 10 EPV rule. The total sample size and the sample size of the negative group in the external validation set basically met requirements, but the number of positive cases was slightly lower than the sample size requirement. However, by using the SSL algorithm to perform “label outcome imputation” on the “unlabeled cohort,” the training set sample size was expanded to a certain degree.
Conclusion
In this study, we employed the SSL algorithm to perform CA-VTE “label outcome imputation” on an unlabeled cohort. This approach expanded the sample size, screened for more predictors, and improved the external validation performance of eight ML CA-VTE prediction models and the Khorana score. This contributes to promoting the clinical application of high-accuracy ML prediction models for CA-VTE and provides support for healthcare professionals in implementing CA-VTE risk assessment and management. Future research should focus on external validation studies of CA-VTE models based on multi-center, prospective, large-sample cohorts.
Supplemental Material
sj-docx-1-cat-10.1177_10760296261416914 - Supplemental material for Semi-Supervised Learning to Improve Generalizability of Cancer Associated-Venous Thromboembolism Risk Prediction Models
Supplemental material, sj-docx-1-cat-10.1177_10760296261416914 for Semi-Supervised Learning to Improve Generalizability of Cancer Associated-Venous Thromboembolism Risk Prediction Models by Shuai Jin, Chong Wang, Dan Qin, Baosheng Liang, Lichuan Zhang, Weiyin Gao, Xiao Wang, Bo Jiang, Benqiang Rao, Hanping Shi, Lihui Liu and Qian Lu in Clinical and Applied Thrombosis/Hemostasis
Footnotes
Acknowledgments
This work was partially supported by Department of Gastrointestinal Surgery in Beijing Shijitan Hospital, Capital Medical University. It was also conducted and supervised by the Nursing School of Peking University, Nursing School of Capital Medical University, and Public Health School of Peking University. We are also grateful to Lichuan Zhang, Xiaoxia Wei, Weiyin Gao, Xiao Wang, and others for their assistance in data collection.
Ethics Statement
This study was approved by the Institutional Review Board of Peking University (IRB00001052-18037). Informed consent was obtained from all participants in the prospective cohort.
Author Contributions Statement
Funding
The authors disclosed receipt of the following financial support for the research, authorship, and/or publication of this article: This work was supported by the Natural Science Foundation of Beijing Municipality, Capital Medical University Research and Cultivation Foundation, The National Key Research and Development Project of China, Capital Medical University Basic Clinical Collaborative Research Project on Digital Intelligence Nursing, (grant number 7244285, PYZ23028, 2017YFC1309204, SZHL23Q01, SZHL23Q08).
Declaration of Conflicting Interests
The authors declared no potential conflicts of interest with respect to the research, authorship, and/or publication of this article.
Declaration of Generative AI and AI-Assisted Technologies in the Writing Process
No AI tools/services were used during the preparation of this work.
Data Availability Statement
The data and code that support the findings of this study are available from the corresponding author upon reasonable request.
Supplemental Material
Supplemental material for this article is available online.
References
Supplementary Material
Please find the following supplemental material available below.
For Open Access articles published under a Creative Commons License, all supplemental material carries the same license as the article it is associated with.
For non-Open Access articles published, all supplemental material carries a non-exclusive license, and permission requests for re-use of supplemental material or any part of supplemental material shall be sent directly to the copyright owner as specified in the copyright notice associated with the article.