
Abstract
Background
The Caprini risk assessment model (RAM) is widely used to evaluate venous thromboembolism (VTE) risk across diverse patient populations. However, the original risk stratifications may require modification for hip fracture patients to improve predictive accuracy. This study aimed to optimize VTE prediction by refining the Caprini model and integrating additional predictive factors.
Methods
This retrospective cohort study included 1114 elderly hip fracture patients screened at Peking Union Medical College Hospital between May 2012 and February 2023. A modified VTE prediction model was developed by integrating D-dimer levels and injury-to-admission time into the Caprini RAM. The sensitivity, specificity, and the area under the curve (AUC) of the model were determined to assess its predictive performance.
Results
The revised Caprini model effectively stratified patients into three VTE risk levels on the basis of their scores: 14.0% for ≤9, 24.0% for 10–11, and 39.4% for ≥12. Both the Caprini score and risk level demonstrated better predictive ability than D-dimer did (AUCs: 0.606 and 0.614 vs 0.552). Among patients admitted within one day after injury, the D-dimer levels were significantly higher in VTE patients compared with non-VTE patients from day 3 onwards (p = .012). Incorporating the injury-to-admission time with the Caprini score further improved the AUC from 0.614 to 0.649. Among models maintaining the sensitivity and negative predictive value above 90%, this combination model demonstrated the best performance. In contrast, for patients with delayed admission (>1 day), D-dimer levels were significantly higher in those with VTE than in those without VTE (p < .001). Combining the Caprini score with the D-dimer level provided a more accurate prediction (AUC: 0.681), significantly outperforming the Caprini score alone (AUC: 0.552). When the sensitivity exceeded 95%, the D-dimer threshold model across the three Caprini risk levels outperformed the Caprini risk levels combined with the D-dimer level (AUC: 0.592 vs 0.571) and demonstrated a significant advantage at 100% sensitivity.
Conclusions
Reclassifying the Caprini score into three risk levels may improve preoperative VTE stratification in elderly hip fracture patients. Integrating the injury-to-admission time and D-dimer level into the Caprini model was associated with improved predictive performance. Standardizing the timing of D-dimer sampling may reduce timing-related variability in VTE assessment. External multicentre validation is warranted.
Keywords
Introduction
Elderly hospitalized patients have a high risk for venous thromboembolism (VTE), including deep vein thrombosis (DVT) and pulmonary embolism (PE). 1 This risk is particularly pronounced in patients undergoing surgery, particularly orthopaedic procedures. 2 However, routine thromboprophylaxis significantly reduces the incidence of VTE. 3 Among patients with hip fractures, 79% receive thromboprophylaxis preoperatively, and 99% receive it postoperatively, resulting in a relatively low VTE rate of 2.5%. 4 Even so, the incidence of preoperative VTE in hip fracture patients ranges from 11.1% to 16%,5–7 underscoring the need for screening elderly hip fracture patients for VTE before surgery to ensure early detection and management.
The most common method for diagnosing preoperative DVT in hip fracture patients is lower extremity venous ultrasound. However, the risk of preoperative DVT varies among individuals. While routine ultrasound screening for all patients receiving DVT prophylaxis is not cost-effective, 8 delaying the examination after injury can increase the likelihood of DVT. 9 Therefore, to ensure early DVT detection, it is essential to identify high-risk patients and perform targeted ultrasound screening in a timely manner.
In the identification of individuals at high risk of DVT, thrombosis risk assessment tools are crucial. Among them, the Caprini risk assessment model (RAM) 10 is widely used to evaluate DVT risk in various populations, including hospital inpatients, 11 surgical patients, 12 cancer patients, 13 and critically ill surgical patients. 14 Recently, its effectiveness has also been explored in orthopaedic patients.15–18 However, the original Caprini risk levels (0-1 for low risk, 2 for moderate risk, 3-4 for high risk, and ≥5 for highest risk) may lack specificity for hip fracture patients, as all patients with a score >5 are classified at the highest risk. A Caprini score ≥ 12 has been suggested as the threshold for preoperative venous ultrasound screening in hip fracture patients. 16 This emphasizes the need for standardized risk categories across medical and surgical populations to increase the generalizability of the Caprini RAM. 19 Therefore, reclassifying the Caprini risk levels for hip fracture patients is essential to the accurate identification of patients with the highest risk of DVT.
The acute DVT diagnosis and management guidelines 20 recommend the use of D-dimer values to predict DVT based on different risk stratifications of the Wells score (low, moderate, and high clinical pretest probabilities). This method has been proven to be more reliable than other methods and can be used to exclude DVT21,22 and DVT recurrence. 23 Our previous study identified D-dimer as a potential predictor of preoperative DVT in patients with end-stage knee osteoarthritis. 24 Further research demonstrated that the predictive accuracy of D-dimer thresholds, stratified by Caprini risk levels, was superior to the Caprini RAM alone for DVT. 25 Additionally, injury-to-admission time is a recognized risk factor for DVT in hip fracture patients, is frequently included in predictive models, 26 and may be combined with the Caprini model to improve DVT prediction.
However, the clinical utility of D-dimer in predicting VTE risk in elderly hip fracture patients remains uncertain and requires further validation. Additionally, specific Caprini risk stratifications for this population and optimal D-dimer cut-off values in combination with these stratifications for VTE diagnosis have not been established. Therefore, the aims of this study were to (1) evaluate whether modifying the Caprini risk stratification improves VTE prediction accuracy in elderly hip fracture patients; (2) validate the predictive value of D-dimer for VTE risk; and (3) assess the effectiveness of combining the Caprini model with D-dimer or the injury-to-admission time for preoperative VTE diagnosis.
Methods
Study Population
This retrospective study included participants from Peking Union Medical College Hospital (PUMCH). Between May 2012 and February 2023, we followed 1664 consecutive patients with hip fractures admitted to the trauma unit. Eligible patients were aged ≥60 years; were diagnosed with femoral neck, intertrochanteric, or subtrochanteric fractures; were hospitalized for more than 48 h; and received definitive care, including anticoagulation prophylaxis, pain management, and surgery. The exclusion criteria were multiple fractures, periprosthetic or nonprimary hip fractures, absence of colour Doppler ultrasonography data, or incomplete medical records. The study was approved by the Institutional Review Board of PUMCH (IRB number: K3624) and conducted in accordance with the 1964 Declaration of Helsinki. Given its retrospective design, the requirement for informed consent was waived.
Data Collection
Clinical data obtained from the Hospital Information System (HIS) included demographic variables such as age, sex, body mass index (BMI), injury side, hip fracture type, time from injury to admission, preoperative blood transfusion, and placement of a peripherally inserted central catheter (PICC) line. Variables related to medical history included varicose veins, pneumonia, chronic obstructive pulmonary disease (COPD), acute myocardial infarction, congestive heart failure, malignancy, previous DVT or PE, stroke within the past month, and multiple injuries.
Preoperative coagulation tests, including D-dimer, fibrinogen (Fbg), the international normalized ratio (INR), and activated partial thromboplastin time (APTT), were typically conducted within three days of admission. If the timing of the test varied, priority was assigned as follows: day 2 results were preferred, followed by day 1 results, and results obtained on day 3 or later were used only when data for earlier timepoints were unavailable. This prioritization was based on the distribution of test availability, where tests were most frequently conducted on day 2, followed by day 1, with day 3 and later being the least common. This approach ensured greater consistency in the data comparison.
VTE Risk Assessment
The 2005 Caprini RAM, 10 is typically used to conduct a comprehensive risk assessment for VTE in surgical and inpatient settings. This tool includes 40 risk factors, each assigned a specific point: 1 point (17 factors), 2 points (8 factors), 3 points (10 factors), or 5 points (5 factors). In the current study, the patients were stratified into different risk levels on the basis of these factors. Data collection was conducted by two trained orthopaedic investigators experienced in the use of the Caprini RAM. In particular, they calculated cumulative Caprini scores on the basis of DVT risk factors. In cases of discrepancies, final scores were determined through consultation with two orthopaedic experts.
VTE Diagnosis and Management
Preoperative ultrasonography is typically performed within three days of admission to diagnose DVT in elderly hip fracture patients. The assessment included proximal DVT (affecting the popliteal and femoral veins, such as the popliteal, common femoral, and superficial femoral veins), distal DVT (involving the deep veins of the calf, including the posterior tibial, peroneal, and intramuscular calf veins), and mixed DVT.
Regardless of preoperative DVT status, the sudden onset of clinical signs such as increased heart rate and decreased oxygen saturation should lead to a strong suspicion of PE. In such cases, CT pulmonary angiography should be promptly performed to confirm the diagnosis of symptomatic PE.
For patients with confirmed VTE, therapeutic-dose low-molecular-weight heparin was administered unless contraindicated, and prospective surveillance for bleeding-related adverse events (including clinical signs of bleeding) was conducted. Routine laboratory monitoring (eg, haemoglobin, platelet count, and coagulation indices) was performed, and preoperative repeat lower-extremity ultrasonography was conducted in patients with proximal DVT to reassess the thrombus extent and propagation and to inform perioperative management. Surgical plans were adjusted as needed on the basis of individualized risk assessment.
Statistical Analysis
Continuous variables are presented as the mean ± standard deviation or median and interquartile range, depending on the distribution of the data. Categorical variables are reported as frequencies and percentages. Group comparisons of continuous variables were performed with the t-test or Mann-Whitney U test, as appropriate. The chi-square test was used for comparisons of categorical variables between groups.
Univariate logistic regression was performed to analyse the associations between Caprini risk level, injury-to-admission time category, and VTE risk. Multivariate logistic regression models were constructed to predict VTE risk, incorporating the Caprini score, Caprini risk level, D-dimer level, and injury-to-admission time. The optimal model was selected on the basis of the area under the receiver operating characteristic curve (AUC), sensitivity, specificity, positive predictive value (PPV), and negative predictive value (NPV). Model performance was further assessed using the integrated discrimination improvement (IDI) and net reclassification improvement (NRI).
The optimal cut-off for D-dimer levels was determined using the Youden index (J = sensitivity + specificity − 1). For each candidate threshold value, the sensitivity and specificity were calculated, and the cut-off yielding the maximum J value was selected as the optimal value, representing the best balance between true positives and true negatives. To further explore diagnostic performance, the threshold was decreased stepwise: first to achieve a sensitivity >90% while maintaining an NPV >90%, and second to enforce 100% sensitivity in order to assess the impact of D-dimer level on VTE prediction.
This framework was applied separately according to injury-to-admission time. For patients with an injury-to-admission time of ≤1 day, all three steps were used. For those with an injury-to-admission time of >1 day, the same criteria were applied, but the second criterion was replaced with a modified sensitivity strategy. This adapted approach was further used to determine the D-dimer thresholds across three Caprini risk levels. Specifically, for a Caprini score ≤9, the threshold was set to ensure a sensitivity >90% and an NPV >90%. For scores of 10–11, the sensitivity was increased to >95% while maintaining an NPV >90%. For scores ≥12, a stricter threshold requiring 100% sensitivity was applied. The overall sensitivity of the D-dimer threshold across the three Caprini risk levels was 95.8%, which aligns with the sensitivity of predictive models that combine the Caprini and D-dimer values.
All the statistical analyses were performed using SPSS 24.0, SAS 9.4, and the PredictABEL package in R 4.2.0. Two-sided tests were applied, and p < .05 indicated statistical significance.
Results
Enrolment Process and Baseline Characteristics
The study included 1114 elderly patients with hip fractures after all the exclusion criteria were applied (Figure 1). The mean age was 78.75 ± 8.76 years (range: 60-101 years), and 767 patients (68.9%) were female. Fracture types were classified as femoral neck fractures (697 patients, 62.6%), intertrochanteric fractures (406 patients, 36.4%), and subtrochanteric fractures (11 patients, 1.0%). The median time from injury to admission was 2.00 days (interquartile range [IQR]: 1.00-6.00 days). The mean Caprini score was 9.85 ± 1.37 (range: 7-18), and the median D-dimer level was 4.07 µg/mL (IQR: 2.07-10.76 µg/mL).

Flowchart of Included Studies and Exclusion Criteria.
The preoperative VTE rate in elderly patients with hip fractures was 21.0% (234/1114), including 224 cases of DVT, 2 cases of PE, and 8 cases of both PE and DVT. Compared with that in the non-VTE group, the injury-to-admission time was longer in the VTE group (median: 3.00 vs 2.00 days), the Caprini scores were higher (10.31 ± 1.62 vs 9.73 ± 1.27), the D-dimer levels were higher (median: 4.45 vs 4.00 µg/mL), and the APTT values were lower (median: 27.85 vs 28.40 s) (all p < .05) (Table 1).
Differences in Study Population Characteristics Between VTE and non-VTE Groups.

Abbreviations: VTE, venous thromboembolism; BMI, body mass index; Fbg, fibrinogen; INR, international normalized ratio; APTT, activated partial thromboplastin time.
Revised Caprini Risk Levels and VTE Location
Univariate logistic regression was used to reclassify the Caprini risk levels (Table 2). With a Caprini score of 9 as the threshold, patients with scores >9 had a significantly greater risk of VTE than those with scores ≤9 did (odds ratio [OR]: 2.223; 95% confidence interval [CI]: 1.630-3.033; p < .001).
Univariate Logistic Regression Analysis of Caprini Risk Levels (n = 1114).

Abbreviations: VTE, venous thromboembolism; OR, odds ratio; CI, confidence interval
NRI (continuous) = 0.207 (95% CI: 0.104-0.310; p < .001); IDI = 0.011 (95% CI: 0.004-0.018, p = .003)
When the patients were stratified into three risk groups, the incidence of VTE increased with increasing Caprini score: 14.0% for scores ≤9, 24.0% for scores 10–11, and 39.4% for scores ≥12. Patients with scores of 10–11 had a significantly greater VTE risk than did those with scores ≤9 (OR: 1.939; 95% CI: 1.401-2.683; p < .001), whereas those with scores ≥12 had the highest risk (OR: 3.999; 95% CI: 2.503-6.388; p < .001). Furthermore, the three-level Caprini classification demonstrated better predictive accuracy than did the two-level model (NRI = 0.207; 95% CI: 0.104-0.310; p < .001; IDI = 0.011; 95% CI: 0.004-0.018; p = .003).
As shown in Figure 2, most patients had Caprini scores ≤9 (493 patients, 44.3%) or 10–11 (517 patients, 46.4%), with fewer scoring ≥12 (104 patients, 9.3%). However, the ≥12 group had the highest incidence of VTE (39.4%). Similarly, the incidence of both proximal and distal DVT increased with increasing Caprini scores.
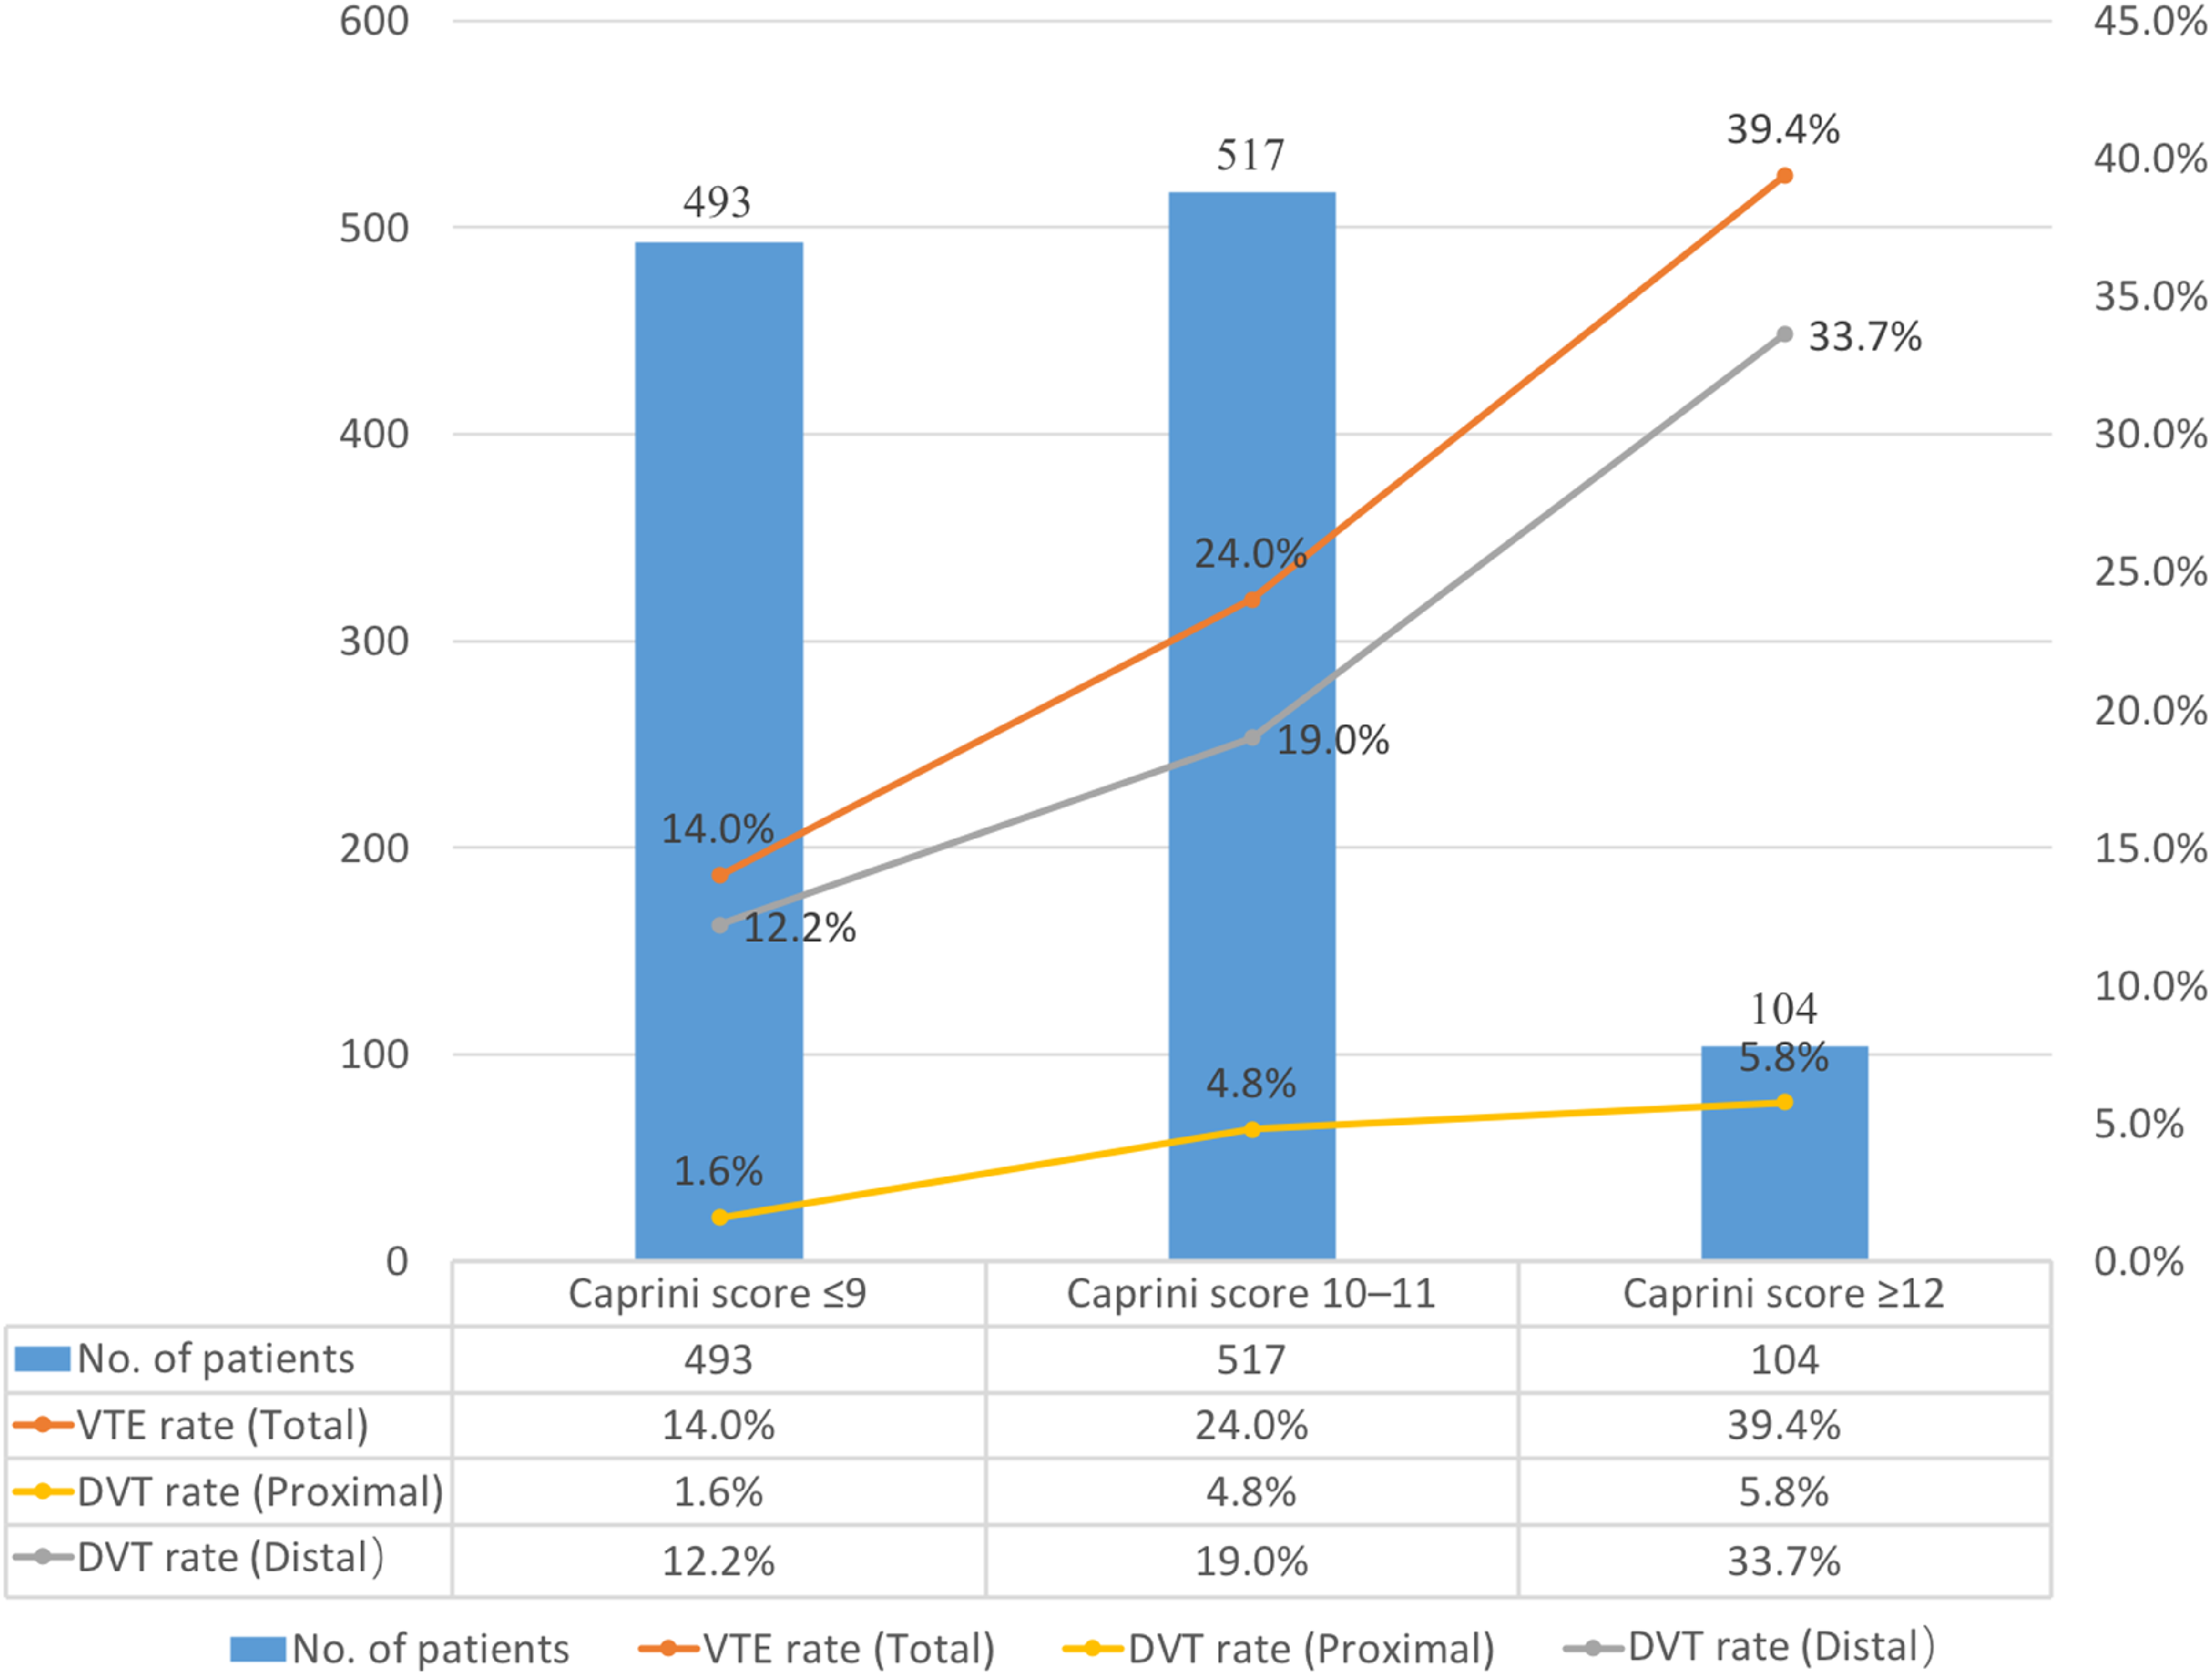
Comparisons of Patient Distribution and VTE Rates Across Caprini Risk Levels.
The distribution of VTE across the three Caprini risk levels is presented in Table 3. Patients with scores of 10–11 constituted most VTE cases (124 cases, 53.0%), followed by those with scores of ≤9 (69 cases, 29.5%) and those with scores of ≥12 (41 cases, 17.5%). Among the VTE patients, distal DVT was the most common form of VTE (193 patients, 82.5%), followed by proximal DVT (39 patients, 16.7%), and PE was the least common form (10 patients, 4.3%). Among the 10 PE cases, 8 were accompanied by DVT (3 with proximal DVT, 5 with distal DVT), whereas concomitant DVT was not present in 2 cases.
Locations and Number of VTE.
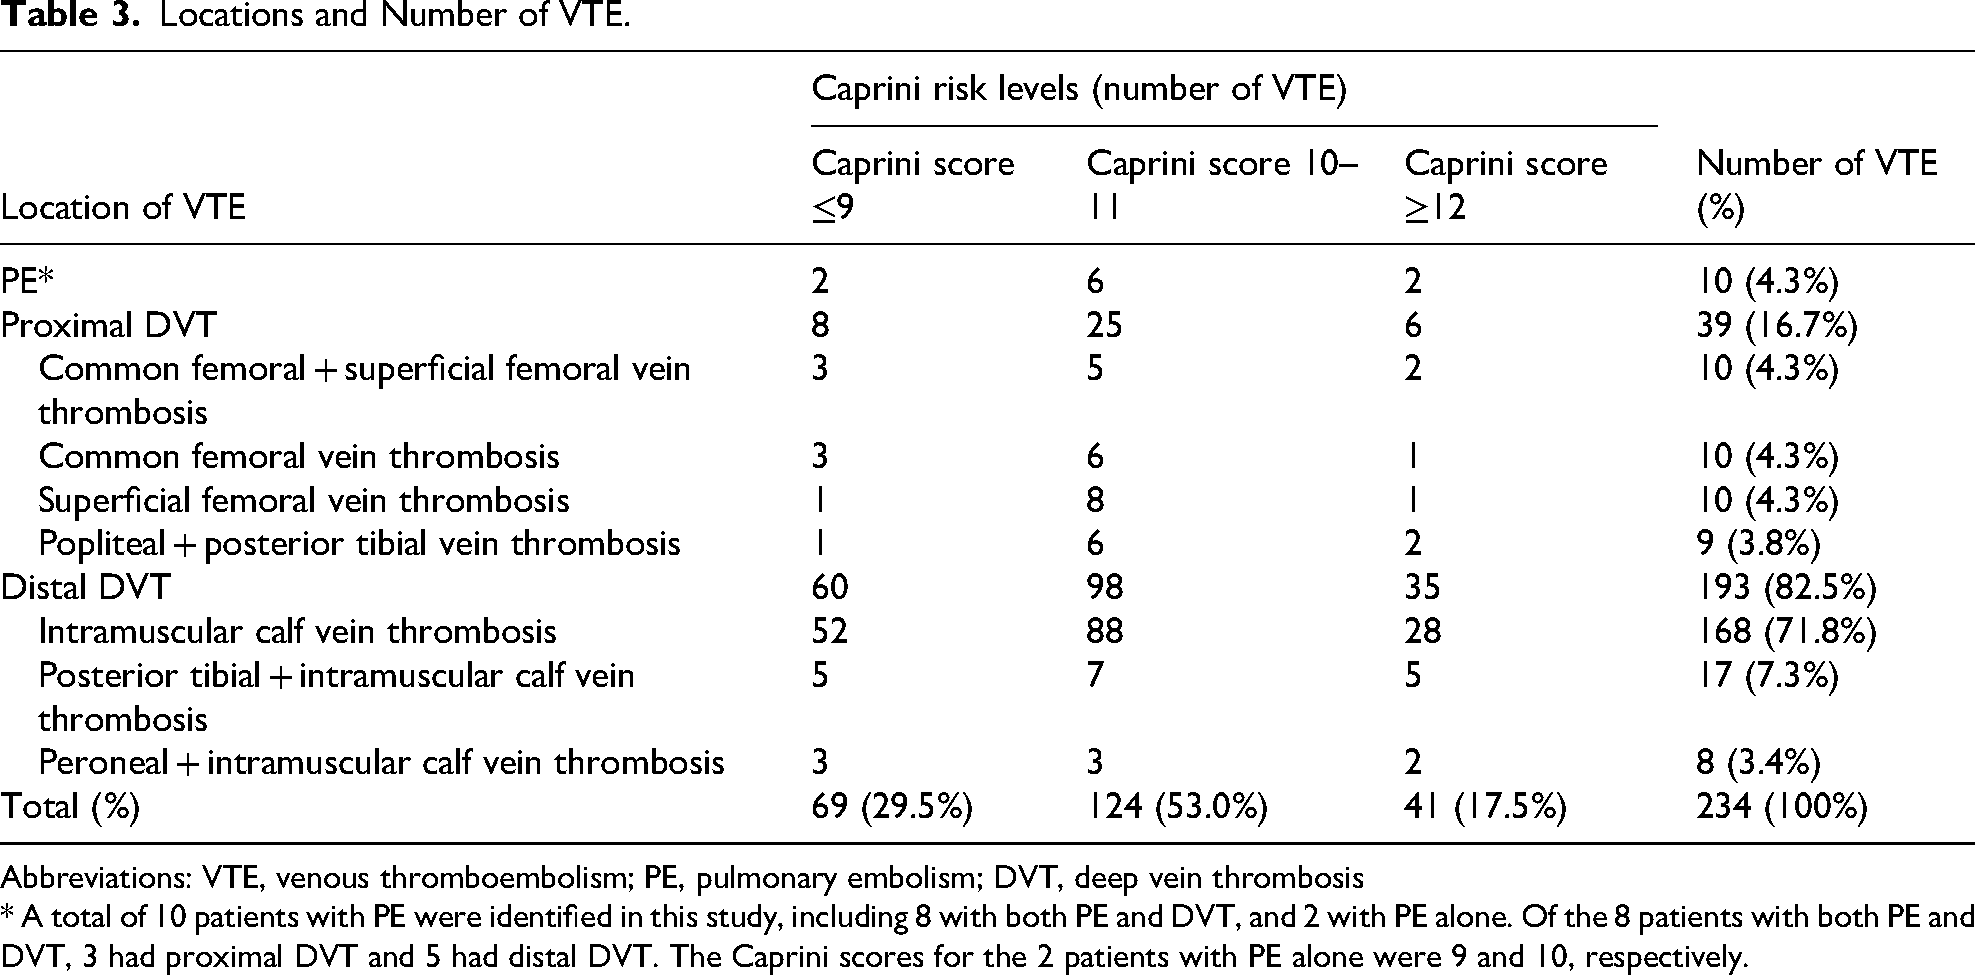
Abbreviations: VTE, venous thromboembolism; PE, pulmonary embolism; DVT, deep vein thrombosis
* A total of 10 patients with PE were identified in this study, including 8 with both PE and DVT, and 2 with PE alone. Of the 8 patients with both PE and DVT, 3 had proximal DVT and 5 had distal DVT. The Caprini scores for the 2 patients with PE alone were 9 and 10, respectively.
Discriminatory Power of Univariate variable Prediction
The Youden index calculation revealed that the performance of both the Caprini score and Caprini risk level was consistent in predicting the preoperative VTE risk, with AUCs of 0.606 and 0.614, respectively. Additionally, the sensitivity (70.5%), specificity (48.2%), PPV (26.6%), and NPV (86%) of both methods were stable. In comparison, D-dimer alone had an AUC of 0.552, with a sensitivity, specificity, PPV, and NPV of 85.9%, 31.9%, 25.1%, and 89.5%, respectively (Table 4).
Sensitivity, Specificity, PPV, NPV, and AUC of Univariate Prediction (n = 1114).

Abbreviations: AUC, area under the curve; PPV, positive predictive value; NPV, negative predictive value.
VTE Risk on the Basis of Injury-to-Admission Time
The study population was stratified into two groups on the basis of an injury-to-admission time threshold of 1 day. The VTE incidence was 13.4% among patients admitted within ≤1 day after injury, whereas 27.0% of those admitted after >1 day developed VTE. Patients with a longer injury-to-admission time had a significantly greater risk of VTE (OR = 2.388; 95% CI: 1.745-3.269; p < .001) (Table 5).
Univariate Logistic Regression Analysis of Time from Injury to Admission (n = 1114).

Abbreviations: VTE, venous thromboembolism; OR, odds ratio; CI, confidence interval.
D-Dimer Levels in VTE Patients and non-VTE Patients
The D-dimer levels of VTE patients and non-VTE patients were compared across different injury-to-admission time categories (Table 6). For patients admitted within ≤1 day of injury, no significant difference in D-dimer levels was observed between VTE patients and non-VTE patients (median: 9.60 vs 9.00 µg/mL, p = .932). Furthermore, in the evaluation of the predictive value of D-dimer for VTE across different admission time groups (Table 1S, Supplementary Appendix), no significant difference in D-dimer levels was found between VTE patients and non-VTE patients on days 1 and 2 of admission (both p > .05). However, starting from day 3 onwards, D-dimer levels were significantly higher in VTE patients than in non-VTE patients (median: 3.42 vs 2.27 µg/mL, p = .012).
Comparison of D-Dimer Levels Between VTE and non-VTE Groups for ≤1 day and >1 day from Injury to Admission.

Abbreviations: VTE, venous thromboembolism; IQR, interquartile range
Among patients admitted >1 day after injury, D-dimer levels were significantly higher in VTE patients than in non-VTE patients (median: 3.92 vs 2.44 µg/mL, p < .001) (Table 6). Further comparisons of the predictive value of D-dimer across different admission time groups are presented in Table 2S (Supplementary Appendix); the D-dimer levels were significantly higher in VTE patients than in non-VTE patients on admission day 1, day 2, and day 3 onwards (all p < .001).
Predictive Performance of the Caprini Model Combined with Injury-to-Admission Time in Patients Admitted Within one day
The predictive effectiveness of the Caprini model alone versus the Caprini model combined with the injury-to-admission time was evaluated using the Youden index (Table 7). When used alone, the Caprini score and Caprini risk level predicted VTE risk, with AUCs of 0.614 and 0.602, respectively, for continuous variables and 0.590 for binary variables. Incorporating injury-to-admission time into the model increased the AUCs to 0.649 and 0.641 for continuous variables and to 0.626 and 0.611 for binary variables. However, these improvements were not significant (all p > .05).
Comparison of Caprini Score, Risk Levels and Their Combination with Injury-to-Admission Time (≤1 day) for Predicting VTE Risk (Using the Youden Index, n = 492).

Abbreviations: AUC, area under the curve; PPV, positive predictive value; NPV, negative predictive value.
a1 versus a3: NRI (continuous) = 0.275 (95% CI: 0.023-0.528; p = .033); IDI = 0.004 (95% CI: −0.005-0.013; p = .394).
a2 versus a4: NRI (continuous) = 0.254 (95% CI: 0.000-0.509; p = .050); IDI = 0.005 (95% CI: −0.005-0.016; p = .317).
a3 versus a4: NRI (continuous) = 0.171 (95% CI: −0.088-0.43; p = 0.195); IDI = 0.010 (95% CI: −0.001-0.022; p = .080).
a1 and a2: Both models failed to identify 32 patients with VTE, including 5 with proximal DVT, 27 with distal DVT (1 of whom had concomitant PE). a3: The model failed to identify 13 patients with VTE, including 2 with proximal DVT, 11 with distal DVT, and none with PE. a4: The model failed to identify 10 patients with VTE, including 1 with proximal DVT, 9 with distal DVT, and none with PE.
Although the AUC did not increase significantly in the combined models, a reduction in misclassification rates was evident (Table 7). The Caprini risk level + injury-to-admission time model misclassified 10 VTE cases, whereas the Caprini score + injury-to-admission time model misclassified 13 VTE cases. However, PE cases were not misclassified in either model. In contrast, the Caprini model alone misclassified 32 VTE cases, including one proximal DVT case associated with PE.
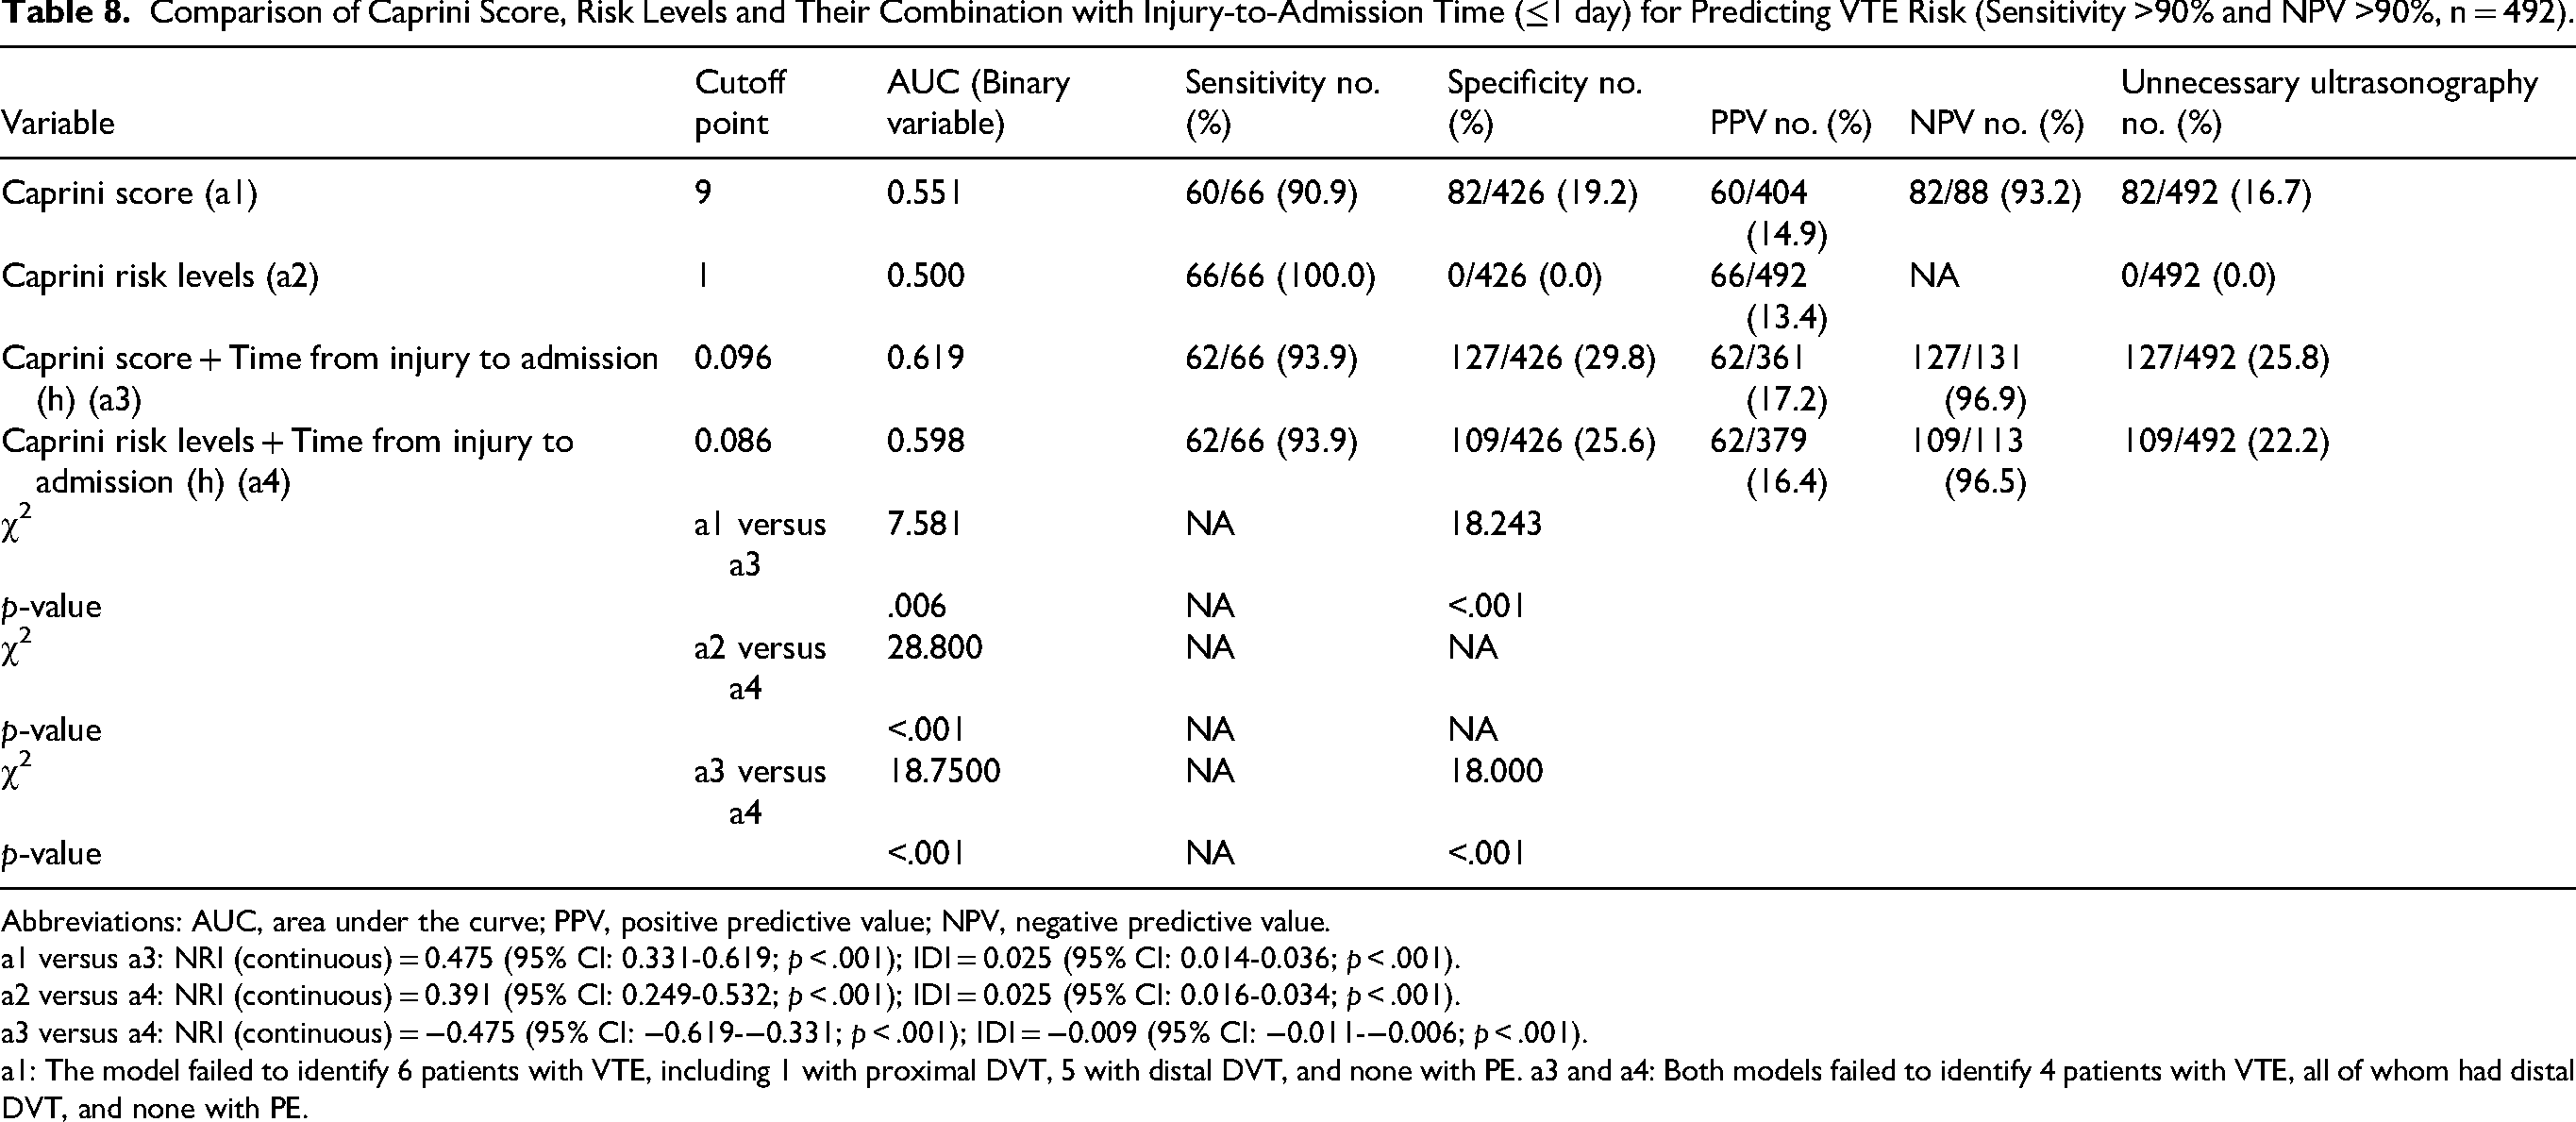
Next, we evaluated whether the combined prediction model outperformed the Caprini model alone while maintaining a sensitivity >90% and NPV >90% (Table 8). Our analysis showed that the predictive performance for VTE risk of both Caprini score + injury-to-admission time and the Caprini risk level + injury-to-admission time was superior to that of the Caprini score alone and Caprini risk level alone, with AUCs of 0.619 versus 0.551 (p = .006) and 0.598 versus 0.500 (p < .001), respectively.
Comparison of Caprini Score, Risk Levels and Their Combination with Injury-to-Admission Time (≤1 day) for Predicting VTE Risk (Sensitivity >90% and NPV >90%, n = 492).
Abbreviations: AUC, area under the curve; PPV, positive predictive value; NPV, negative predictive value.
a1 versus a3: NRI (continuous) = 0.475 (95% CI: 0.331-0.619; p < .001); IDI = 0.025 (95% CI: 0.014-0.036; p < .001).
a2 versus a4: NRI (continuous) = 0.391 (95% CI: 0.249-0.532; p < .001); IDI = 0.025 (95% CI: 0.016-0.034; p < .001).
a3 versus a4: NRI (continuous) = −0.475 (95% CI: −0.619-−0.331; p < .001); IDI = −0.009 (95% CI: −0.011-−0.006; p < .001).
a1: The model failed to identify 6 patients with VTE, including 1 with proximal DVT, 5 with distal DVT, and none with PE. a3 and a4: Both models failed to identify 4 patients with VTE, all of whom had distal DVT, and none with PE.
Both combined models misdiagnosed four VTE patients, yielding a sensitivity of 93.9%. With this sensitivity value, the diagnostic performance of the Caprini score + injury-to-admission time (cut-off = 0.096) was better than that of the Caprini risk level + injury-to-admission time (cut-off = 0.086), with a greater AUC (0.619 vs 0.598, p < .001), greater specificity (29.8% vs 25.6%, p < .001), and a more efficient reduction of unnecessary venous ultrasound use (25.8% vs 22.2%).
However, as shown in Supplementary Table 3S, when the model sensitivity increased to 100%, the combined models no longer outperformed the Caprini model alone in terms of the AUC (both p > .05), nor did they significantly improve the NRI or IDI.
Combinations of D-Dimer Thresholds and Caprini Risk Levels for Predicting VTE Risk in Patients Admitted After one day
The comparison of the predictive effectiveness of the Caprini model alone, the Caprini model combined with D-dimer, and D-dimer thresholds integrated with three Caprini risk levels for VTE risk assessment in patients admitted after one day, as evaluated by the Youden index, is shown in Table 9. Both the Caprini score + D-dimer and the Caprini risk level + D-dimer outperformed their standalone counterparts.
Comparison of D-Dimer Thresholds Based on Caprini Risk Levels and Caprini Models Combined with D-Dimer in Predicting VTE Risk (Using the Youden Index, Injury-to-Admission Time >1 day, n = 622).

Abbreviations: AUC, area under the curve; PPV, positive predictive value; NPV, negative predictive value.
a1 versus a3: NRI (continuous) = 0.488 (95% CI: 0.315-0.661; p < .001); IDI = 0.056 (95% CI: 0.035-0.077; p < .001).
a2 versus a4: NRI (continuous) = 0.463 (95% CI: 0.289-0.636; p < .001); IDI = 0.059 (95% CI: 0.037-0.080; p < .001).
a3 versus a5: NRI (continuous) = 0.017 (95% CI: −0.079-0.113; p = .727); IDI = −0.001 (95% CI: −0.013-0.012; p = .915).
a4 versus a5: NRI (continuous) = −0.026 (95% CI: −0.122-0.070; p = .600); IDI = −0.002 (95% CI: −0.017-0.013; p = .797).
a1 and a2: Both models failed to identify 37 patients with VTE, including 3 with proximal DVT, 33 with distal DVT, and 1 with PE, in the absence of DVT. a3: The model failed to identify 33 patients with VTE, including 1 with proximal DVT, 32 with distal DVT, and none with PE. a4: The model failed to identify 38 patients with VTE, including 1 with proximal DVT, 37 with distal DVT, and none with PE. a5: The model failed to identify 44 patients with VTE, including one with proximal DVT and forty-three with distal DVT, one of whom had concomitant PE. Of these, 14 distal DVTs were not identified in the Caprini score ≤9 stratum, one proximal DVT and 12 distal DVTs in the Caprini score 10–11 stratum, and 17 distal DVTs in the Caprini score ≥12 stratum, with one case of DVT associated with concomitant PE.
With respect to the continuous variables, the combinations of the Caprini score + D-dimer (AUC: 0.681) and Caprini risk level + D-dimer (AUC: 0.684) significantly outperformed their respective standalone counterparts (AUC: 0.552 and 0.571, both p < .001). With respect to the binary variables, both combined models achieved comparable improvements in AUC. Additionally, the NRI and IDI were significantly increased (both p < .001) and reduced unnecessary venous ultrasound use (from 36.2% and 38.7% to 22.7%).
Among the combined models, the Caprini score + D-dimer model had the lowest misclassification rate, misclassifying only 33 VTE patients (1 proximal DVT, 32 distal DVT, 0 PE), whereas 38 patients were misdiagnosed by the Caprini risk levels + D-dimer model and 44 by the D-dimer thresholds combined with the three Caprini risk level model.
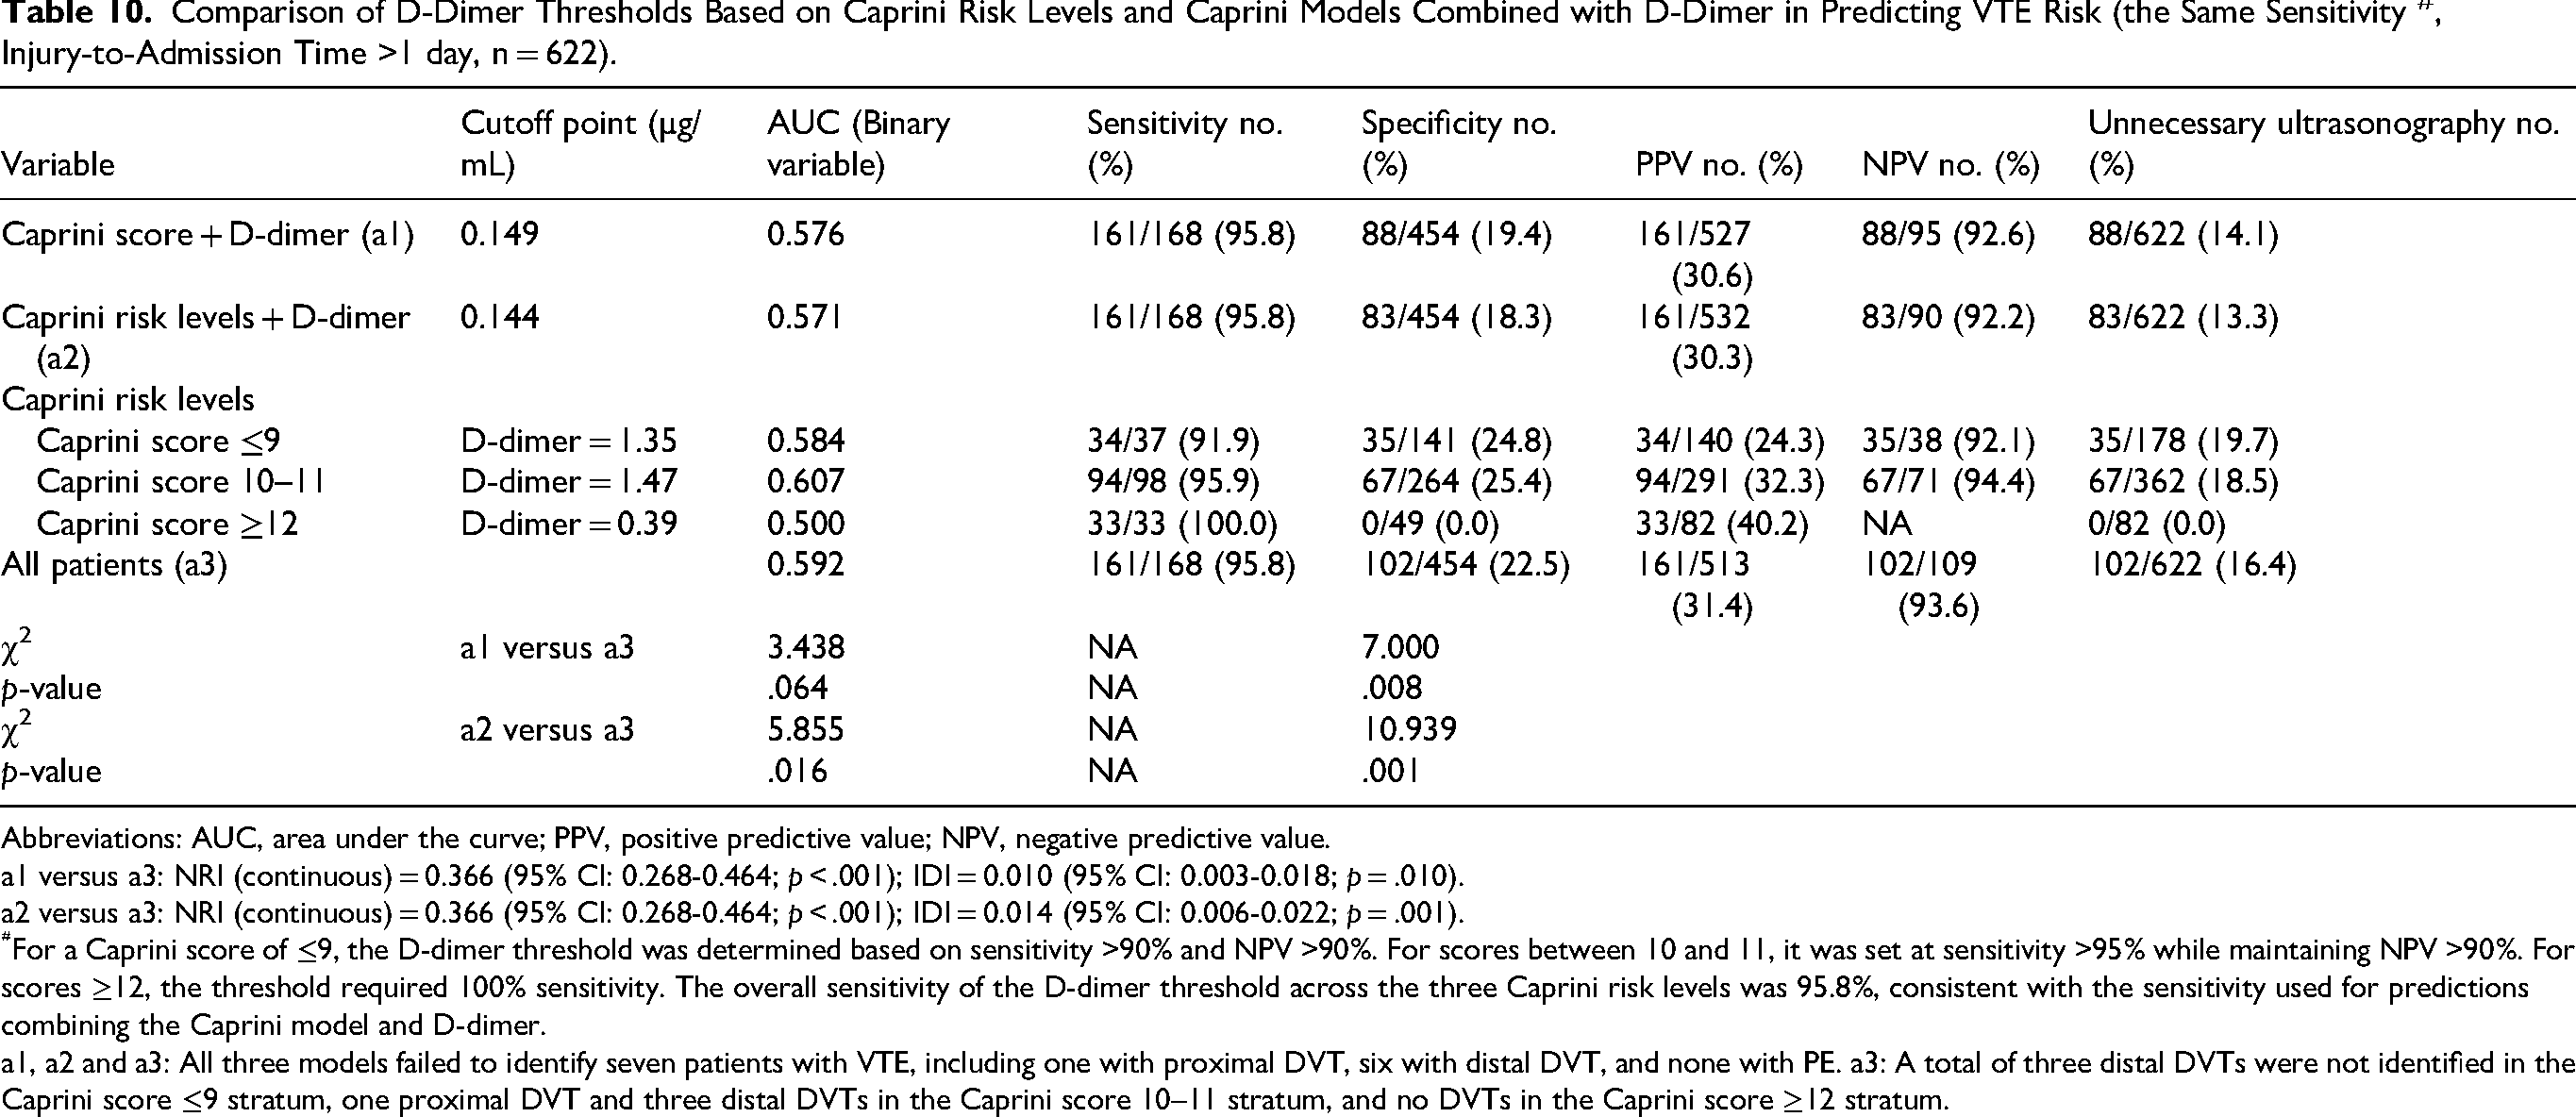
Using the Youden index, we determined the optimal D-dimer cut-off values for Caprini scores ≤9, 10–11, and ≥12, which were 3.17, 2.32, and 5.85 µg/mL, respectively. However, the overall AUC (0.651) did not significantly differ from that of the combined models (AUC: 0.650 and 0.652, both p > .05) (Table 9). To further evaluate D-dimer thresholds combined with three Caprini risk levels, we fixed the sensitivity at 95.8% (Table 10). The corresponding D-dimer cut-off values were 1.35, 1.47, and 0.39 µg/mL, respectively. This model achieved an AUC of 0.592, surpassing the Caprini risk level + D-dimer model (AUC: 0.571, p = .016) but performing like the Caprini score + D-dimer model (AUC: 0.576, p = .064). Additionally, it outperformed the combined models in terms of the NRI and IDI (both p < .05).
Comparison of D-Dimer Thresholds Based on Caprini Risk Levels and Caprini Models Combined with D-Dimer in Predicting VTE Risk (the Same Sensitivity #, Injury-to-Admission Time >1 day, n = 622).
Abbreviations: AUC, area under the curve; PPV, positive predictive value; NPV, negative predictive value.
a1 versus a3: NRI (continuous) = 0.366 (95% CI: 0.268-0.464; p < .001); IDI = 0.010 (95% CI: 0.003-0.018; p = .010).
a2 versus a3: NRI (continuous) = 0.366 (95% CI: 0.268-0.464; p < .001); IDI = 0.014 (95% CI: 0.006-0.022; p = .001).
For a Caprini score of ≤9, the D-dimer threshold was determined based on sensitivity >90% and NPV >90%. For scores between 10 and 11, it was set at sensitivity >95% while maintaining NPV >90%. For scores ≥12, the threshold required 100% sensitivity. The overall sensitivity of the D-dimer threshold across the three Caprini risk levels was 95.8%, consistent with the sensitivity used for predictions combining the Caprini model and D-dimer.
a1, a2 and a3: All three models failed to identify seven patients with VTE, including one with proximal DVT, six with distal DVT, and none with PE. a3: A total of three distal DVTs were not identified in the Caprini score ≤9 stratum, one proximal DVT and three distal DVTs in the Caprini score 10–11 stratum, and no DVTs in the Caprini score ≥12 stratum.
At 100% sensitivity (Supplementary Table 4S), the model using D-dimer thresholds determined by three Caprini risk levels achieved an AUC of 0.545, which was significantly greater than those of the Caprini risk level + D-dimer model (AUC: 0.531, p < .001) and the Caprini score + D-dimer model (AUC: 0.526, p < .001). Similar improvements in the NRI and IDI were observed (both p < .001).
Discussion
Using the data of our 10-year single-centre cohort of 1114 elderly hip fracture patients, we refined the VTE risk assessment by reclassifying the Caprini score into three risk levels and integrating the injury-to-admission time and D-dimer level to increase the predictive accuracy of the model. Our findings showed that the three-level Caprini classification enhanced preoperative VTE prediction in this population, outperforming the two-level model. While both the Caprini score and risk level had moderate predictive ability, D-dimer alone had limited value. However, among patients admitted more than one day after injury, D-dimer levels were significantly higher in VTE patients, regardless of whether they were admitted on day 1, day 2, or day 3 onwards. In contrast, no such difference was observed in those admitted within one day, with significance emerging only from day 3 onwards. In this subgroup, integrating injury-to-admission time improved the predictive performance of the Caprini score, particularly in models maintaining sensitivity and NPV >90%. Additionally, among patients admitted after one day, combining the Caprini score with D-dimer enhanced the VTE prediction. When sensitivity exceeded 95%, the D-dimer threshold across the three Caprini risk levels outperformed the combined models, with a significant advantage at 100% sensitivity.
In this study, we reclassified Caprini scores into three risk levels (≤9, 10-11, and ≥12), deviating from the original Caprini risk levels 10 (low risk: 0-1, moderate risk: 2, high risk: 3-4, highest risk: ≥ 5). Notably, Caprini risk stratification varies by disease type. For example, in arthroplasty patients, a score ≥10 is considered high risk, whereas a score ≤9 is classified as low risk. 27 Similarly, in previous studies, a score ≥9 was associated with a high risk for postoperative VTE. 17 For surgical patients in critical care, there are five risk levels: low risk (0-2), moderate risk (3-4), high risk (5-6), highest risk (7-8), and superhigh risk (>8). 14
Our findings demonstrate that the three-level Caprini classification provides greater precision than the two-level model does. The two-level classification, with a threshold of 9, stratifies patients into those with scores ≤9 (VTE incidence: 14.0%) and those with scores >9 (VTE incidence: 26.6%). However, the identification of high-risk patients was improved after scores >9 were further stratified into 10–11 (24.0%) and ≥12 (39.4%). This refined classification can improve the preoperative risk assessment, enabling targeted management and closer monitoring of patients with Caprini scores ≥12.
D-dimer, a stand-alone test with a threshold of 0.5 µg/mL, an NPV of 99.7% and a sensitivity of 99.4%, is widely used to exclude DVT in outpatients, thereby reducing the need for ultrasound examinations. 28 However, our study revealed that the efficacy of D-dimer alone in predicting VTE risk in elderly hip fracture patients was limited, with an AUC of only 0.552, NPV of 89.5%, and sensitivity of 85.9%. Trauma, including fractures, can increase D-dimer levels, 29 making it difficult to differentiate between D-dimer elevation due to trauma and that due to thrombosis. A meta-analysis of 26 studies involving 9823 patients with hip fractures (1627 with DVT and 8196 without DVT) revealed no significant associations between D-dimer levels and preoperative DVT risk (mean difference [MD] = −0.20, 95% CI: −0.97-0.58; p = .62). 30 Nevertheless, D-dimer remains the most widely used biomarker in preoperative DVT risk prediction models for hip fracture patients, 26 demonstrating some clinical predictive value. 31
To maximize the predictive utility of D-dimer, patients were stratified on the basis of injury-to-admission time. Our study highlights its strong predictive value in patients admitted after one day. Furthermore, this predictive value remained consistent across different admission days (day 1, day 2, and day 3 or later), emphasizing its robust predictive power. In contrast, in patients admitted within one day, the predictive value of D-dimer was not significant. However, further analysis revealed that D-dimer was predictive from the third day onwards and maintained its relevance at subsequent time points. These findings suggest that the injury-to-admission time may influence the accuracy of D-dimer in predicting VTE.
Several studies have underscored the role of D-dimer in improving VTE prediction accuracy in trauma patients. Owings et al reported that D-dimer levels were influenced in the early stages of major trauma, suggesting that testing after 2 days could reduce false-positive rates. 32 Similarly, Wahl et al reported that the NPV of D-dimer progressively reached 100% after four days of admission. 33 Niikura et al further reported that in patients with pelvic or multiple fractures, D-dimer testing at least seven days after injury improved VTE prediction accuracy. 34 These findings suggest that the impact of trauma on D-dimer levels varies depending on patient population and injury severity. To minimize trauma-related interference, D-dimer testing should be timed appropriately, particularly in elderly hip fracture patients. Specifically, for patients with an injury-to-admission time of ≤1 day, testing on or after the third admission day is recommended. In contrast, for those admitted after one day, testing on the first or second day is advised.
For patients with an injury-to-admission time of ≤1 day, D-dimer at admission did not reliably predict VTE risk, underscoring the need for alternative predictors. Xing et al identified injury-to-admission time as a risk factor for preoperative DVT in hip fracture patients. 35 A long injury-to-admission time, particularly beyond 48 h, is associated with an increased risk of DVT, regardless of surgical intervention or anticoagulation prophylaxis.36,37 On the basis of this finding, we investigated whether incorporating the injury-to-admission time into the Caprini model could enhance VTE risk prediction.
Our findings demonstrated that this combined approach improved the VTE risk prediction compared with the use of the Caprini score alone. Although the combined model did not show a clear advantage over the separate model based on the Youden index, its sensitivity was significantly improved (from 51.5% to 80.3%), and the number of misdiagnosed VTE cases decreased (from 32 to 13). Given these findings, we further assessed the performance of these combined models under stricter diagnostic criteria, particularly focusing on sensitivity and NPV thresholds.
Under these stricter criteria, namely, a sensitivity >90% and NPV >90%, the combined models, particularly the Caprini score + injury-to-admission time model, which demonstrated the best performance, outperformed the standalone models in terms of AUC. Therefore, when combined with the Caprini model, the injury-to-admission time can serve as a substitute for D-dimer in improving the VTE risk prediction for patients with an injury-to-admission time of ≤1 day.
In our study, we confirmed that integrating D-dimer levels with the Caprini model significantly enhanced VTE risk prediction in patients with an injury-to-admission time >1 day. Consistent findings have been reported in patients with knee osteoarthritis, 25 thoracolumbar fractures, 38 and lower extremity fractures, 39 further supporting the efficacy of this combined approach. Additionally, defining D-dimer thresholds for each Caprini risk level allows for sensitivity adjustments on the basis of VTE incidence across different risk groups.
For patients with a Caprini score ≥12 and a VTE incidence of 40.2%, maximizing sensitivity was essential to minimizing missed diagnoses. The Youden index method, achieving only 48.5% sensitivity in this group, resulting in 17 missed VTE cases, was less effective. Given the VTE incidence rates of 40.2%, 27.1%, and 20.8% for the Caprini score groups ≥12, 10–11, and ≤9, respectively, the sensitivity thresholds were set to 100%, > 95%, and >90% for each group. Under these conditions, the D-dimer threshold across the three Caprini risk level model, with a sensitivity >95%, outperformed the combined models in terms of VTE prediction accuracy, as indicated by the AUC, NRI, and IDI metrics.
Despite these improvements, one patient with proximal DVT was still misdiagnosed in the Caprini score 10–11 group. Ultrasound revealed wall thickening in the distal left superficial femoral vein, extending to the popliteal vein, with an old thrombus and recanalization. This patient, with a Caprini score of 10 and a fracture 14 days prior, had a D-dimer level of 0.79 µg/mL on admission. Lowering the D-dimer threshold from 1.47 µg/mL to 0.79 µg/mL could have excluded this VTE case, increasing the sensitivity from 95.9% to 100%, but at the cost of reduced specificity (from 25.4% to 9.5%). This resulted in a decrease in the overall AUC from 0.592 to 0.545. Future studies should explore additional biomarkers or indicators to improve the model's predictive accuracy when combined with D-dimer.
In addition, the applicability of the two methods—the Youden index and the combination of sensitivity >90% with NPV >90%—offer distinct advantages, depending on the injury-to-admission time. Our study revealed that compared with an injury-to-admission time of >1 day (27.0%), an injury-to-admission time of ≤1 day is associated with a significantly lower incidence of VTE (13.4%). This is consistent with Hecht et al's findings, which showed that the risk of VTE in trauma patients increased with longer hospital stays (24 to <48 h and ≥48 h), with the ORs ranging from 1.26 to 2.35 compared with stays of <24 h. 40 Moreover, in patients undergoing major orthopaedic surgery of the femur, pelvis, or hip, anticoagulation prophylaxis within 24 h of admission has been shown to reduce VTE risk. 41 These findings emphasize the importance of early admission and timely anticoagulation in reducing VTE risk, particularly for patients with an injury-to-admission time of ≤1 day.
In light of these findings, incorporating the Caprini score and injury-to-admission time model (using the Youden index method) can enhance the VTE risk assessment in emergency patients, particularly those with hip fractures. This approach may help maintain sensitivity above 80% while reducing unnecessary ultrasound examinations (by 38.8%), facilitating admission, and ensuring the timely initiation of anticoagulation prophylaxis, thereby potentially avoiding delays in ultrasound examination in the emergency department. Moreover, upon admission to the orthopaedic ward, a model-driven strategy ensuring sensitivity >90% and NPV >90% is recommended to identify high-risk patients. For patients who have not undergone venous ultrasonography in the emergency department, prioritizing their examination on the basis of triage criteria is essential.
In contrast, the incidence of VTE in elderly hip fracture patients is 27.0% when their injury-to-admission time exceeds one day. For those without DVT, anticoagulation prophylaxis is recommended, whereas full-dose anticoagulation is initiated upon DVT diagnosis. 42 In the acute phase of DVT, aggressive anticoagulation is crucial, as it prevents thrombotic progression and reduces the risk of recurrent VTE. 43 Preoperative venous ultrasound screening plays a key role in this context, enabling the detection of asymptomatic DVT and facilitating early preventive intervention.44,45 Therefore, early identification of VTE remains essential for effective management.
Additionally, we recommend integrating D-dimer thresholds with the three Caprini risk levels to predict VTE risk and prioritize venous ultrasound screening accordingly in both emergency and orthopaedic settings. To minimize missed VTE cases, preoperative venous ultrasound screening is advised for all patients with Caprini scores ≥12. For patients in the lower two Caprini risk levels, the sensitivity can be increased from 90% to 100% to improve the detection of high-risk individuals. In cases of discrepancies between venous ultrasonography and model predictions, D-dimer trends should be evaluated, and ultrasound screening should be repeated if necessary to confirm DVT.
Our study has several limitations. First, it was a retrospective, single-centre analysis, which may limit its external validity and generalizability. Although patients were drawn from diverse regions, selection bias cannot be excluded. Data were abstracted from medical records, and missing data were handled using complete-case analysis, which could have introduced bias if the missing data were not random. Several potential confounders—including anticoagulation regimens, pre-admission mobility, and inflammatory markers—were not consistently available and thus were not adjusted for; therefore, residual confounding remains possible. Future multicentre prospective studies with more complete data and confounder adjustment are warranted. Second, the refined Caprini model (Caprini score, Caprini risk level, D-dimer, and injury-to-admission time) was internally evaluated (AUC, sensitivity, specificity, PPV, NPV, IDI, NRI) but not externally validated. Therefore, its generalizability across settings is uncertain, and prospective multicentre validation is required before clinical implementation. Third, D-dimer sampling varied from day 1 to ≥ day 3, introducing timing-related heterogeneity and unequal group sizes that may attenuate discrimination and reduce its consistency as a predictive biomarker. Although our models were adjusted for prespecified covariates and stratified by injury-to-admission time, they were not directly adjusted for sampling time. Future validation with standardized early sampling and larger sample sizes is needed. Fourth, the influence of injury-to-admission time on VTE prediction was only partially addressed. Incorporating injury-to-admission time improved prediction in patients admitted within 1 day after injury, but additional biomarkers independent of fracture and admission timing are still needed. For patients admitted more than 1 day after injury, we assessed the Caprini model combined with the D-dimer level, but the direct effect of admission timing on model performance was not evaluated. Further research should clarify the clinical predictive value of admission time. Finally, the refined Caprini model was not compared with other RAMs (eg, Wells or Padua); future studies should perform direct comparisons to provide broader clinical context.
Our study has several strengths. First, as a real-world study with 10 years of continuous data collection from a single centre, consistency, continuity, and high data quality were ensured. Second, our study provides reliable results by detailing D-dimer trends across admission time points and reporting the number of DVT and non-DVT cases in each subgroup, thereby enhancing accuracy and reproducibility. Third, our findings offer valuable clinical guidance. By categorizing subgroups on the basis of the injury-to-admission time, the influence of this variable on the D-dimer prediction was minimized. The integration of the Caprini model with D-dimer and the injury-to-admission time clearly enhanced the VTE risk assessment. Additionally, in our study, prediction strategies tailored to different clinical settings, such as emergency and orthopaedic departments, were explored, facilitating high-risk patient identification and optimizing venous ultrasonography use.
Conclusion
Reclassifying the Caprini score into three risk levels may improve preoperative VTE prediction in elderly hip fracture patients compared with that of the traditional two-level model. In those admitted within 1 day after injury, D-dimer testing was best performed on or after the third admission day, and incorporating admission time into the Caprini model improved predictive accuracy. For patients admitted more than one day later, D-dimer testing on the first or second day was preferable, and stratified thresholds across risk levels maintained high sensitivity (>95%), showing favourable performance relative to other combinations. These findings, derived from a single-centre retrospective study, require confirmation in external multicentre cohorts before clinical application.
Supplemental Material
sj-docx-1-cat-10.1177_10760296251396133 - Supplemental material for Optimizing Preoperative Venous Thromboembolism Risk Assessment in Elderly Hip Fracture Patients: A Refined Caprini Model Integrating D-Dimer and Injury-to-Admission Time
Supplemental material, sj-docx-1-cat-10.1177_10760296251396133 for Optimizing Preoperative Venous Thromboembolism Risk Assessment in Elderly Hip Fracture Patients: A Refined Caprini Model Integrating D-Dimer and Injury-to-Admission Time by Yi-Feng Guo, Dingding Zhang, Aimin Guo, Bingdu Tong, Mei Champ, Na Gao, Baozhong Zhang, Jia Zhang, Peng Gao, Weinan Liu, Yaping Chen, Yin-Ping Zhang and Xiaopeng Huo in Clinical and Applied Thrombosis/Hemostasis
Footnotes
Ethics Considerations
Ethical approval to report this case was obtained from Institutional Review Board of the Peking Union Medical College Hospital (K3624).
Informed Consent
Informed consent was waived by the ethics committee because the study was retrospective and the data were anonymous.
Author Contributions
Yi-Feng Guo: Conceptualization, Methodology, Data curation, Formal analysis, Funding acquisition, Writing—original draft. Dingding Zhang, Aimin Guo: Methodology, Formal analysis, Writing—original draft. Bingdu Tong, Mei Champ, Na Gao: Data curation, Formal analysis. Baozhong Zhang, Jia Zhang, Peng Gao: Investigation, Resources. Weinan Liu: Visualization, Supervision. Yaping Chen, Yin-Ping Zhang, Xiaopeng Huo: Writing—review & editing, Project administration, Funding acquisition. All authors read and approved the final manuscript to be published.
Funding
The authors disclosed receipt of the following financial support for the research, authorship, and/or publication of this article: This work was supported by the National Natural Science Foundation of China (72204268), the National High Level Hospital Clinical Research Funding (2025-PUMCH-A-062), the Fundamental Research Funds for the Central Universities, Peking Union Medical College (3332022002), the Shaanxi Provincial Key Research and Development Program Fund (2015SF137), and the Xi’an Jiaotong University Fund.
Declaration of Conflicting Interests
The authors declared no potential conflicts of interest with respect to the research, authorship, and/or publication of this article.
Data Availability
Because of ethical and privacy restrictions regarding patient data, the datasets from this study are not available publicly. If needed, you can request the data from the corresponding author with a reasonable inquiry.
Supplemental Material
Supplemental material for this article is available online.
References
Supplementary Material
Please find the following supplemental material available below.
For Open Access articles published under a Creative Commons License, all supplemental material carries the same license as the article it is associated with.
For non-Open Access articles published, all supplemental material carries a non-exclusive license, and permission requests for re-use of supplemental material or any part of supplemental material shall be sent directly to the copyright owner as specified in the copyright notice associated with the article.