
Abstract
Introduction
Preoperative patients with knee osteoarthritis have a significantly increased risk of venous thromboembolism (VTE). While the Caprini risk assessment model offers some clinical guidance in predicting deep vein thrombosis (DVT), it has a relatively low predictive accuracy. Enhancing the model by integrating biomarkers, such as D-dimers, can potentially improve its accuracy. In this study, we explored the effectiveness of combining the Caprini risk model with D-dimer levels for individualized DVT risk assessment in patients with knee osteoarthritis.
Materials and Methods
This retrospective cohort study included 1605 knee osteoarthritis patients scheduled for total knee arthroplasty from Peking Union Medical College Hospital, screened between January 2015 and December 2018. A revised Caprini risk stratification model was developed, and a predictive DVT model was developed based on this revised system. The sensitivity, specificity, and the area under the curve (AUC) were used to determine predictive effectiveness of the model.
Results
In the revised Caprini risk stratification, the incidence of DVT increased with higher risk levels: 2.52% in the low-risk group (scores 0-2), 2.88% in the moderate-risk group (score 3), 6.47% in the high-risk group (score 4), and 9.09% in the highest-risk group (score ≥ 5). The incidence of DVT was 3.869-fold higher in the highest-risk group and 2.676-fold higher in the high-risk group compared to the low-risk group (p = 0.013 and p = 0.014, respectively). Combining the revised Caprini risk stratification with D-dimer level demonstrated an improved AUC of 0.792, compared to D-dimer level alone (AUC 0.774) and the revised Caprini model alone (AUC 0.598). Furthermore, applying specific D-dimer thresholds across the four Caprini risk stratifications outperformed the combination of the revised Caprini model and D-dimer level in terms of AUC, specificity, and reduction in unnecessary ultrasonography. Using the Youden index, the AUC for the threshold-based method was slightly higher (0.775 vs 0.754, p = 0.310), with significantly better specificity (76.8% vs 63.6%, p < 0.001) and a greater reduction in ultrasound use (74.1% vs 61.4%). At a sensitivity of 85.5%, the differences were modest but still favored the threshold-based approach. At a sensitivity of 100%, the specificity (36.0% vs 24.7%, p < 0.001) and ultrasound reduction (34.8% vs 23.9%) were significantly better.
Conclusion
The revised Caprini risk stratification improves preoperative DVT prediction in patients with knee osteoarthritis. Incorporating specific D-dimer thresholds into the four-level Caprini risk model enhances specificity and reduces unnecessary ultrasonography, outperforming both the use of individual indicators and the combination of the revised Caprini model with D-dimer level.
Keywords
Introduction
Venous thromboembolism (VTE), which includes both deep vein thrombosis (DVT) and pulmonary embolism, is a major contributor to hospital-associated morbidity and mortality.1,2 Worldwide, VTE affects an estimated 0.75–2.69 individuals per 1000 people annually, 3 and PE-related mortality rate ranges between 0 and 24 per 100 000 person-years, 2 underscoring its importance as a public health concern. The incidence of VTE is particularly increased among high-risk populations, such as patients undergoing arthroplasty. In knee arthroplasty patients without pharmacological prophylaxis, the postoperative incidence of DVT has been reported to be as high as 69.9%. 4 However, with appropriate anticoagulant prophylaxis, the rate of postoperative symptomatic DVT is significantly reduced, ranging from 0.63% to 1.52%.5,6 Similarly, the incidence of preoperative DVT in knee osteoarthritis patients ranges from 2.6% to 6.7%,4,7 highlighting the persistent risk in this population. However, early diagnosis of DVT and timely anticoagulation treatment could improve long-term outcomes in DVT patients. 8 Therefore, early detection of preoperative DVT in knee osteoarthritis patients is crucial and warrants significant attention.
Effective thrombosis risk assessment is essential for both preventing and managing DVT. The Caprini risk assessment model (RAM), validated in over 250 000 patients across more than 100 clinical trials worldwide, is a widely used tool for stratifying risk and guiding prophylaxis to prevent VTE. 9 However, its ability to accurately predict DVT in patients undergoing total joint arthroplasty (TJA) remains unclear.10–14 Some studies have noted that the Caprini RAM has limited utility in predicting DVT risk in TJA patients, suggesting that enhanced risk stratification or the inclusion of additional risk factors may improve its accuracy.13,14 Conversely, other studies have shown a strong association between the Caprini RAM and DVT risk in TJA patients, with higher scores correlating with an increased likelihood of developing DVT.10–12 These studies have redefined the original Caprini risk classification, proposing higher thresholds—such as scores ≥9 12 and ≥1010,11—to more accurately identify high-risk individuals. Therefore, further validation is needed to assess the effectiveness of the original Caprini risk stratification in predicting preoperative DVT risk in patients with knee osteoarthritis.
Biomarkers play a crucial role in predicting and diagnosing DVT, with D-dimer being the most commonly used. D-dimer, a fibrin degradation product, is an important indicator of DVT risk, as elevated levels reflect increased fibrinolytic activity and a potential thrombotic event. 15 Our previous study identified D-dimer levels as a risk factor for preoperative DVT in patients with knee osteoarthritis. 16 Due to its high sensitivity and negative predictive value, D-dimer is particularly effective in ruling out DVT risk, making it a valuable tool for initial screening. 17 Furthermore, combining D-dimer levels with risk prediction models, such as the Caprini RAM, can improve the accuracy of DVT prediction, particularly in patients with conditions such as thoracolumbar fractures and lung cancer.18,19 Moreover, integrating D-dimer levels with clinical pretest probability models, such as the Wells score, and stratifying the models into low, moderate, and high risk—while applying specific D-dimer thresholds—enhances diagnostic accuracy for DVT.20,21 These combined approaches can also improve preoperative DVT prediction in patients with knee osteoarthritis.
Despite its widespread use, limited research has explored the effectiveness of combining D-dimer levels with the Caprini RAM specifically for predicting preoperative DVT in knee osteoarthritis patients. Therefore, this study aimed to validate the effectiveness of the original Caprini risk stratification in this population and to develop an optimal approach by integrating D-dimer levels with the Caprini model to enhance predictive accuracy. We hypothesize that the revised Caprini risk stratification will offer more accurate DVT risk prediction in osteoarthritis patients, and that combining D-dimer thresholds with varying Caprini risk levels will improve predictive precision and guide the appropriate use of venous ultrasonography.
Patients and Methods
Patient Screening and Enrollment
This retrospective cohort study screened 1605 eligible patients out of 1951 at Peking Union Medical College Hospital from January 2015 to December 2018. The study included patients aged 18 or older who were diagnosed with knee osteoarthritis and scheduled for total knee arthroplasty (TKA). We excluded patients with other types of arthritis (eg, traumatic osteoarthritis, rheumatoid arthritis, hemophilic arthritis, or ankylosing spondylitis) (n = 182), absence of preoperative lower extremity ultrasonography (n = 85), non-primary TKA (n = 58), and incomplete medical records (n = 21). This study was conducted in accordance with the principles of the 1964 Declaration of Helsinki. The ethics committee of Peking Union Medical College Hospital approved the study protocol (IRB number: K3692), and the requirement for informed consent was waived due to the retrospective nature of the research.
Identification of Preoperative DVT
All patients underwent preoperative ultrasonography of the deep veins in the lower extremities. The scans were performed by two professionally trained ultrasound physicians to ensure accurate identification of DVT. Lower extremity DVT was classified into proximal vein thrombosis (involving the common femoral, femoral, and popliteal veins) and distal vein thrombosis (involving the posterior tibial, anterior tibial, peroneal, and intermuscular calf veins). Preoperative DVT is typically asymptomatic, often referred to as occult DVT, with most patients showing no obvious clinical signs, such as calf swelling or pain. A positive outcome was defined as the presence of DVT in either the affected or contralateral limb, including both proximal and distal thrombosis.
DVT Risk Assessment
This study employed the 2005 Caprini RAM 22 to evaluate preoperative DVT risk in the included patients. The Caprini model has been extensively validated in both national and international populations.23–25 It comprises 40 risk factors, each assigned a value between 1 and 5 points. The total Caprini score is the sum of the individual risk factor scores, which categorizes the patient's risk level as follows: low risk (0-1 points), moderate risk (2 points), high risk (3-4 points), and highest risk (≥ 5 points). Preventive measures are implemented based on the patient's specific risk category. For low-risk patients, early ambulation is recommended. For intermediate-risk patients, undertaking either physical or pharmacological preventive measures is advised. In high-risk cases, undertaking pharmacological preventive measures, physical preventive measures, or a combination of both is suggested. For the highest-risk patients, both pharmacologic and physical prevention measures are required.
Data Collection
Patients’ preoperative clinical data were obtained from the hospital's information system, including age, sex, body mass index, length of hospitalization, smoking status, alcohol consumption, laboratory results, and medical history. Laboratory data included coagulation parameters such as D-dimers (measured using an immunoturbidimetric assay), fibrinogen, international normalized ratio, and activated partial thromboplastin time. Medical history encompassed conditions such as inflammatory bowel disease, varicose veins, pneumonia, chronic obstructive pulmonary disease, acute myocardial infarction, previous VTE, past or current malignancy, stroke, and others. The Caprini score was independently calculated by two orthopedic nurses based on the patient's medical history. In cases of scoring discrepancies, a senior clinician determined the final score.
Statistical Analysis
In this study, continuous variables are presented as mean ± standard deviation or median and interquartile range, depending on the distribution type. Categorical variables are presented as frequency and percentage. Group comparisons for continuous variables were conducted using either the t-test or the Mann-Whitney U test, based on the variable distribution. For categorical variables, the Chi-square test was applied.
Logistic regression was used to develop a predictive model for DVT based on the Caprini score, Caprini risk stratification, and D-dimer levels. Model selection was performed by comparing the AUC, sensitivity, and specificity of different models. Additionally, net reclassification improvement (NRI) and integrated discrimination improvement (IDI) were used to compare the predictive capabilities of the models. NRI evaluates the contribution of a new variable to a risk prediction model by comparing changes in individual risk classifications between the new and old models, using risk categories to quantify the reclassification improvement of the new model relative to the old one. 26 IDI measures how much a new model improves in distinguishing between events and non-events compared with an old model, by calculating the average difference in predicted probabilities for the two groups. 27
Specific D-dimer thresholds were determined for each of the four Caprini risk stratification groups using the following methods: (1) the Youden index method, a key metric for evaluating the accuracy of diagnostic tests in medicine, which helps identify the optimal threshold for distinguishing between diseased and non-diseased states 28 ; (2) setting a D-dimer threshold of 0.50 µg/mL for the low- and moderate-risk groups, using sensitivity > 90% and a negative predictive value > 98% to determine the D-dimer threshold for the high-risk group, and using a sensitivity of 100% to establish the combined D-dimer + age index for the highest-risk group. Across all risk stratifications, a sensitivity of 85.5% was achieved, with eight DVT patients (14.5%, 8/55) missed. Based on this sensitivity, the threshold for the combined indicator of revised Caprini + D-dimer level was established; (3) using 100% sensitivity to determine the D-dimer thresholds for the low-, moderate-, and high-risk groups, and using 100% sensitivity to determine the combined D-dimer level + age threshold for the highest-risk group. With a sensitivity of 100%, the threshold for the combined indicator of revised Caprini + D-dimer level was set.
Statistical analyses were conducted using SAS 9.4 and the PredictABEL package in R 4.2.0. All tests were two-sided, and a p-value < 0.05 was considered statistically significant.
Results
Demographic Characteristics and Original Caprini Risk Stratification
Among the 1605 patients with knee osteoarthritis included in the study, 55 were diagnosed with DVT, yielding an overall prevalence of 3.4%. The mean patient age was 67.45 ± 7.12 years, with an age range of 43 to 91 years. The cohort consisted of 1343 females and 262 males. The mean age of the DVT group (70.38 ± 7.57 years) was significantly higher than that of the non-DVT group (67.34 ± 7.08 years) (p = 0.001). Preoperative D-dimer levels were also significantly elevated in the DVT group (1.14 ± 1.18 µg/mL) compared to the non-DVT group (0.62 ± 1.14 µg/mL, p < 0.001). Additionally, the mean Caprini score was higher in the DVT group (3.24 ± 1.12) versus the non-DVT group (2.84 ± 0.86) (p = 0.006) (Table 1).
Study Population Characteristics and Caprini Risk Stratification Differences Between DVT and non-DVT Groups.

Abbreviations: BMI, body mass index; Fbg, fibrinogen; INR, international normalized ratio; APTT, activated partial thromboplastin time
However, there were no significant differences in the original Caprini risk stratification between the DVT and non-DVT groups (p = 0.153). According to the original stratification, 51 patients (3.2%) were classified as low risk (scores of 0-1), 465 patients (29.0%) as moderate risk (score of 2), 1034 patients (64.4%) as high risk (scores of 3-4), and 55 patients (3.4%) as the highest risk (score ≥ 5) (Table 1).
Revised Caprini Risk Stratification and DVT Location
Upon reclassification of the Caprini risk stratification, significant differences in population distribution between the DVT and non-DVT groups were observed (p = 0.016). The revised stratification categorized 516 patients (32.2%) as low risk (scores of 0-2), 833 patients (51.9%) as moderate risk (score of 3), 201 patients (12.5%) as high risk (score of 4), and 55 patients (3.4%) as the highest risk (score ≥5). Detailed results are provided in Table 1.
The comparison of predictive capabilities between the revised and original Caprini risk stratifications demonstrated an NRI of 0.319 (95% confidence interval [CI]: 0.065-0.574; p = 0.014) and an IDI of 0.004 (95% CI: 0.001-0.007; p = 0.026). As illustrated in Figure 1, the number of patients decreased as the Caprini score increased, while the incidence of DVT rose accordingly: 2.5% for the low-risk group, 2.9% for the moderate-risk group, 6.5% for the high-risk group, and 9.1% for the highest-risk group under the revised stratification.

Comparisons of patient distribution and DVT rates between original and revised Caprini risk stratification.
Table 2 presents the distribution of thrombus sites among DVT patients based on risk stratification. Of the 55 patients diagnosed with DVT, 50 (90.9%) developed distal DVT, with 49 (89.1%) primarily affecting the intermuscular calf veins. Five patients were diagnosed with proximal DVT, including two from the highest-risk group (40.0%), two from the moderate-risk group (8.3%), and one from the low-risk group (7.7%). Both patients with proximal DVT in the high-risk group had a history of VTE, accounting for 33.3% (2 of 6) of those with a VTE history.
Locations and Number of DVT.

Odds for DVT According to Caprini Risk Stratification
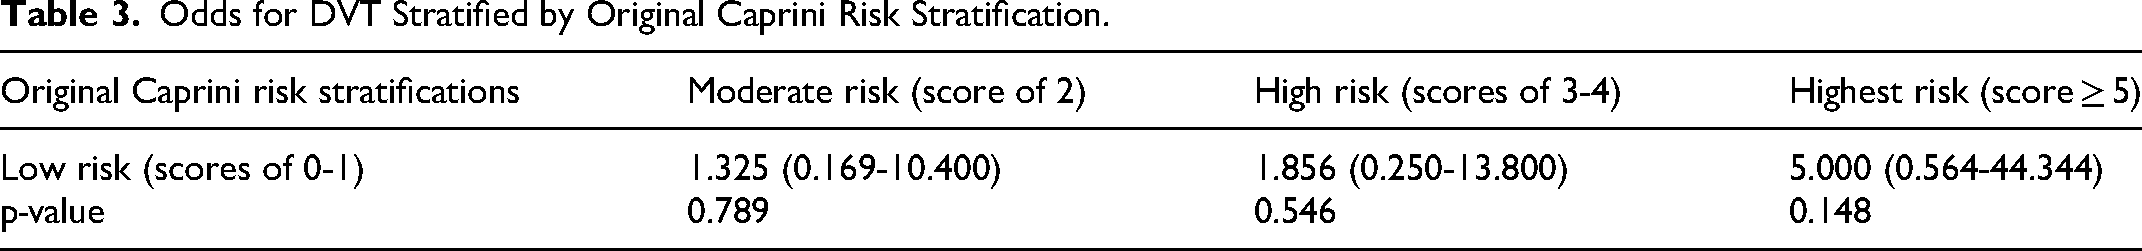
According to the original Caprini risk stratification, patients with moderate risk (score of 2), high risk (scores of 3-4), and the highest risk (score ≥ 5) were 1.325-, 1.856-, and 5.000-fold more likely to develop DVT, respectively, compared to patients with low risk (scores of 0-1). However, these differences were not statistically significant (all p-values > 0.05) (Table 3).
Odds for DVT Stratified by Original Caprini Risk Stratification.
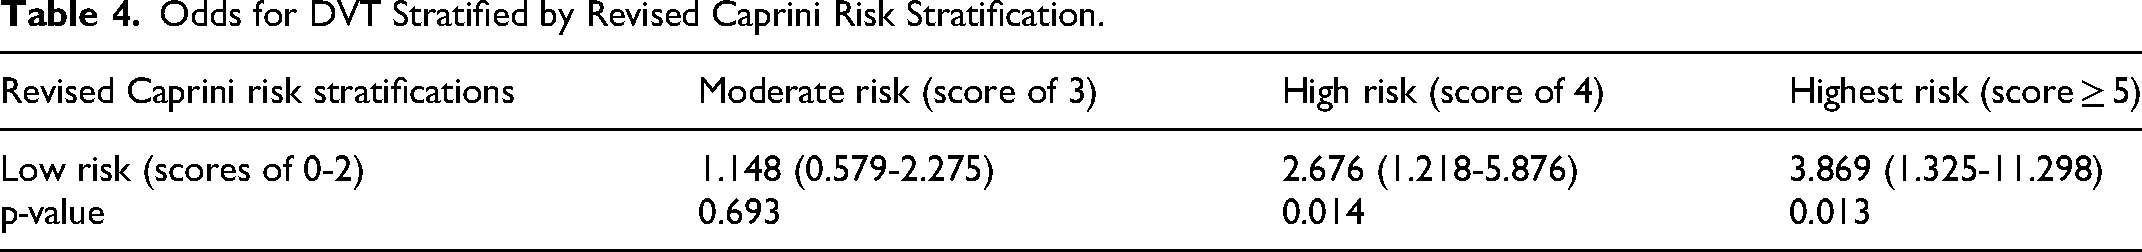
In contrast, when using the revised Caprini risk stratification, patients in the high-risk group (score of 4) had a significantly higher likelihood of developing DVT compared to those in the low-risk group (scores of 0-2) (odds ratio [OR], 2.676; 95% CI, 1.218-5.876; p = 0.014). This difference was even more pronounced for patients in the highest-risk group (score ≥ 5) compared to the low-risk group (OR, 3.869; 95% CI, 1.325-11.298; p = 0.013). However, no statistically significant differences in DVT development were observed between moderate-risk (score of 3) and low-risk groups (p > 0.05) (Table 4).
Odds for DVT Stratified by Revised Caprini Risk Stratification.
Discriminatory Power of Univariate and Joint variable Prediction
Table 5 illustrates the effectiveness of single variables—D-dimer, Caprini score, and both original and revised Caprini risk stratifications—in determining the DVT risk. D-dimer alone demonstrated the highest accuracy, with an AUC of 0.774, sensitivity of 69.1%, specificity of 76.1%, positive predictive value of 9.3%, and negative predictive value of 98.6%. The Caprini score and the revised Caprini risk stratification exhibited similar predictive capabilities for DVT risk, with AUCs of 0.599 and 0.598, respectively. In contrast, the original Caprini risk stratification performed the worst, achieving an AUC of only 0.563 (Table 5).
AUC, Sensitivity, Specificity, NPV, and PPV of Univariate Prediction.
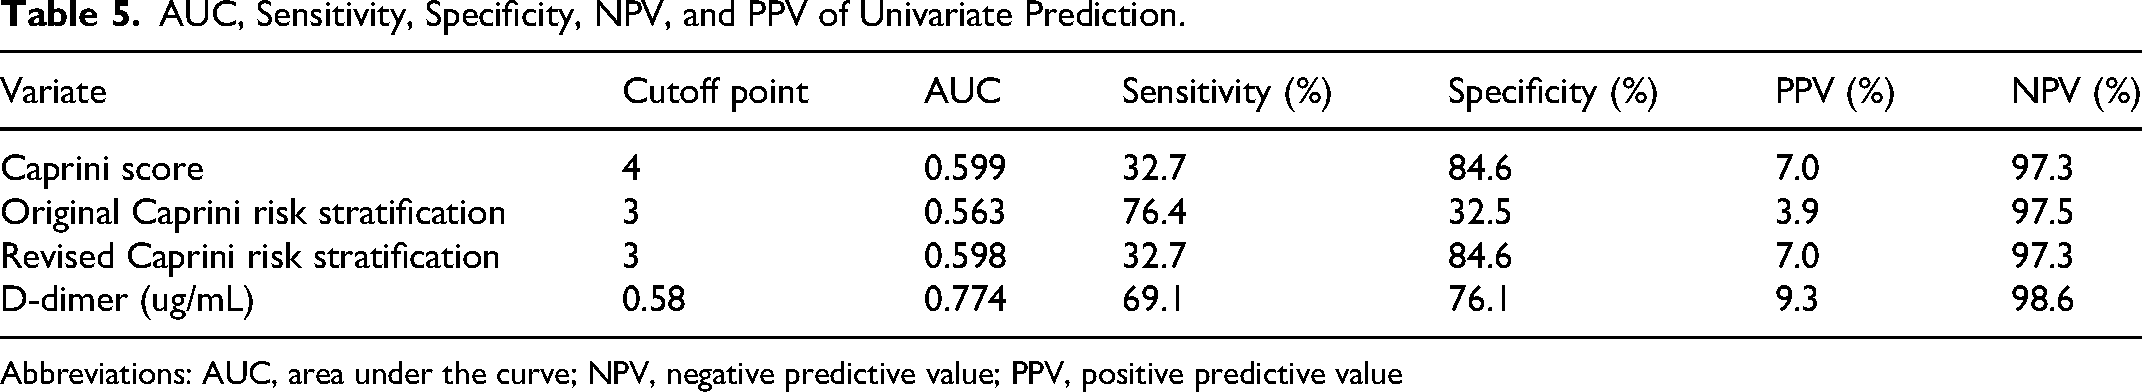
Abbreviations: AUC, area under the curve; NPV, negative predictive value; PPV, positive predictive value
Combining the Caprini score, original Caprini risk stratification, or revised Caprini risk stratification with D-dimer levels improved DVT risk prediction. Notably, the combination of the revised Caprini risk stratification and D-dimer level yielded superior predictive performance, with an AUC of 0.792, outperforming both the Caprini score combined with D-dimer level (AUC 0.788) and the original Caprini risk stratification combined with D-dimer level (AUC 0.782). However, including age in the combined models (Caprini score + D-dimer level, original Caprini risk stratification + D-dimer level, and revised Caprini risk stratification + D-dimer level) did not enhance DVT prediction, resulting in AUC values of 0.782, 0.779, and 0.790, respectively (Table 6).
AUC, Sensitivity, Specificity, NPV, and PPV of Joint variable Prediction.

Abbreviations: AUC, area under the curve; NPV, negative predictive value; PPV, positive predictive value
Combinations of D-Dimer cut-off Levels with Four Caprini Risk Stratifications and Revised Caprini Risk Stratification
Applying the Youden index methodology, we further analyzed the specific D-dimer threshold levels according to the four Caprini risk stratifications. The detailed results are presented in Table 7. For the low risk (scores of 0-2), moderate risk (score of 3), and high risk (score of 4) groups, the D-dimer thresholds were 0.58 µg/mL, 0.66 µg/mL, and 0.44 µg/mL, respectively, with corresponding AUCs of 0.792, 0.837, and 0.709. In these groups, higher D-dimer levels (≥ 0.58 µg/mL, ≥ 0.66 µg/mL, and ≥ 0.44 µg/mL, respectively), with an increased DVT risk. Conversely, in the highest risk group, the D-dimer threshold was 0.85 µg/mL, resulting in a lower AUC of only 0.580. In this group, a lower D-dimer level (≤ 0.85 µg/mL) indicated a higher DVT risk, contrary to the trend observed in the lower risk groups. The preoperative D-dimer levels for the five highest risk patients who developed DVT, in descending order, were 0.85, 0.66, 0.40, 0.32, and 0.15 µg/mL.
Comparison of D-Dimer Thresholds Based on Four Revised Caprini Risk Stratifications and Revised Caprini + D-Dimer to Predict DVT Ability (Using the Youden index).

Abbreviations: AUC, area under the curve; NPV, negative predictive value; PPV, positive predictive value
a1: overall AUC of combining four risk stratifications with D-dimer thresholds and D-dimer + age index (0.58 µg/mL, 0.66 µg/mL, 0.44 µg/mL, 0.083). a2: overall AUC of revised Caprini risk stratifications + D-dimer (cut-off point of 0.027). In a1, twelve patients with DVT were missed in diagnosis, distributed as follows: 4 in the low-risk group, 5 in the moderate-risk group, 2 in the high-risk group, and 1 in the highest-risk group; all had intermuscular calf venous thrombosis. In a2, seven patients with intermuscular calf venous thrombosis were missed diagnosis. NRI(Categorical) = 0.041 (95% CI: −0.037-0.119; p = 0.305); IDI = 0.017 (95% CI: 0.009-0.024; p < 0.001)
To enhance DVT prediction in the highest risk stratification, we utilized a combined prediction indicator of D-dimer + age (cut-off value of 0.083), resulting in an improved AUC of 0.678 (Table 7). Additionally, the overall AUC for all patients with specific D-dimer thresholds combined with the four Caprini risk stratifications was 0.775, slightly higher than the revised Caprini + D-dimer level (AUC of 0.754) (cut-off value: 0.027), although this difference was not statistically significant (p > 0.05). While the specific D-dimer thresholds combined with the four Caprini risk stratifications exhibited lower sensitivity than the revised Caprini + D-dimer level (78.2% vs 87.3%; p = 0.025), they demonstrated higher specificity (76.8% vs 63.6%; p < 0.001). Moreover, ultrasonography utilization was reduced by 61.4% with the revised Caprini + D-dimer level and by 74.1% with the specific D-dimer thresholds under the four Caprini risk stratifications (Table 7). Both methods missed cases of intermuscular calf venous thrombosis, including 12 (21.8%) DVT patients when using specific D-dimer thresholds combined with the four Caprini risk stratifications, and seven (12.7%) DVT patients when using the revised Caprini risk stratification combined with D-dimer level.
Furthermore, we compared the specific D-dimer thresholds applied to the four Caprini risk stratifications with the combined revised Caprini risk stratification + D-dimer level in predicting DVT performance, maintaining a consistent sensitivity of 85.5% (Table 8). The combination of specific D-dimer thresholds with the four Caprini risk stratifications yielded an overall AUC of 0.755, slightly higher than the revised Caprini + D-dimer AUC of 0.748 (cut-off value: 0.027), although the difference was not statistically significant (p > 0.05). With the same sensitivity, the specific D-dimer thresholds combined with the four Caprini risk stratifications showed slightly higher specificity compared to the revised Caprini + D-dimer level (65.6% vs 64.1%; p = 0.034). Additionally, this method slightly outperformed the latter in reducing unnecessary ultrasonography (63.4% vs 61.9%) (Table 8). Notably, eight (14.5%) patients with intermuscular calf venous thrombosis were missed in both methods.
Comparison of D-Dimer Thresholds Based on Four Revised Caprini Risk Stratifications and Revised Caprini + D-Dimer to Predict DVT Ability (D-Dimer Threshold of 0.50 µg/mL was Used for the low- and Moderate-Risk Groups; in the High-Risk Group, the Threshold was Determined Based on Sensitivity > 90% and NPV > 98%; for the Highest-Risk Group, a Combined index of D-Dimer and age was Used, with Sensitivity set at 100%).

Abbreviations: AUC, area under the curve; NPV, negative predictive value; PPV, positive predictive value
b1: overall AUC of combining four risk stratifications with D-dimer thresholds and D-dimer + age index (0.50 µg/mL, 0.50 µg/mL, 0.38 µg/mL, 0.051). b2: overall AUC of revised Caprini risk stratifications + D-dimer (cut-off point of 0.027). In a1, eight patients with DVT were missed in diagnosis, distributed as follows: 4 in the low-risk group, 3 in the moderate-risk group, and 1 in the high-risk group; all had intermuscular calf venous thrombosis. In a2, eight patients with intermuscular calf venous thrombosis were missed diagnosis.
NRI(Categorical) = 0.015 (95% CI: −0.037-0.067; p = 0.578); IDI = 0.003 (95% CI: −0.001-0.007; p = 0.161)
In addition, the D-dimer thresholds were redefined when we set the DVT prediction sensitivity to 100% across all risk stratifications. Consequently, the threshold for the combined indicator of revised Caprini + D-dimer level was established at 0.015 (Table 9). The overall AUC for specific D-dimer thresholds combined with the four Caprini risk stratifications was 0.680, significantly higher than the revised Caprini + D-dimer AUC of 0.624, with a statistically significant difference (p < 0.001). At a sensitivity of 100%, the specific D-dimer thresholds combined with the four Caprini risk stratifications demonstrated a modest increase in specificity compared to the revised Caprini + D-dimer (36.0% vs 24.7%; p < 0.001). Additionally, this method slightly reduced unnecessary ultrasonography more effectively than the revised Caprini + D-dimer approach (34.8% vs 23.9%).
Comparison of D-Dimer Thresholds Based on Four Revised Caprini Risk Stratifications and Revised Caprini + D-Dimer to Predict DVT Ability (D-Dimer Threshold Levels Were Determined with a Sensitivity of 100% for the low-, Moderate-, and High-Risk Groups; for the Highest-Risk Group, a Combined D-Dimer and age index was Used with a Sensitivity of 100%).

Abbreviations: AUC, area under the curve; NPV, negative predictive value; PPV, positive predictive value
c1: overall AUC of combining four risk stratifications with D-dimer thresholds and D-dimer + age index (0.30 µg/mL, 0.32 µg/mL, 0.34 µg/mL, 0.051). c2: overall AUC of revised Caprini risk stratifications + D-dimer (cut-off point of 0.015).
NRI(Categorical) = 0.113 (95% CI: 0.097-0.129; p < 0.001); IDI = 0.008 (95% CI: 0.007-0.009; p < 0.001)
For patients within the low-, moderate-, and high-risk stratifications, the D-dimer thresholds progressively decreased to 0.30, 0.32, and 0.34 µg/mL, respectively, as sensitivity increased to 100%. In the highest risk stratification, the D-dimer level + age combined index threshold was reduced to 0.051. Furthermore, compared to the revised Caprini + D-dimer level, the specific D-dimer thresholds combined with the four Caprini risk stratifications exhibited an enhanced predictive ability, with an NRI of 0.113 (p < 0.001) and an IDI of 0.008 (p < 0.001) (Table 9).
Discussion
The original Caprini score has proven useful in the clinic for predicting DVT risk. However, revising it by adjusting the scores for different risk strata and incorporating specific D-dimer thresholds enhances its ability to predict DVT risk preoperatively. The revised Caprini risk stratification is achieved by adjusting the scores of the original model. Combining the revised Caprini risk stratification with the D-dimer level involves introducing D-dimers as an independent factor, that works in parallel with the revised Caprini risk stratification to predict DVT risk. However, integrating specific D-dimer thresholds with the four Caprini risk stratifications involves setting D-dimer thresholds within each risk category, without altering the overall risk stratification structure. This approach optimizes the predictive ability of each risk level, thereby enhancing the overall accuracy of the existing model in predicting DVT. In this study, we found that the revised Caprini risk stratification predicted preoperative DVT risk in patients with knee osteoarthritis more accurately. Additionally, combining the revised Caprini risk stratification with D-dimer level was more effective than either indicator alone. Furthermore, integrating specific D-dimer thresholds with the four Caprini risk stratifications outperformed the combination of the revised Caprini risk stratification and D-dimer level, particularly in improving specificity and reducing unnecessary ultrasonography. In the highest-risk group of the revised Caprini, D-dimer thresholds alone may be insufficient, necessitating the inclusion of age indicators for more accurate prediction.
The original Caprini risk stratification is inadequate for predicting preoperative DVT in patients undergoing TJA, underscoring the need to reclassify the Caprini risk stratification. Our study revealed that after reclassifying the risk categories—low risk (0-2 points), moderate risk (3 points), high risk (4 points), and highest risk (≥ 5 points)—the number of individuals steadily decreased at higher risk levels, while the incidence of DVT increased.
Similarly, reclassifying the Caprini risk stratification has enhanced its predictive accuracy for VTE in plastic surgery patients29,30 and surgical ICU patients. 31 All of these studies assessed the Caprini risk stratification based on the VTE risk ratio between the two groups. Consequently, the original scoring for the highest risk stratification (≥ 5 points) was further refined into Caprini scores of 5–6, 7–8, and > 8.29,31 Moreover, Shaikh et al redefined the Caprini risk stratification in their study, categorizing scores of 0–5 as low risk, 6–8 as high risk, and ≥ 9 as very high risk, while excluding a moderate risk category. 30 Given the varying VTE risk profiles and incidences across different study populations, reclassifying risk stratification for specific groups is crucial for improving the predictive accuracy of the Caprini score.
Variability exists in the accuracy of the Caprini score when used as the sole predictor of VTE in patients undergoing TJA. Our study found that the Caprini score predicted preoperative DVT with an AUC of 0.599, which is consistent with the results reported by Gold et al, 14 who observed a poor predictive value for VTE after TJA, with an AUC of 0.57 (95% CI: 0.44-0.70). Other studies have reported an improvement in the AUC of the Caprini score for predicting postoperative VTE, with values of 0.619 and 0.896, respectively.10,12
However, D-dimer levels demonstrated greater predictive accuracy for preoperative DVT compared to the Caprini score in our study (AUC, 0.774 vs 0.592). Similarly, in a retrospective study of 1453 non-oncological urological inpatients, the AUC for D-dimer levels (0.86) exceeded that of the Caprini score (0.73) in predicting VTE. 32 This suggests that elevated D-dimer levels are associated with an increased risk of DVT and could potentially serve as a valuable predictor. Although D-dimer levels exhibit superior performance over the Caprini score in predicting DVT, the limitations inherent in relying on single predictors underscore the necessity of integrating both D-dimer and the Caprini score for accurate DVT prediction.
Combining the Caprini score with D-dimer levels could enhance DVT prediction accuracy. Previous studies have demonstrated that the combination of these two methods improves DVT prediction in patients with thoracolumbar fractures and lung cancer.18,19 Our study produced consistent results, showing that while the combination of revised Caprini risk stratification and D-dimer level significantly increased the AUC compared to the Caprini score alone, the improvement was minimal when compared to D-dimer levels alone.
The limitations of the Caprini score in TKA patients may stem from its inability to fully capture the specific thrombotic risk factors unique to this population. Furthermore, given that D-dimer is a highly sensitive biomarker for DVT with robust predictive capability on its own, the addition of other variables may not yield a significant improvement in predictive accuracy. It is, therefore, necessary to further explore how to fully utilize the advantages of D-dimer levels in predicting DVT to compensate for the deficiencies of the Caprini score.
Predictive values for D-dimer levels can be established based on different risk stratifications in the Caprini RAM, potentially enhancing VTE prediction. Stratifying the Wells score into low, moderate, and high risk, along with determining specific D-dimer thresholds, has been effective in predicting both DVT and pulmonary embolism.20,21,33,34 In our study, we employed three different methods to establish D-dimer thresholds for each Caprini risk stratification. We observed that as the D-dimer threshold decreased, predictive sensitivity gradually increased, while the overall AUC showed a declining trend. Although a D-dimer level of 0.50 µg/mL is commonly used as a standard for predicting positive and negative DVT cases, 35 this threshold did not achieve high sensitivity in our study (<90%). This stands in contrast to previous studies,36,37 which have reported sensitivities ranging from 92% to 100%. This suggests that a D-dimer level of 0.50 µg/mL may not be appropriate for predicting DVT in patients prior to TKA. To ensure that all potential DVT cases are identified in this patient population, it may be necessary to lower the threshold to 0.30, 0.32, and 0.34 µg/mL for the low-, moderate-, and high-risk groups, respectively.
However, an opposite trend was observed in the highest risk stratification, where the risk of DVT occurrence decreased with increasing D-dimer levels. This suggests that D-dimer alone is not a reliable predictor of DVT risk in the highest risk groups. A possible explanation for this finding is that patients in the highest risk group often present with various underlying medical conditions. Among the five patients with thrombosis in the highest risk group in our study, three had a history of previous VTE and were undergoing anticoagulation therapy. Long-term anticoagulation may result in a sustained decrease in D-dimer levels. 38 Consequently, the D-dimer level of one patient with intermuscular calf vein thrombosis was only 0.15 µg/mL prior to the operation. This reduction in D-dimer levels can lead to an inaccurate reflection of the true thrombotic state of the patient.
Our findings indicated that combining D-dimer levels and age significantly enhanced DVT prediction, increasing the AUC from 0.580 (predicted by D-dimer alone) to 0.678. Therefore, it is essential to combine D-dimer levels with age to accurately predict thrombotic risk in patients in the highest-risk group. Additionally, among the six patients with a history of VTE, two developed proximal DVT in the highest-risk group. It is recommended that patients with a history of VTE undergo preoperative lower-extremity venous ultrasonography to avoid missing a diagnosis of proximal DVT, thereby preventing significant adverse effects on clinical outcomes.
The integration of different Caprini risk stratifications with specific D-dimer thresholds outperformed the revised Caprini combined with D-dimer levels. The AUC for predicting DVT was consistently higher across all methods—whether using the Youden index, the same missed diagnosis rate, or achieving 100% sensitivity. This approach also significantly reduced unnecessary venous ultrasound examinations. Similarly, studies have shown that combining Wells scores with various D-dimer thresholds can reduce ultrasound use by 7.6%, 13.3%, and 47%.20,21,39 In the highest risk group, sensitivity should approach 100% to avoid missing proximal DVT, which could lead to PE. Conversely, in the low-risk group, reducing sensitivity can minimize unnecessary ultrasonography and optimize resource utilization. Therefore, integrating different risk stratifications with D-dimer thresholds improves the balance between sensitivity and specificity in DVT prediction. This approach allows for more tailored diagnostic strategies by adjusting D-dimer thresholds and sensitivities based on varying risk stratifications, ensuring safety for high-risk patients while avoiding excessive ultrasound in low-risk patients.
Our study has several limitations. First, the small number of DVT patients in the highest risk group may not accurately reflect the true trends in D-dimer changes. Future studies should aim to increase the number of DVT-positive cases in this group to further investigate the relationship between D-dimer levels and DVT risk and to enhance prediction accuracy. Second, preoperative anticoagulation therapy may influence the accuracy of D-dimer in predicting DVT. This study did not stratify the analysis based on preoperative anticoagulation therapy, which could impact the prediction outcomes. Future research should stratify patients according to their anticoagulation therapy to more accurately assess the value of D-dimer in predicting DVT across different clinical conditions. Third, most DVT-positive cases in this study were concentrated in intermuscular vein thrombosis, with fewer cases of proximal DVT, particularly femoral vein thrombosis. This imbalance may affect the accuracy of clinical predictions for proximal DVT. Future studies should aim to increase the sample size of patients with proximal DVT to enhance the reliability and clinical utility of predictions. Fourth, the results of our study were derived from a single center, limiting their generalizability. Therefore, further validation through prospective, multicenter studies is necessary to confirm our findings.
Our study has several strengths. First, the Caprini score was independently calculated by two nurses. For patients with inconsistent scores, a third senior doctor verified and confirmed the results to ensure that the data were accurate. Second, a detailed comparison was conducted between the method of determining the D-dimer threshold for different Caprini risk stratifications and the method combining the Caprini RAM with D-dimer level in predicting DVT. Ultimately, we concluded that the former, when considering the balance between sensitivity and specificity in clinical practice, provides more valuable clinical guidance.
Conclusion
The original Caprini risk stratification has certain limitations in predicting preoperative DVT in patients with knee osteoarthritis; however, the revised version significantly improves the prediction accuracy. Additionally, the combination of the revised Caprini risk stratification and D-dimer levels outperformed predictions based on single indicators. Notably, integrating specific D-dimer thresholds with the four Caprini risk stratifications represents the most effective strategy for enhancing specificity and minimizing unnecessary ultrasonography.
Footnotes
Author Contributions
Data Availability
Because of ethical and privacy restrictions regarding patient data, the datasets from this study are not available publicly. If needed, you can request the data from the corresponding author with a reasonable inquiry.
Declaration of Conflicting Interests
The authors declared no potential conflicts of interest with respect to the research, authorship, and/or publication of this article.
Funding
The authors disclosed receipt of the following financial support for the research, authorship, and/or publication of this article: This work was supported by the National Natural Science Foundation of China (grant number 72204268), Fundamental Research Funds for the Central Universities (grant number 3332022002), Shaanxi Provincial Key Research and Development Program Fund (grant number 2015SF137), Xi’an Jiaotong University Fund.