
Abstract
Background
The stage of cerebral venous thrombosis (CVT) is crucial to guide treatment decisions. This study aims to examine changes in fibrinolytic indicators throughout CVT onset and validate a predictive model using admission fibrinolytic indicators to estimate the CVT stage.
Methods
Retrospective analysis was conducted on data from 292 CVT patients. We utilized linear regression, time series, and univariate ANOVA analyses to explore characteristics of change in fibrinolytic indicators with CVT duration and identified time point at which fibrinolysis indexes showed significant changes as the time point for acute and chronic stages of CVT. A nomogram was employed to construct a prediction model using a training set, which was then evaluated for discrimination, calibration, and clinical utility.
Results
Prolonged onset duration independently correlated with decreased fibrinogen and D-dimer after adjusting for all variables, with adjusted correlation coefficients of −0.003 (−0.005, −0.001) and −0.004 (−0.007, −0.001), respectively. Significant changes in fibrinolytic indicators were observed around 14 days after CVT onset. The training set demonstrated an area under the curve (AUC) of 0.851 (95% CI: 0.7989-0.904) for the prediction model. Internal validation showed that the nomogram accurately predicted acute CVT with an AUC of 0.828 (95% CI: 0.738-0.918).
Conclusion
According to the trend of fibrinolysis index, 14 days of onset can be used as the dividing point of acute and chronic stages of CVT. For patients with unclear onset, the present model, based on admission fibrinogen and D-dimer values, can accurately predict the stage of CVT. The high discriminative ability indicates the potential of this model for classifying the acute patient.
Introduction
Cerebral venous thrombosis (CVT) is a rare but potentially devastating cause of neurologic disease. CVT accounts for 1% of all strokes, leads to poor outcomes or death in about 15% of patients, and preferentially impacts a younger population.1,2 Recanalization was independently associated with a favorable neurological outcome. 3 The accurate staging of CVT is crucial for selecting treatment regimens to realize recanalization.4,5 Anticoagulants alone have achieved good reperfusion effects for acute CVT patients. 6 However, due to thrombus organization and calcification, anticoagulation alone may not wholly recanalize the vessel for chronic CVT patients. Therefore, stent implantation may be a more effective treatment method.7,8 CVT can be classified into three stages based on the time of clinical symptoms onset: acute stage ≤48 h, subacute stage >48 h to ≤30 days, and chronic stage ≥ 1-month. 9 Furthermore, based on the evolution of magnetic resonance signals resulting from changes in hemoglobin oxygenation status, CVT can also be divided into three stages: acute stage 0–5 days, subacute stage 6–15 days, and chronic stage.10,11 Both staging methods have issues with accuracy and may yield significantly different results due to their different focuses. Therefore, there is currently a lack of staging methods that accurately reflect the thrombus formation time in CVT.
Fibrinogen is vital in blood hypercoagulability and venous thrombus formation.12,13 D-dimer (DD) is a specific product generated after activation of the fibrinolysis system, reflecting the degree of fibrinolysis system activation and being correlated with thrombus volume.14–16 The changes in fibrinogen and DD levels decrease from high to low after venous thrombus formation, dynamically reflecting the state of blood coagulation and fibrin dissolution and indirectly indicating the age of the thrombus. 17 Although fibrinogen and DD are commonly used to predict or differentiate the occurrence of CVT,18–20 their characteristics and application value in the confirmed CVT have not been fully summarized and explored. Therefore, this study aims to explore the characteristics of changes in FIB and DD levels with the duration of CVT and their predictive value for CVT staging.
Methods
Study Population
All CVT patients treated at Xuanwu Hospital affiliated with Capital Medical University from January 1, 2011, to December 31, 2022, were reviewed. The patients’ information, medical records, laboratory indicators, and neuroimages were collected via a physician workstation on admission. CVT was identified by magnetic resonance venography (MRV), computed tomographic venography (CTV), or digital subtraction angiography (DSA).
The inclusion criteria were:
First time confirmed CVT. Male or female patients older than 18 years from China. Recurrent CVT. Non-first visit in our hospital. Anticoagulation, thrombolytic, fibrinogen lowering, or other treatments affecting fibrinolytic indicators were initiated before admission. Suffering from blood system diseases. Suffering from liver disease or abnormal liver function. The onset time was uncertain. The duration of onset is more significant than one year. Patient with incomplete data.
The exclusion criteria were:
Data Extraction
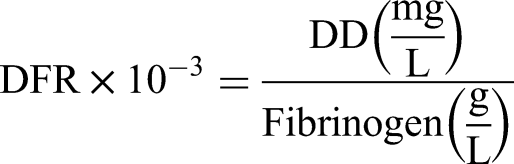
Two researchers reviewed all eligible patients. Demographic variables (sex and age), risk factors (hypertension, diabetes, hyperlipidemia, anemia, polycythemia, and tumor), sex-specific risk factors of females (oral contraceptive and pregnancy and perinatal period), clinical characteristics (headache, focal neurological deficit, visual impairment, seizure, and disturbance of consciousness), neuroimage characteristics (cerebral hernia, cerebral venous infarction, cerebral hemorrhage, the number of sinuses with thrombosis, and deep cerebral vein thrombosis), fibrinolysis indicators, duration of CVT onset and Modified Rankin Scale (mRS) score on admission were recorded for subsequent analysis. Cerebral hemorrhage includes parenchymal hemorrhage, subarachnoid hemorrhage, and subdural hemorrhage. Duration of CVT onset was defined as the interval between the onset of clinical symptoms and the collection of fibrinolysis indicators. Fibrinolysis indicators include fibrinogen (standard reference value: 2-4 g/L), DD (standard reference value: 0.01-0.5 mg/L), and fibrinogen to D-dimer ratio (DFR). The DFR value was calculated using the following formula:
Explore the Correlation Between the Duration of CVT Onset and Fibrinolytic Indicators
Linear regression analyses were employed to explore the correlations between fibrinolytic indicators and the duration of CVT onset. All variables were adjusted in the multivariable model, including sex, age, hypertension, diabetes, hyperlipidemia, anemia, polycythemia, tumor, oral contraceptive, pregnancy and perinatal period, headache, focal neurological deficit, visual impairment, seizure, disturbance of consciousness, cerebral hernia, cerebral venous infarction, cerebral hemorrhage, the number of sinuses with thrombosis, deep cerebral vine thrombosis, and admission mRS score.
Explore the Changing Characteristics of Fibrinolytic Indicators with the Duration of CVT Onset
Time series analysis was used to depict the temporal changes of fibrinolytic indicators with the duration of CVT onset. The process of converting a patient's duration into a time series is divided into three steps. Firstly, patients with the same duration of disease were divided into the same group. Then, the patients in each group were randomized. Finally, all patients from small to large are combined into a single overall sequence, which is the sequence for time series analysis (Table S1). Using R software, the patients’ fibrinogen, DD, and DFR data are transformed into time-series objects with the final identifiers as references, with a frequency of 1. Original and smoothed time-series plots are generated using R software to observe and explore the overall trends of fibrinolytic indicators over time. Here, k represents the number of observations averaged during the smoothing process. “In this study, k takes 5, 15, and 20 values. This is because when k is set to 20, the smoothed time-series plot allows observing trends in fibrinolysis indicators. The time range of significant changes in fibrinolytic indicators is determined through time series plots.
Quantitative Analysis of the Changes of Fibrinolytic Indicators with the Duration of CVT Onset
Univariate ANOVA analysis was employed to quantitatively compare the changes of fibrinolytic indicators among different groups grouped by the duration of CVT onset. Patients are stratified into seven groups based on the duration of CVT onset: Group 1–7, Group 8–14, Group 14–21, Group 22–28, Group 29–90, Group 91–180, and Group 181–365. Specifically, Group 1–7 comprises patients with disease onset within 1–7 days, with similar interpretations for other groups. Univariate ANOVA analysis was employed to quantitatively compare the changes of fibrinolytic indicators among these groups. By comparing the variances in fibrinolysis indicators among various groups, the time at which significant changes in fibrinolytic indicators occur is ultimately identified and serves as the distinguishing time point between acute and chronic CVT in this study.
Derivation and Validation of the Prediction Model
The time points for staging acute and chronic CVT determined through the above method enabled us to categorize patients into two groups: acute and chronic CVT. Subsequently, we utilized univariate and multivariate logistic regression analysis to assess the predictive value of fibrinolysis indicators for acute CVT and incorporated significant fibrinolysis indicators into the final model construction. Leveraging the random number generator in SPSS software, we divided the 292 patients into two groups at a ratio of 7:3 to constitute the training and internal validation sets. A nomogram was constructed based on the predictive factors selected by the multivariate logistic regression test. The nomogram's prediction accuracy was evaluated by ROC curve analysis, calibration curve analysis, decision curve analysis (DCA), and clinical impact curve (CIC) analysis. Finally, the model was validated internally by using an internal validation set.
Statistical Analysis
Descriptive statistics were used to characterize categorical and numerical variables. Categorical data were tabulated and presented as number(s) and percentage(s). Continuous variables were summarized using mean (standard deviation) or median (interquartile range). Univariate and multivariate linear regression analyses were used. The correlation coefficient (β) and 95% confidence intervals (CIs) were derived. Univariate (chi-square test, t-test, or Mann-Whitney U test, as appropriate) and multivariate logistic regression analyses were also used. The odds ratio (OR) and 95% confidence intervals (CIs) were also derived.
Statistical analyses were performed using the SPSS 27.0 software (IBM Corp., Armonk, NY) and EXCEL software, and the R 4.3.3 programming language undertook nomogram establishment. For all analyses, P < .05 was considered significant.
Results
Baseline Characteristics
We reviewed a total of 579 confirmed CVT patients during the study period from January 1, 2011, to December 31, 2022. Following strict inclusion and exclusion criteria, 292 patients were included in the final study cohort, as illustrated in Figure 1. Among these, 49.3% (144/292) were male, with a mean age of 38.5 ± 13.7 years. All patients’ median duration of symptoms was 12 days (interquartile range: 5, 30). The median mRS score for all patients was 1 (1, 3). Further details regarding the patients’ other baseline characteristics are provided in Table 1.
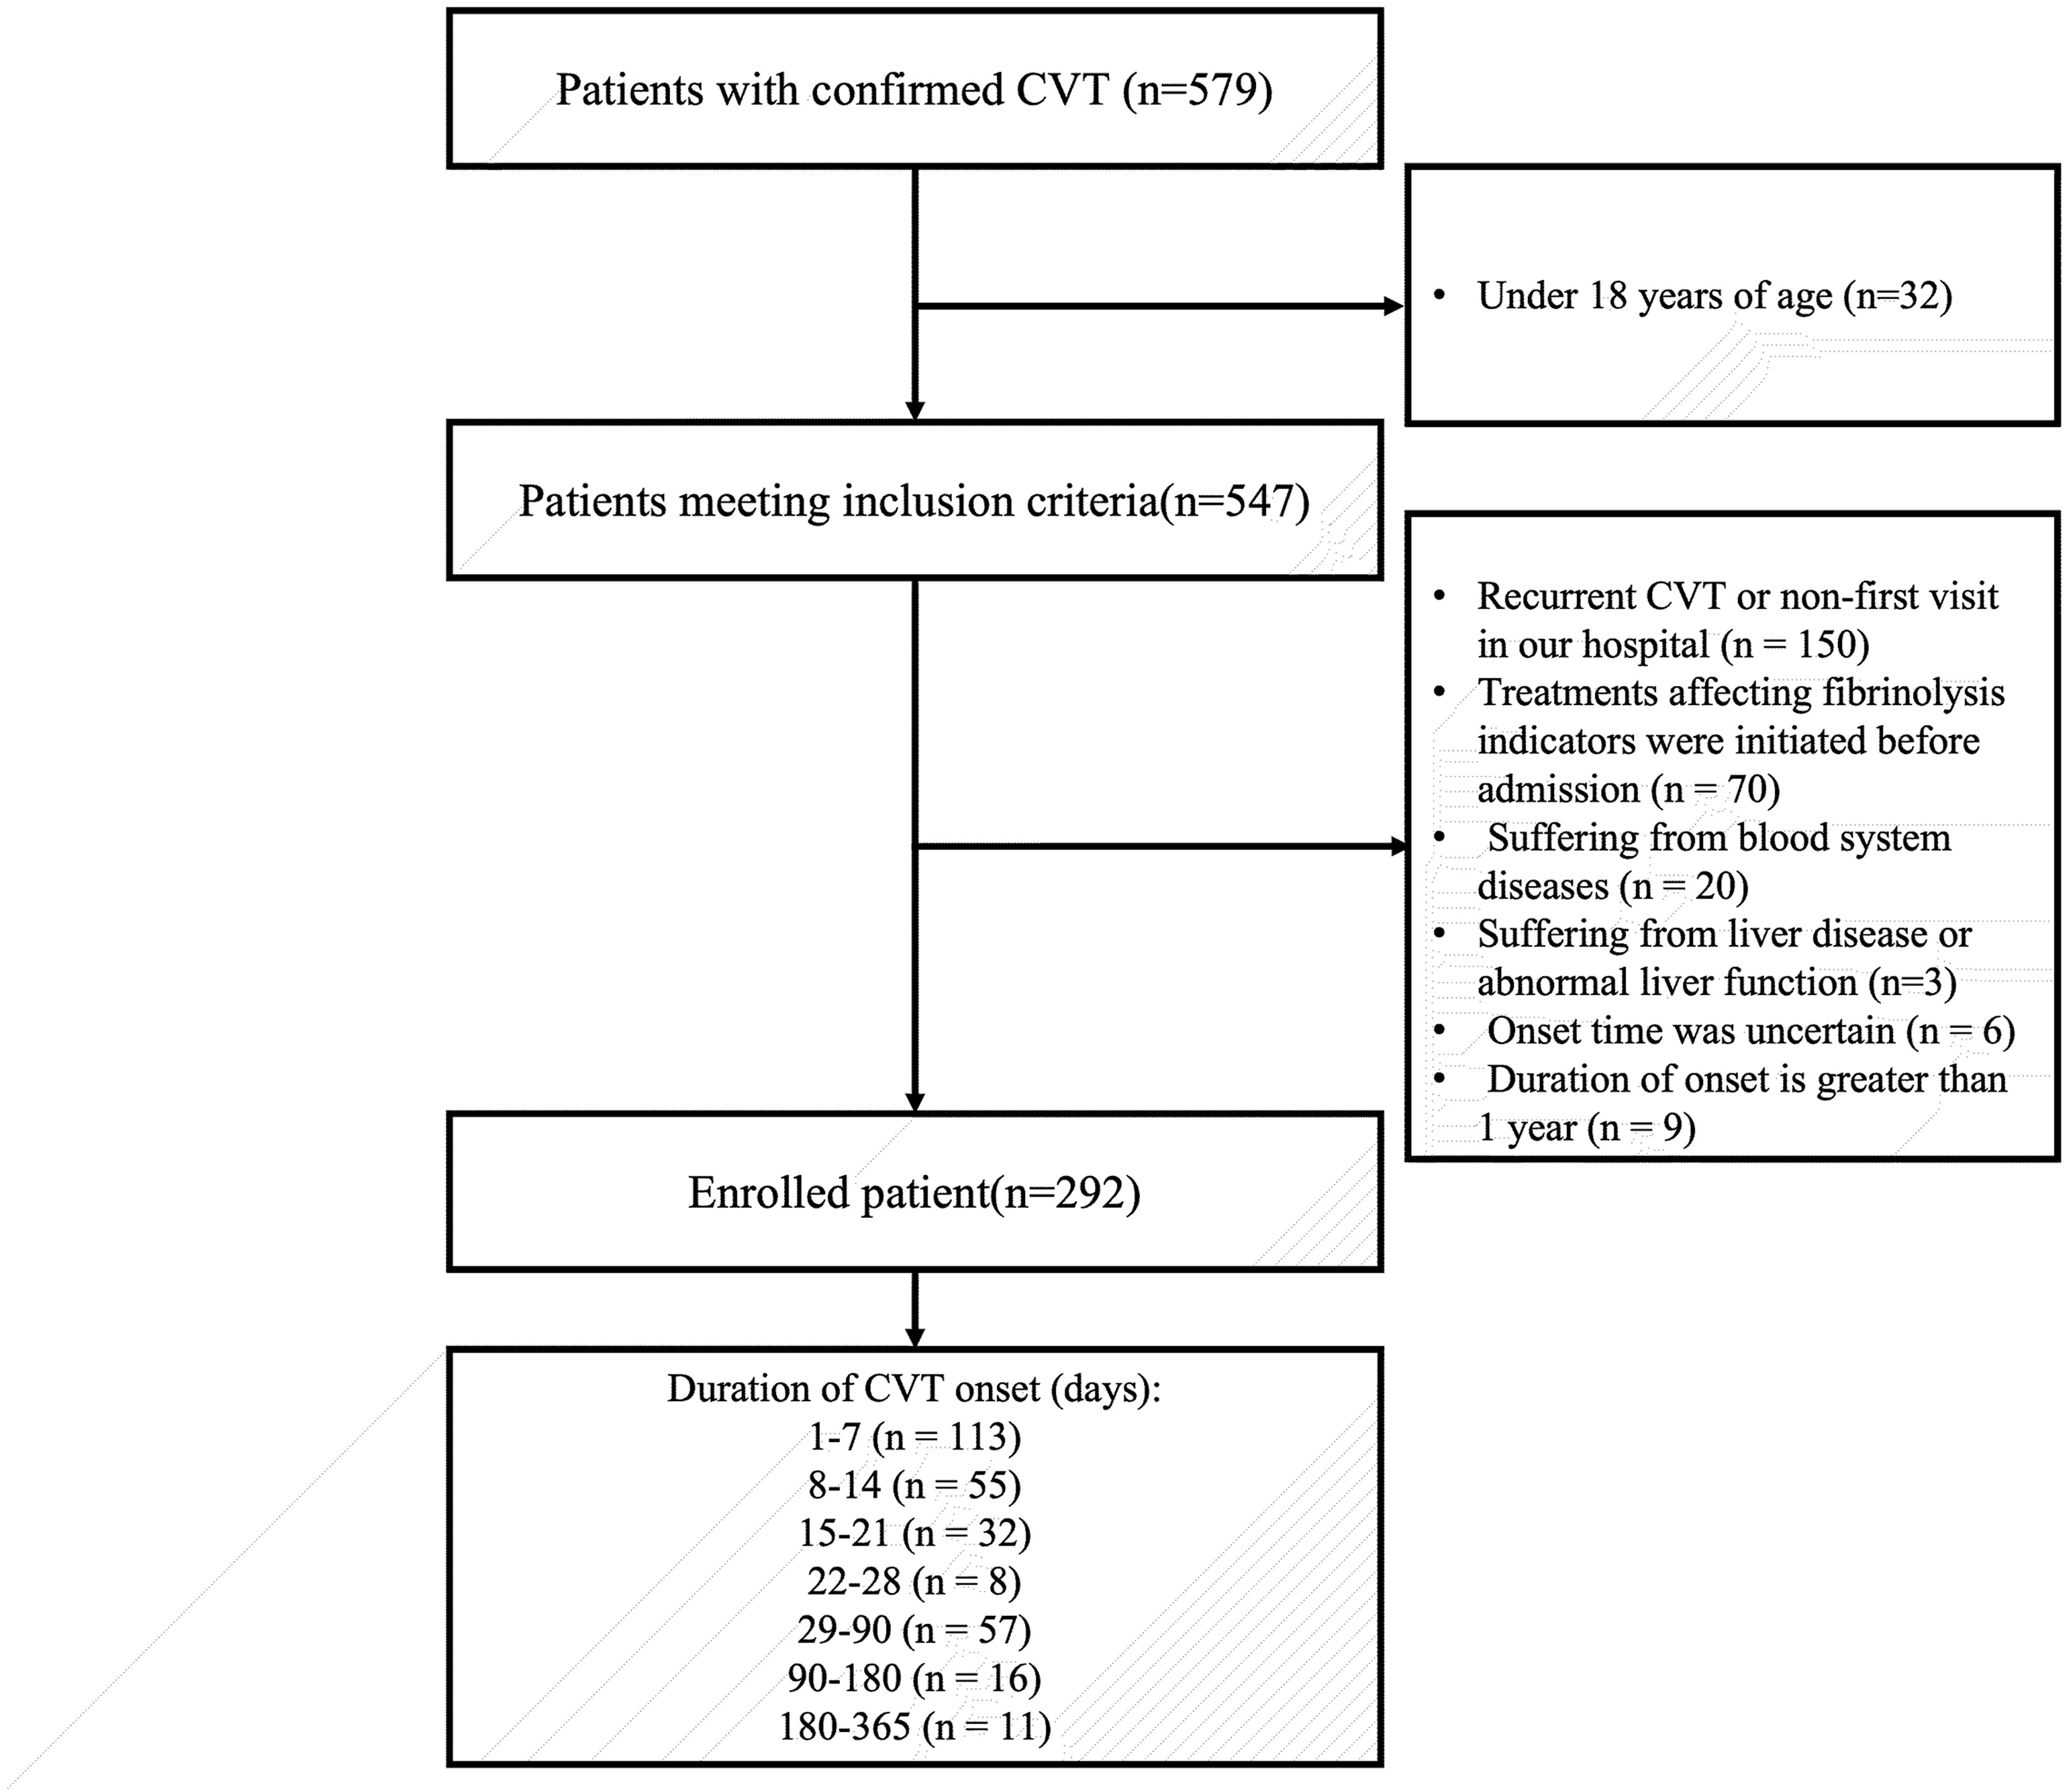
The detailed process of patient selection.
Baseline Characteristics.
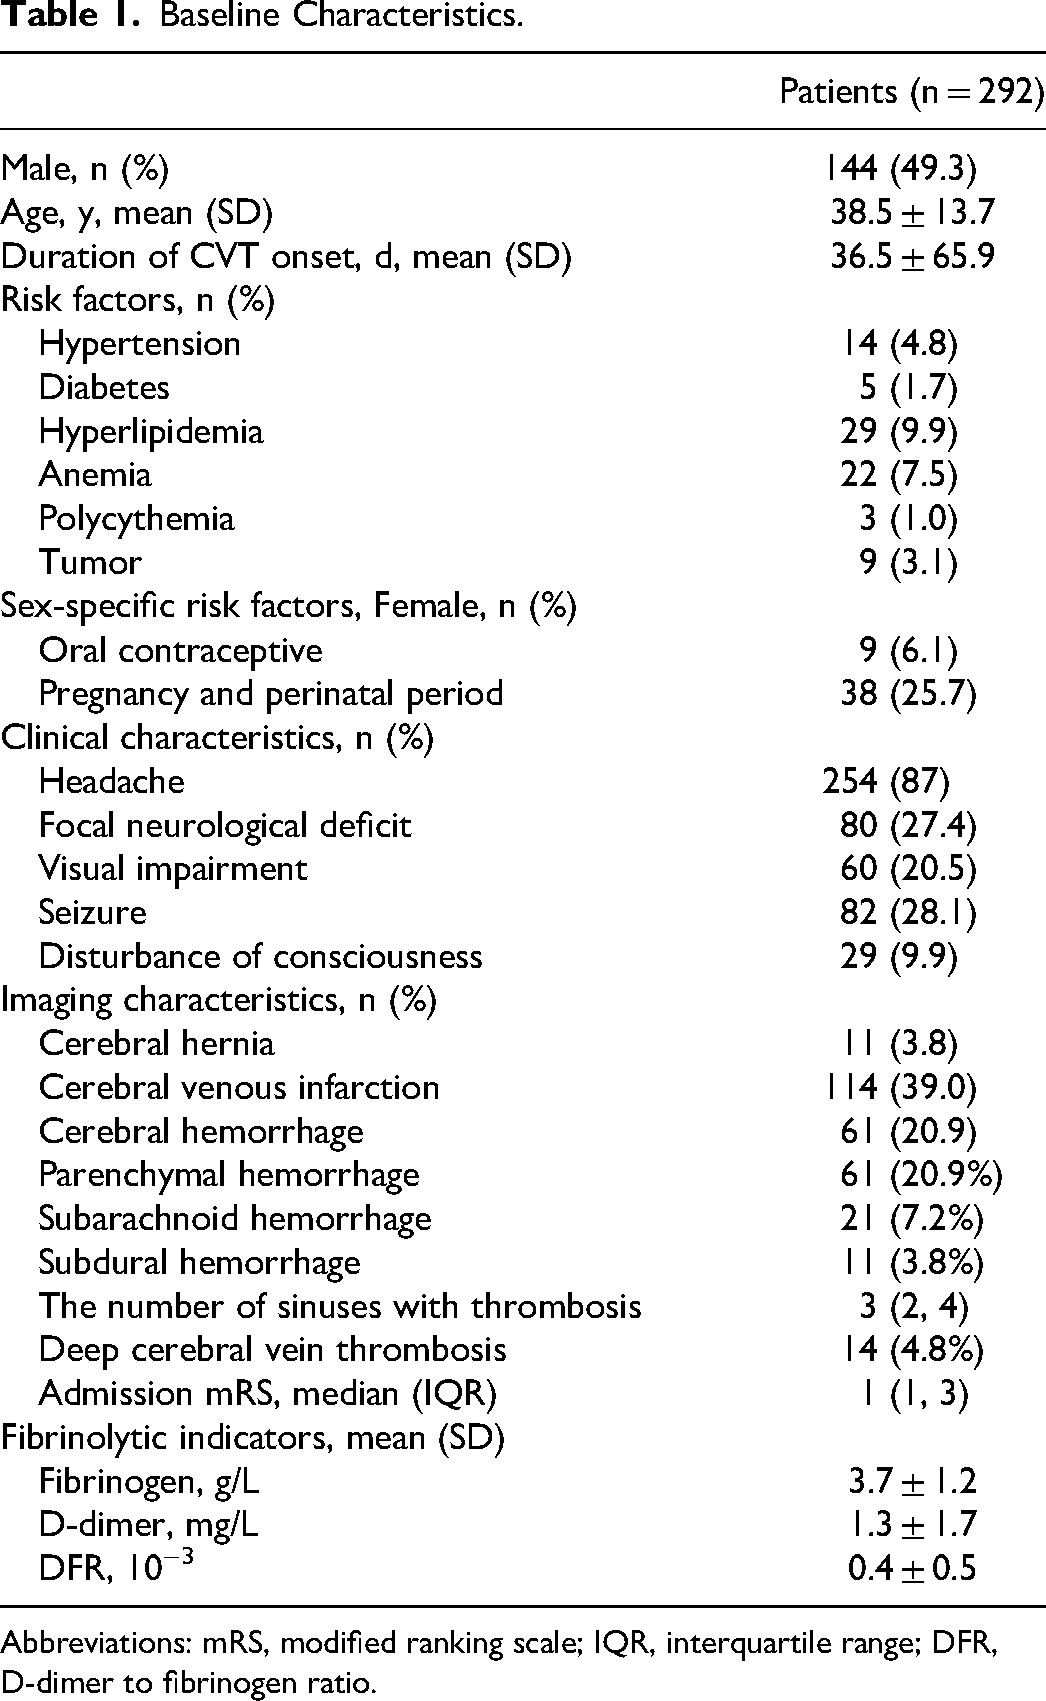
Abbreviations: mRS, modified ranking scale; IQR, interquartile range; DFR, D-dimer to fibrinogen ratio.
The Correlation Between Duration of CVT Onset with Fibrinolysis Indicators Changes
Linear regression analysis was used to explore the potential correlation between the duration of onset with fibrinogen, DD, and DFR. Increased duration of onset was associated with the decline of fibrinolysis indicators in univariate analysis, with a correlation coefficient of −0.004 (−0.006-−0.002) for fibrinogen, −0.007 (−0.010-−0.004) for DD, and −0.002 (−0.003-−0.001) for DFR, respectively (p < .005). Increased duration of onset was identified as an independent factor for the decline of fibrinogen and DD after adjusting all variables, with an adjusted correlation coefficient of −0.003 (−0.005-−0.001) and −0.004 (−0.007-−0.001) (p < .01) (Table 2).
The Correlation Between the Duration of Onset with Fibrinolysis Indicators.
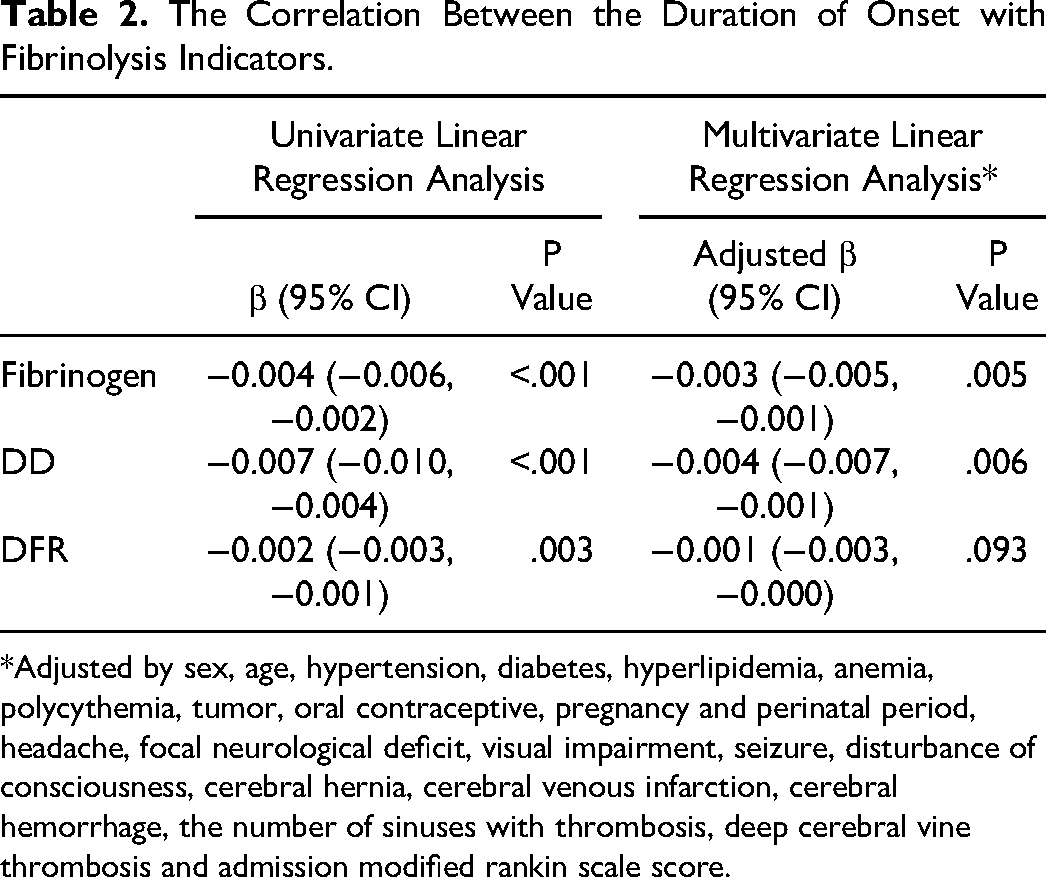
*Adjusted by sex, age, hypertension, diabetes, hyperlipidemia, anemia, polycythemia, tumor, oral contraceptive, pregnancy and perinatal period, headache, focal neurological deficit, visual impairment, seizure, disturbance of consciousness, cerebral hernia, cerebral venous infarction, cerebral hemorrhage, the number of sinuses with thrombosis, deep cerebral vine thrombosis and admission modified rankin scale score.
The Changing Trend of Fibrinolytic Indicators with the Duration of CVT Onset
Through the smoothed time series plots, we could readily observe the progressive decline in fibrinogen (Figure 2A), DD (Figure 2B), and DFR (Figure 2C) levels with increasing duration of CVT onset. At time points 180–200, fibrinolytic indicators had a more pronounced downward trend, particularly in DD and DFR. The actual duration of CVT onset corresponds to time points 180–200, which ranged from 15–21 days (see Table S1).
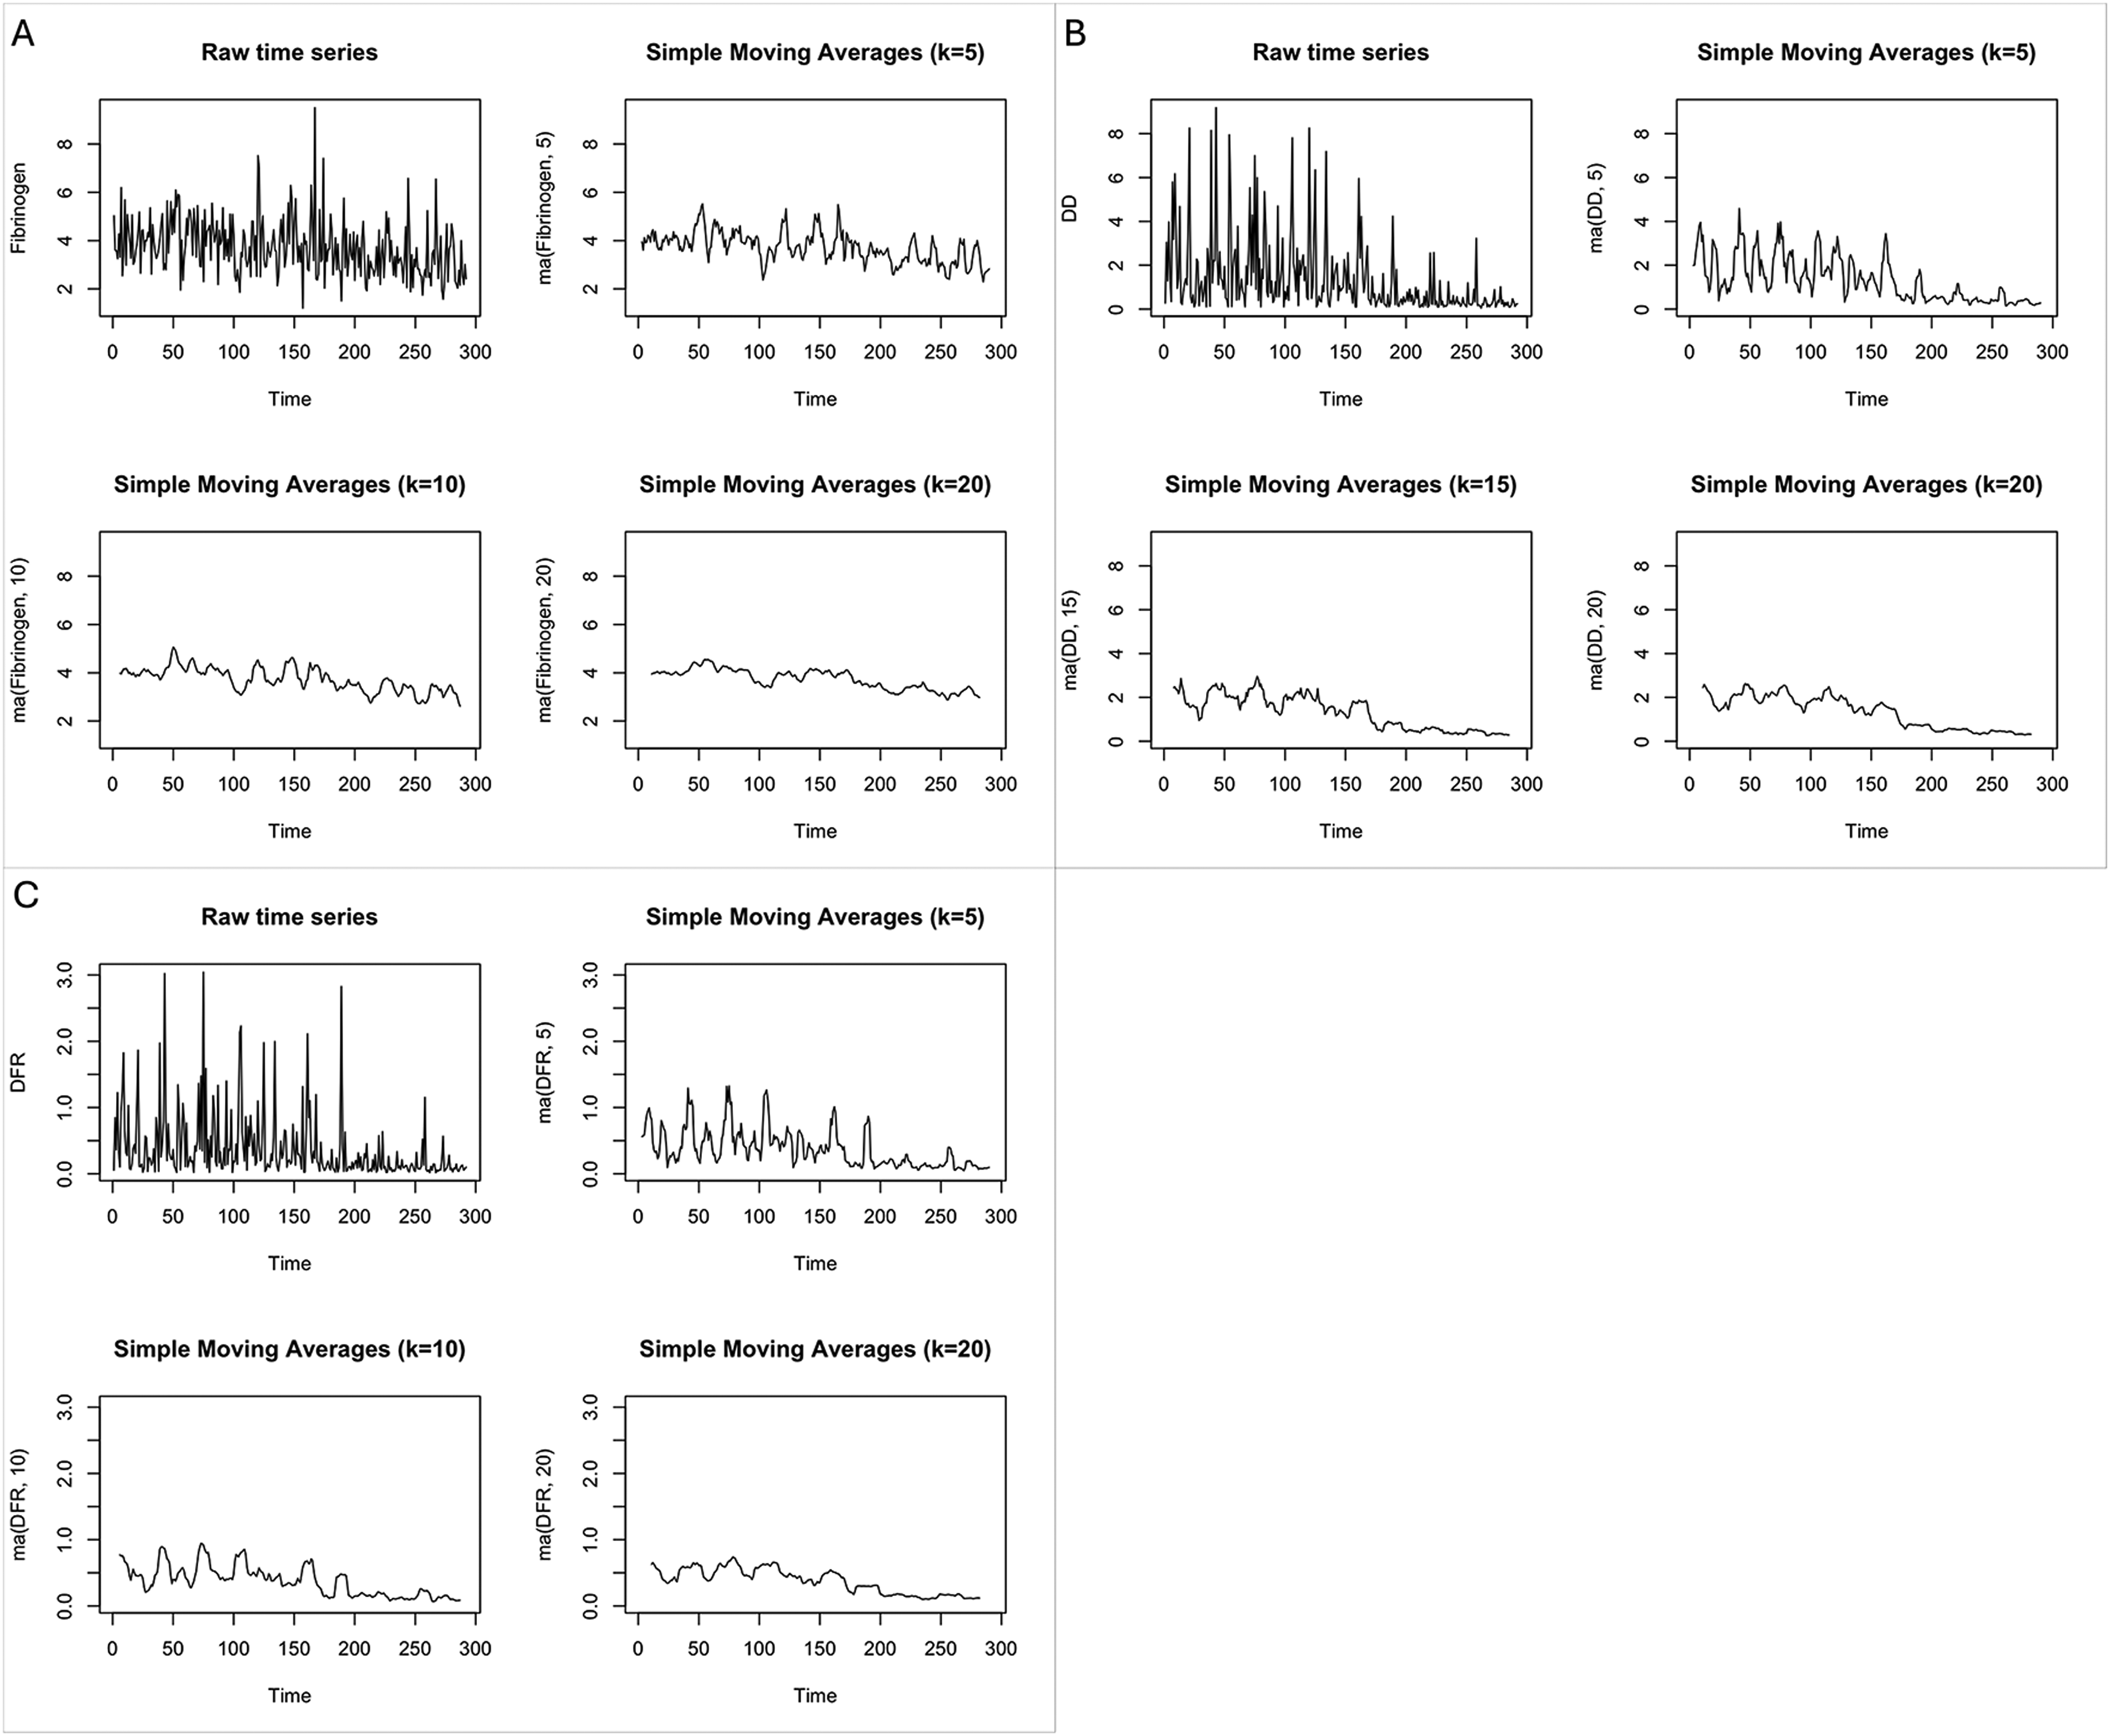
The row time series plot and the smoothed time series plots. (A) Fibrinogen. (B) D-dimer. (C) D-dimer to fibrinogen ratio. k represents the number of observations averaged during the simple moving average process.
Quantitative Analysis of the Changes of Fibrinolysis Indicators with the Duration of CVT Onset
The mean values of fibrinogen, DD, and DFR, grouped by duration of CVT onset, were depicted in Figure 3 and Table S2. Table S3 presents the absolute differences of each fibrinolysis indicator between groups. From Figure 3, a noticeable downward trend in fibrinogen, DD, and DFR levels is observed with a prolonged duration of CVT onset. No significant differences in fibrinogen, DD, and DFR levels were noted between Group 1–7 and Group 8–14. However, the level of fibrinogen in Group 1–7(Mean ± SD: 4.02 ± 1.00) was significantly higher than those in Group 15–21 (3.56 ± 1.19, P = .040), Group 29–90 (3.16 ± 0.95, P = .000), and group 181–365 (2.65 ± 0.64, P = .000). The level of fibrinogen in Group 8–14 (4.04 ± 1.45) was significantly higher than those in Group 29–90 (P = .000), and Group 181–365 (P = .000).
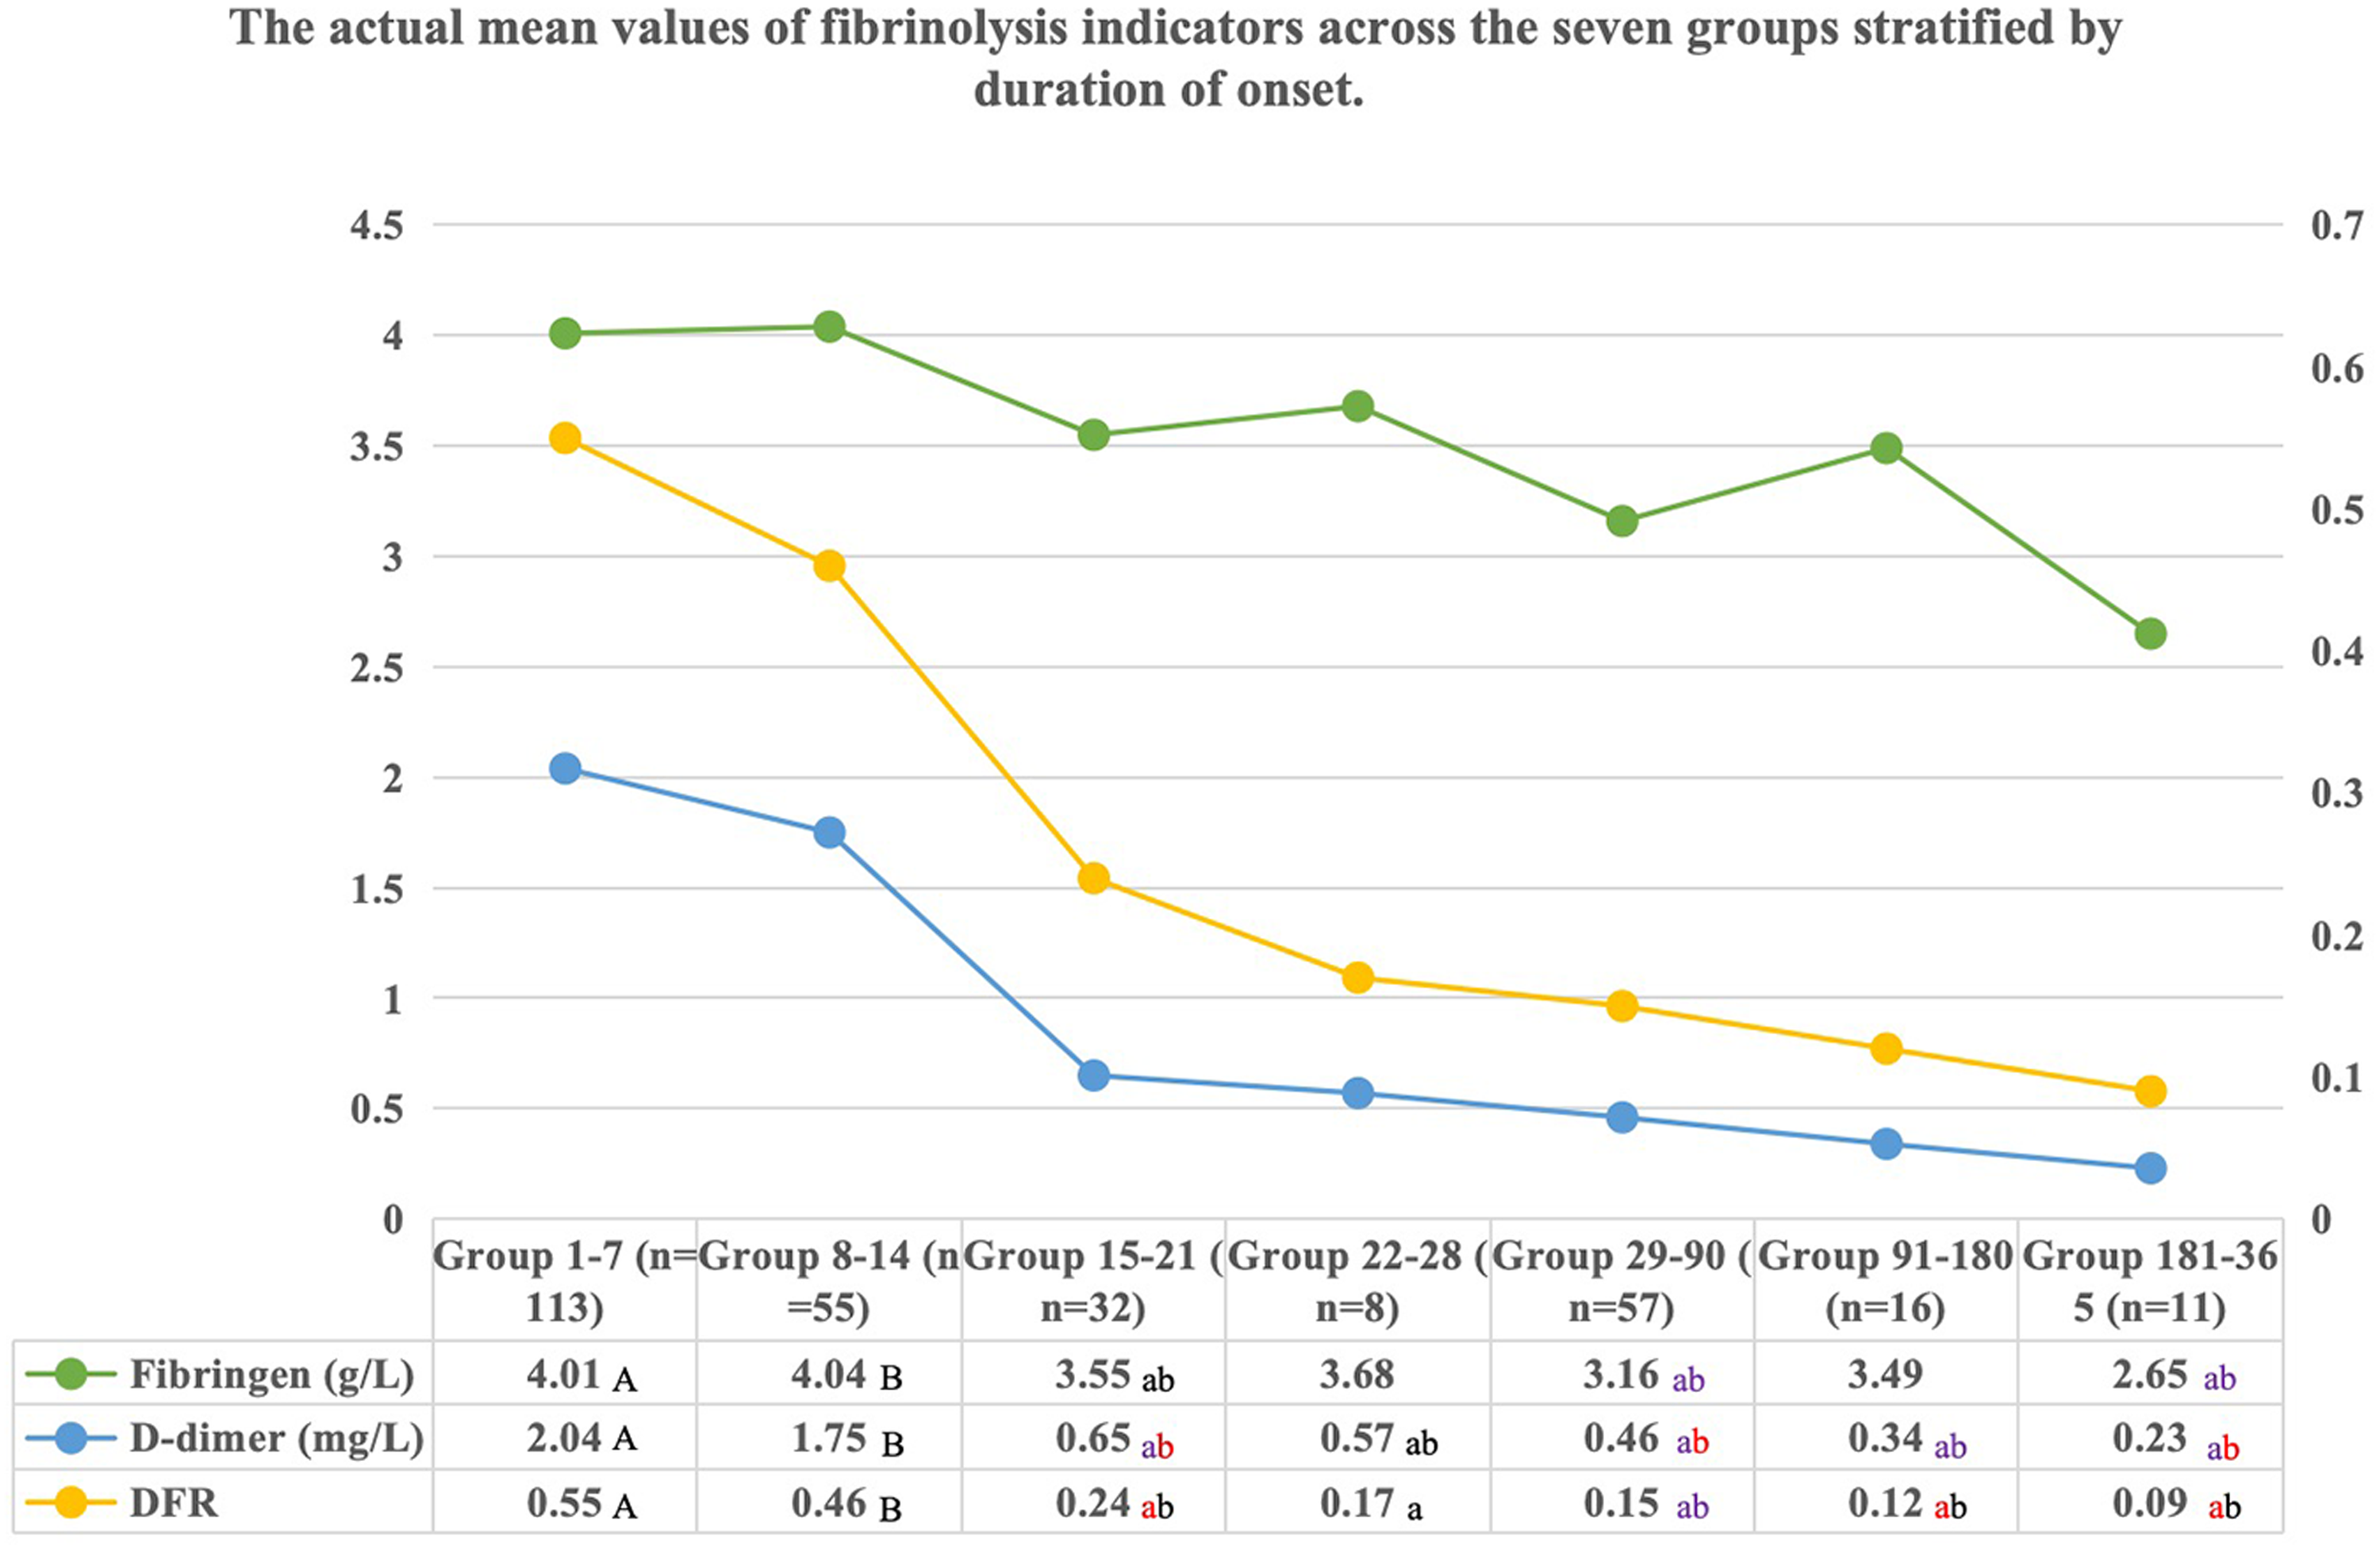
The changes of mean values of fibrinolysis indicators between groups according to onset duration. Significant differences between numbers marked with different cases of the same letter (A-a, B-b). The colors of the lowercase letters represent various levels of significance of the differences. Black: P < .05; Red: P < .01; Purple: P < .001. DFR uses the reference value on the right.
DD levels in Group 1–7 (2.04 ± 2.06) and Group 8–14 (1.75 ± 1.77) were significantly higher than those in other groups. The level of DD in Group 1–7 was significantly higher than those in Group 15–21 (0.65 ± 0.81, P = .000), Group 22–28 (0.57 ± 0.30, P = .010), Group 29–90 (0.46 ± 0.63, P = .000), Group 91–180 (0.34 ± 0.27, P = .000), and Group 181–365 (0.23 ± 0.12, P = .000). The level of DD in Group 8–14 was significantly higher than those in Group 15–21 (P = .002), Group 22–28 (P = .046), Group 29–90 (P = .000), Group 91–180 (P = .002), and Group 181–365 (P = .003), with no significant differences observed among other groups.
DFR analysis results was like DD. The level of DFR in Group 1–7 (0.55 ± 0.60) was significantly higher than those in Group 15–21 (0.24 ± 0.49, P = .001), Group 22–28(0.17 ± 0.11, P = .028), Group 29–90 (0.15 ± 0.19, P = .000), Group 91–180 (0.12 ± 0.14, P = .001), and Group 181–365 (0.09 ± 0.03, P = .002). The level of DFR in Group 8–14 (0.47 ± 0.49) was significantly higher than those in Group 15–21 (P = .035), Group 29–90 (P = .000), Group 91–180 (P = .011), and Group 181–365 (P = .016), with no significant differences observed among other groups.
Additionally, the curve also indicates a more significant rate of change in fibrinolysis indicators between Group 8–14 and Group 15–21.
Development and Validation of a Clinical Prediction Model for Staging of CVT
The data of 204 patients were utilized to construct the training set for establishing the predictive model, while the data of 88 patients constituted the validation set for internal validation. Based on all analyses above, this study defines the onset of the 14th day as the time point for distinguishing between acute and chronic stages of CVT, with patients experiencing symptoms for less than 14 days classified as acute CVT cases. Multivariate logistic regression analysis revealed that fibrinogen, DD, and DFR hold significant predictive value for acute CVT (Table S4). However, in the preliminary model construction, it was observed that DFR contributed with a lower weight. Only fibrinogen and DD were incorporated into the model construction process to streamline the model. A prediction model was established and is shown as a nomogram in Figure 4.
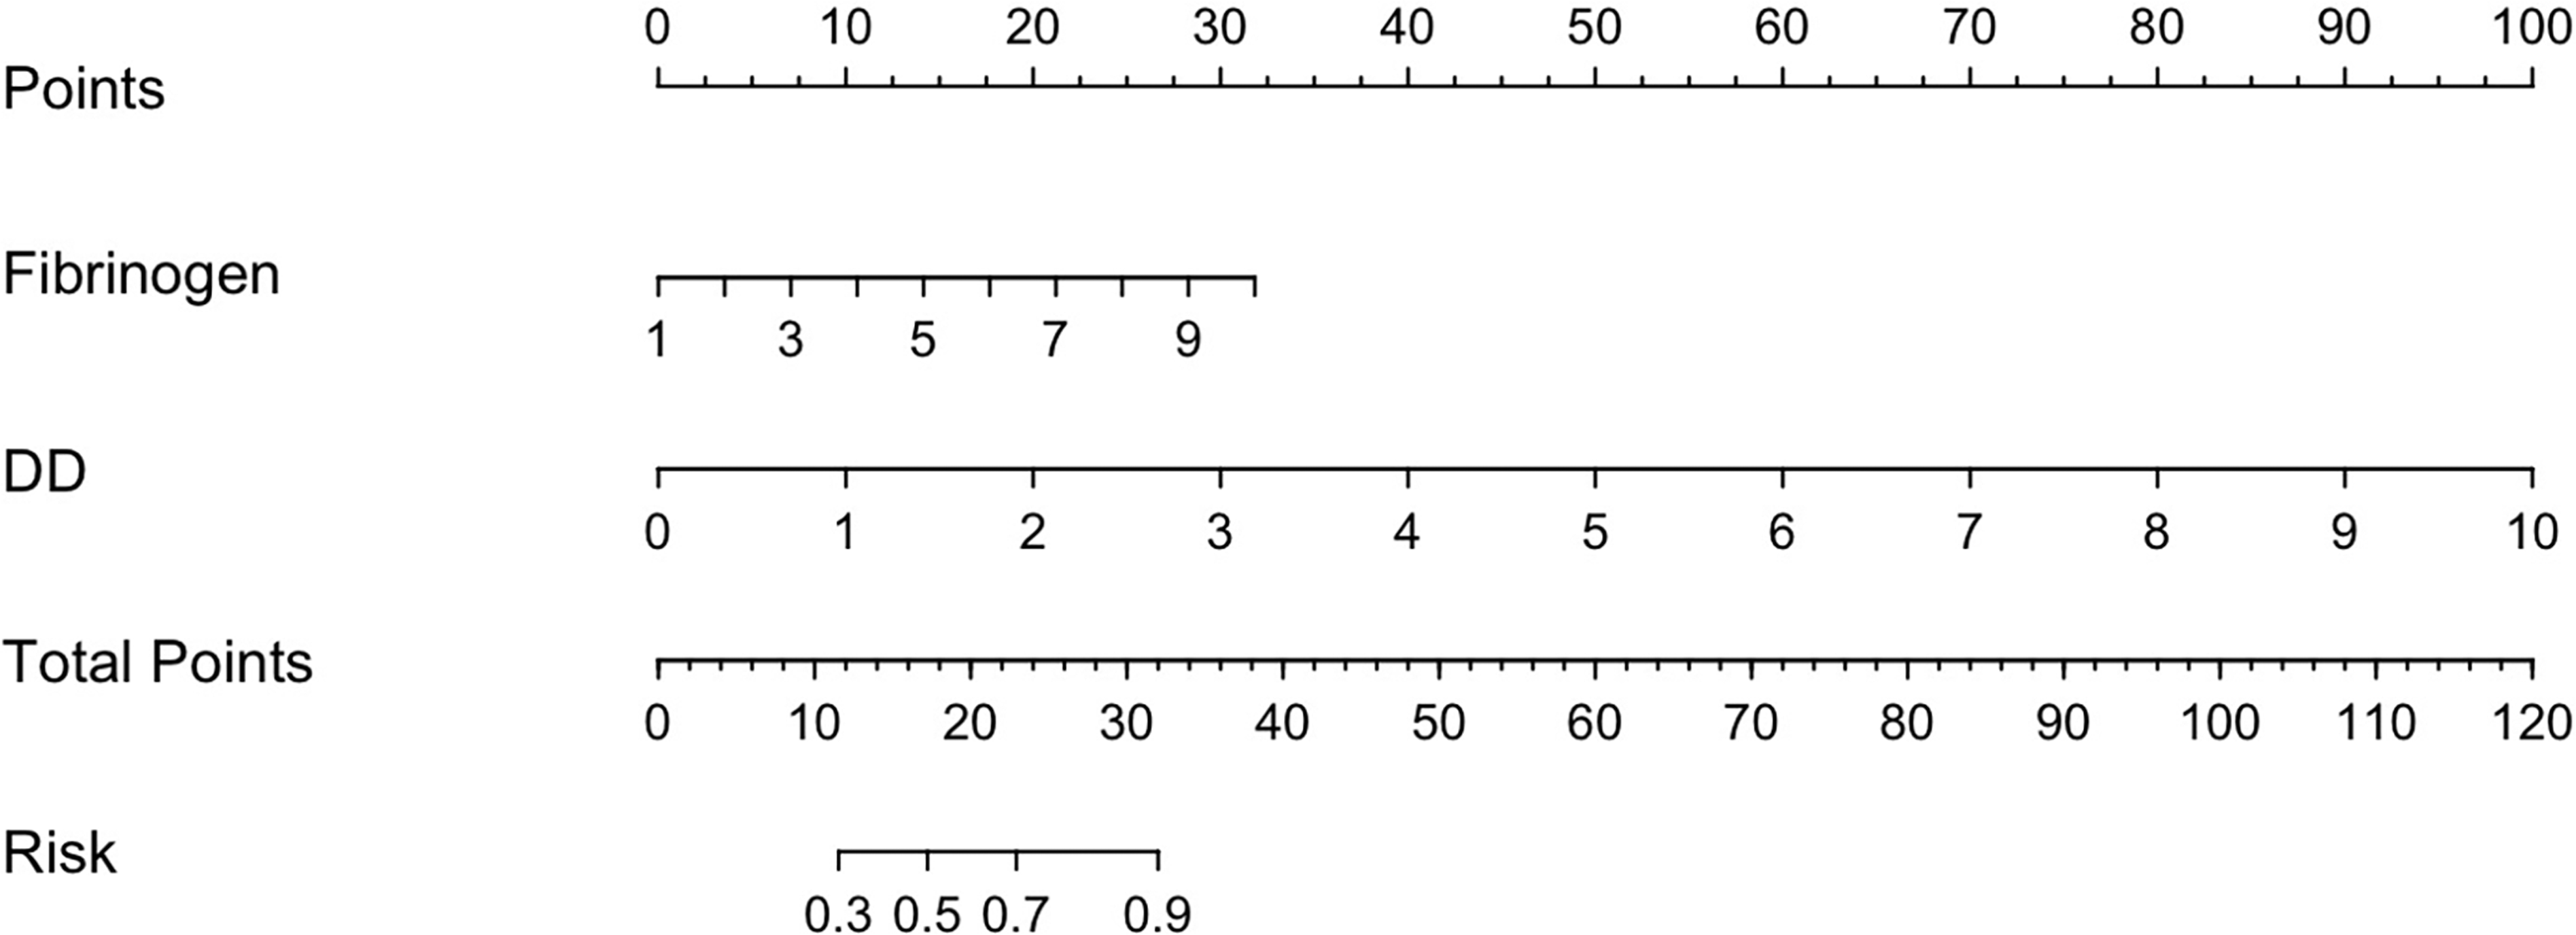
Nomogram for the prediction of acute CVT and its discrimination performance.
To evaluate the discriminative power of the model, ROC curve analysis showed that the AUC value was 0.851 (95% CI: 0.798-0.904) (Figure 5A) in the training set. The calibration curve analysis of this proposed predictive model presented a good agreement in our research (Figure 5B). The DCA showed that because threshold probability was within the range from 0.0 to 1.0, this nomogram could obtain a more significant net benefit than either ‘‘treat none’’ or ‘‘treat all’’ scheme. The nomogram also received a higher net benefit than each factor alone across the reasonable threshold probabilities (Figure 5C). The CIC analysis demonstrated the clinical effectiveness of the nomogram. The number of subjects who were at high risk (the number of positive cases predicted by the nomogram) was highly matched with the number of subjects who were at high risk with outcomes (the number of true-positive cases) when the threshold probability was above 60% (Figure 5D).
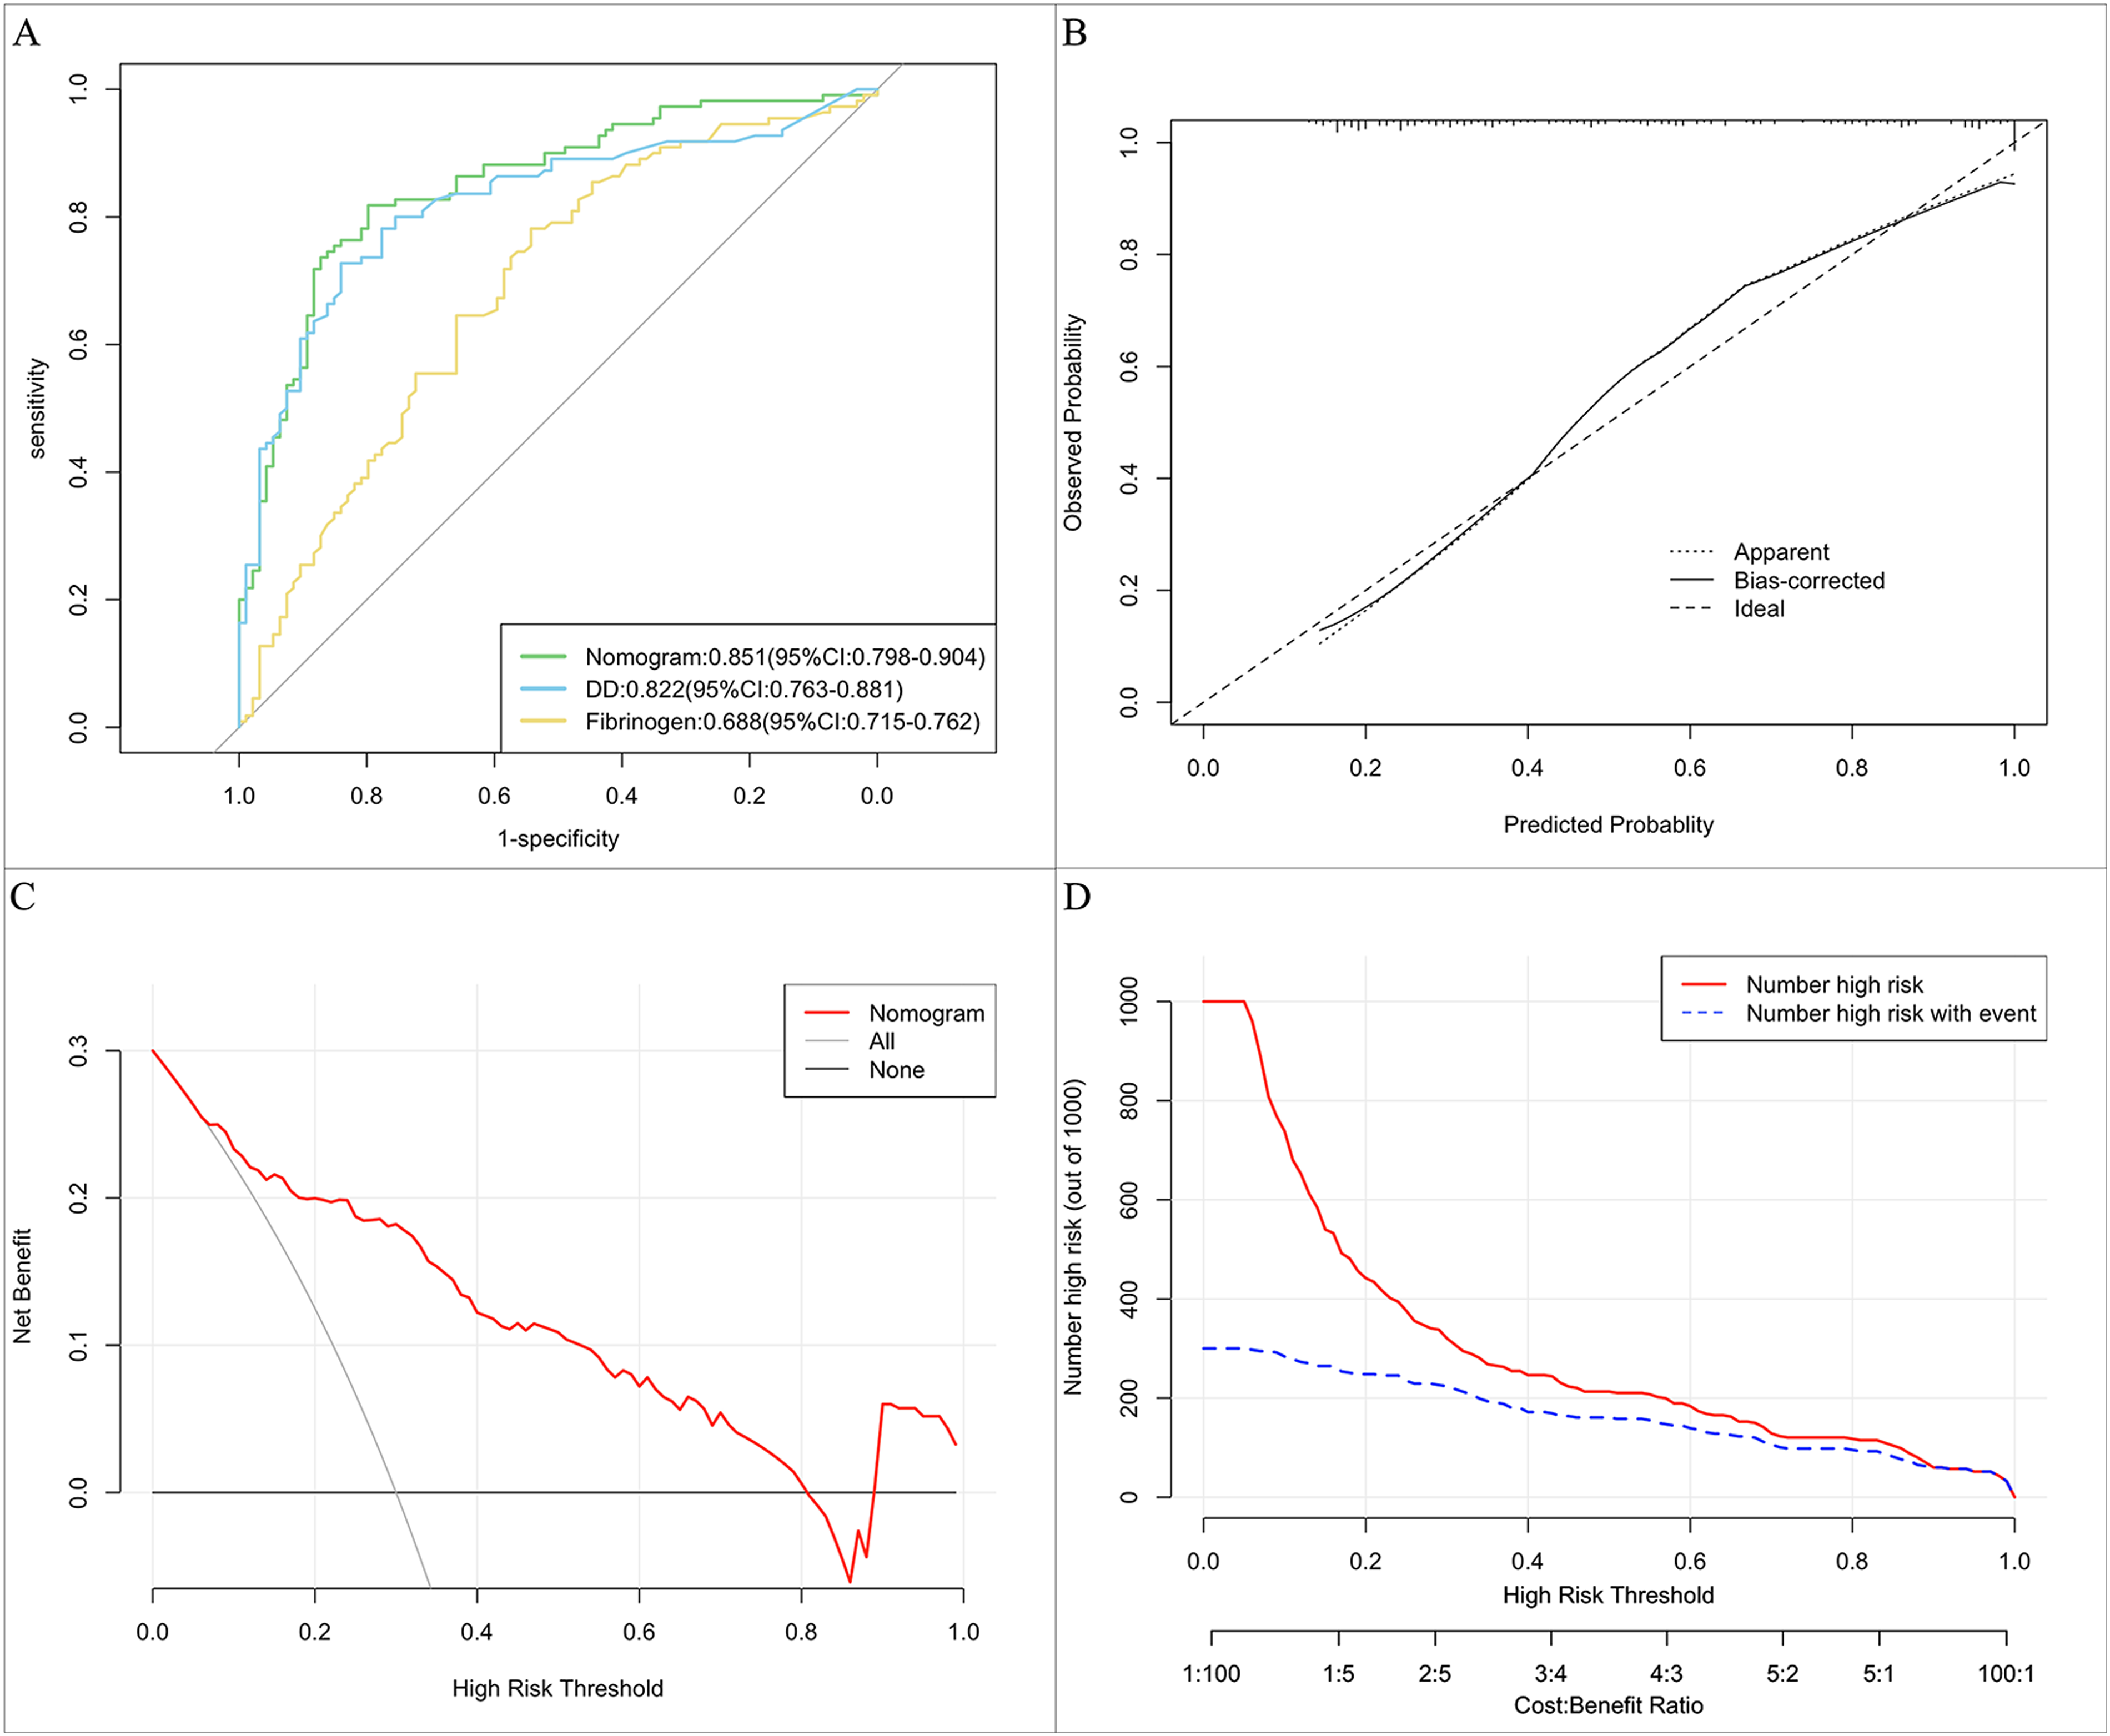
The results of receiver operating characteristic (ROC) curve analysis, calibration curve analysis (CCA), decision curve analysis (DCA), and clinical impact curve (CIC) analysis of the purposed nomogram in the training set. (A) The area under the curve (AUC) of the ROC curve of the purposed nomogram for predicting acute CVT in the training cohort was 0.851, with a 95% confidence interval of 0.798–0.904. (B) The calibration curve analysis of the nomogram in the training cohort. The dashed line stands for perfect prediction. The dotted line represents apparent estimates of predicted versus observed values; meanwhile, the solid line (on behalf of bias) shows the corrected estimates by employing 1000 bootstrap samples. (C) The DCA of the purposed nomogram in the training cohort. It was revealed that acute CVT prediction using the nomogram is accompanied by a high net benefit and by treating either no or all patients. (D) The CIC analysis of the purposed nomogram in the training cohort. The red curve (the number of individuals at high risk) indicates the number of persons who are classified as positive (high risk) by the prediction model at each threshold probability; the blue curve (the number of individuals at high risk with outcomes) is the number of true positives at each threshold probability.
Internal validation was conducted in a validation cohort of 88 patients. In the internal validation cohort, ROC curve analysis showed that the AUC of the prediction model was 0.828 (95% CI: 0.738-0.918) (Figure 6A). Besides, the calibration curve analysis of the purposed prediction model revealed a good agreement in the validation cohort (Figure 6B). The decision curve and clinical impact curve showed net benefit in the internal validation cohort (Figure 6C and D).

The results of receiver operating characteristic (ROC) curve analysis, calibration curve analysis (CCA), decision curve analysis (DCA), and clinical impact curve (CIC) analysis of the purposed nomogram in the internal validation set. (A) The AUC of the purposed nomogram for predicting acute CVT in the internal validation cohort was 0.837, with a 95% confidence interval of 0.747–0.926. (B) The Calibration curve analysis of the nomogram in the internal validation cohort. The dashed line stands for perfect prediction. The dotted line represents apparent estimates of predicted versus observed values; meanwhile, the solid line (on behalf of bias) shows the corrected estimates by employing 1000 bootstrap samples. (C) The DCA of the proposed nomogram is in the internal validation cohort. It was revealed that acute CVT prediction using the nomogram is accompanied by a high net benefit and by treating either no or all patients. (D) The CIC analysis of the purposed nomogram in the internal validation cohort. The red curve (the number of individuals at high risk) indicates the number of persons who are classified as positive (high risk) by the prediction model at each threshold probability; the blue curve (the number of individuals at high risk with outcomes) is the number of true positives at each threshold probability.
Discussion
CVT is a rare but potentially devastating cause of neurologic disease. The identification of CVT stage has important guiding significance for the choice of treatment. This study aimed to investigate the changing patterns of fibrinogen, DD, and DFR in CVT patients. In addition, the predictive values of these three indicators for acute CVT were explored. The study found a significant correlation between the duration of CVT onset and fibrinogen (P = .005) and DD (P = .006). As the duration of CVT extended, FIB, DD, and DFR gradually decreased, with substantial differences appearing around 14 days after onset. Additionally, fibrinogen (P = .034) and DD (P = .003) showed good predictive and discriminatory value for acute CVT.
With the progression of CVT duration, the nature of the thrombus gradually changes. Newly formed thrombi tend to be sparse and are prone to propagation due to increased coagulation factor activity, thus benefiting from anticoagulant or thrombolytic therapy.4,6 In contrast, aged thrombus becomes denser due to organization and calcification, where anticoagulation alone may not provide satisfactory clinical benefits, making a combined approach with endovascular treatment and medications more valuable.5,7,8 In addition, with the occurrence of thrombotic events, the coagulation cascade reaction is triggered, and a variety of coagulation factors participate in the expansion and stability of thrombus, among which coagulation factor XIII increases the stability of thrombus by promoting the cross-linking between fibrins, thus increasing the difficulty of CVT recanalization.21–23 Previous studies by Chinese scholars have explored individualized treatments based on the duration of CVT, confirming the potential clinical benefit of vascular reconstruction surgery for chronic CVT. 24 Therefore, accurate determination of CVT staging or thrombus age is crucial.
Currently, several methods are employed to discriminate between old and new thrombus. Determining the thrombus formation time based on the onset of clinical symptoms may not always align with the actual formation time, as clinical symptoms often manifest only after thrombus accumulation reaches a certain level. 9 Another method is through imaging examination. As the thrombus ages, oxyhemoglobin is converted to deoxyhemoglobin and methemoglobin, leading to changes in signal characteristics on the T1 and T2 sequences.10,11 In these early stages, it is challenging to diagnose thrombosis because T2 may be isointense or hypointense, mimicking a normal flow void of a venous sinus. Similarly, time-of-flight MRV is susceptible to misdiagnosis because absent flow is not always corroborated on T1//T2 sequences. The most accurate method for thrombus determination is through pathological histological examination. As the duration of thrombus formation extends, thrombi gradually undergo organization and calcification, with significant changes observed at 2 and 3 weeks, respectively. 25 With the development of radiomics, cellular immunology and microscopic imaging techniques, more and more emerging techniques can be used for the diagnosis of thrombotic diseases, such as the diagnosis of CVT based on radiomic features and the diagnosis of thrombotic age based on imaging techniques or confocal microscopy.26–29 We are happy to see more and more emerging technologies serving clinical practice, but at present, the clinical transformation and popularization of emerging technologies has a long way to go.
Additionally, although coagulation indicators such as PT, PTT, fibrinogen, and DD do not directly reflect the age of thrombi, they provide some assistance. DD and fibrinogen levels gradually decrease after venous thrombosis formation. 30 Our study, consistent with previous research, found that FIB, DD, and DFR decrease with CVT duration. Furthermore, our study identified a significant decrease in fibrinolytic indicators around 14 days after onset, consistent with imaging and histopathological staging. However, there is no relevant research on using fibrinolytic indicators for CVT staging. Nevertheless, fibrinolytic indicators are easy to obtain and directly reflect dynamic changes in coagulation and fibrinolytic function, making them valuable for exploring the disease staging value.
In the present study, we established a prediction model for acute CVT and demonstrated that fibrinogen and DD can predict acute CVT on admission. When validated in an internal cohort, the prediction model's performance was highly reliable. Patients with acute CVT may be identified using this prediction model and receive suitable therapies. Various therapeutic regimens may improve the outcome of patients with different stages of CVT. However, whether they could benefit from different treatments based on the stage of CVT remains to be studied.
The strengths of our study included that fibrinolysis indicators could be easily assessed on admission, the prediction model may support neurologists in the early detection of acute CVT, and internal validation supported its generalizability. The high discriminative ability indicates the potential of this model for classifying acute CVT patients according to fibrinolysis indicators.
In the current clinical dilemma of choosing between endovascular and anticoagulant therapy, more factors must be considered to guide clinical treatment. Exploring whether selecting different treatment methods based on the time of thrombus formation can improve the prognosis of CVT patients is a direction worthy of exploration. The results of this study provide a reference basis for research in this direction.
This study has several limitations. Firstly, the repeated measurement data of multiple frequencies and over a long period of time in the same patient can more accurately reflect the trend of changes in fibrinolytic indexes after thrombosis, but such repeated measurement data is difficult to obtain in clinical practice and may violate ethical principles, so we can only adopt the protocol in this study. Secondly, this study determined the time of CVT formation based on the onset of clinical symptoms. Still, the onset of clinical symptoms in some patients may not be synchronized with the actual start time of the thrombus. We extracted data in detail to minimize this systematic error. Finally, due to the study's retrospective nature, some data may be missed or misinterpreted.
Conclusion
According to the trend of fibrinolysis index, 14 days of onset can be used as the dividing point of acute and chronic stages of CVT. For patients with unclear onset, the present model, based on admission fibrinogen and D-dimer values, can accurately predict the stage of CVT. The high discriminative ability indicates the potential of this model for classifying the acute patient.
Supplemental Material
sj-docx-1-cat-10.1177_10760296241304777 - Supplemental material for Explore the Staging of Cerebral Venous Thrombosis Through Fibrinolytic Indicators
Supplemental material, sj-docx-1-cat-10.1177_10760296241304777 for Explore the Staging of Cerebral Venous Thrombosis Through Fibrinolytic Indicators by Duo Lan, PhD, Yibing Guo, MD, Xiaoming Zhang, MD, Xiangqian Huang, MD, Da Zhou, PhD, Xunming Ji, MD, PhD, and Ran Meng, MD, PhD in Clinical and Applied Thrombosis/Hemostasis
Footnotes
Acknowledgment
We would like to thank all patients and doctors who participated in this study for their cooperation.
Author Contributions
DL wrote the first draft of the manuscript; DL, XZ, YB, and XH performed the material preparation, data collection, and statistical analysis; DZ, RM, and XJ contributed to imaging assessments; RM wrote sections of the manuscript and contributed to manuscript revision; XJ and RM contributed conception and design of the study; RM takes full responsibility for the data, the analyses and interpretation, and the conduct of the research. All authors read and approved the submitted version.
Data Availability Statement
The data that support the findings of this study are available from the corresponding author upon reasonable request.
Declaration of Conflicting Interests
The authors declared no potential conflicts of interest with respect to the research, authorship, and/or publication of this article.
Ethics Approval and Consent to Participate
The study was approved by the Institutional Ethic Committee of Xuanwu Hospital, Capital Medical University, and was conducted according to the guidelines laid down in the Declaration of Helsinki. Prior to any study procedure, written informed consent was obtained from the participants.
Funding
The authors disclosed receipt of the following financial support for the research, authorship, and/or publication of this article: This work was supported by the National Natural Science Foundation of China, (grant number 82171297, 82101390).
Supplemental Material
Supplemental material for this article is available online.
References
Supplementary Material
Please find the following supplemental material available below.
For Open Access articles published under a Creative Commons License, all supplemental material carries the same license as the article it is associated with.
For non-Open Access articles published, all supplemental material carries a non-exclusive license, and permission requests for re-use of supplemental material or any part of supplemental material shall be sent directly to the copyright owner as specified in the copyright notice associated with the article.