
Abstract
Background
Acute heart failure (AHF) carries a grave prognosis, marked by high readmission and mortality rates within 90 days post-discharge. This underscores the urgent need for enhanced care transitions, early monitoring, and precise interventions for at-risk individuals during this critical period.
Objective
Our study aims to develop and validate an interpretable machine learning (ML) model that integrates peripheral immune cell data with conventional clinical markers. Our goal is to accurately predict 90-day readmission or mortality in patients AHF.
Methods
In our study, we conducted a retrospective analysis on 1210 AHF patients, segregating them into training and external validation cohorts. Patients were categorized based on their 90-day outcomes post-discharge into groups of ‘with readmission/mortality’ and ‘without readmission/mortality’. We developed various ML models using data from peripheral immune cells, traditional clinical indicators, or both, which were then internally validated. The feature importance of the most promising model was examined through the Shapley Additive Explanations (SHAP) method, culminating in external validation.
Results
In our cohort of 1210 patients, 28.4% (344) faced readmission or mortality within 90 days post-discharge. Our study pinpointed 10 significant indicators—spanning peripheral immune cells and traditional clinical metrics—that predict these outcomes, with the support vector machine (SVM) model showing superior performance. SHAP analysis further distilled these predictors to five key determinants, including three clinical indicators and two immune cell types, essential for assessing 90-day readmission or mortality risks.
Conclusion
Our analysis identified the SVM model, which merges traditional clinical indicators and peripheral immune cells, as the most effective for predicting 90-day readmission or mortality in AHF patients. This innovative approach promises to refine risk assessment and enable more targeted interventions for at-risk individuals through continuous improvement.
Introduction
Heart failure (HF) poses a significant global health issue, affecting over 26 million individuals. 1 Despite significant advancements in treating chronic heart failure, acute heart failure (AHF) continues to carry a grim prognosis. The post-discharge phase following an initial AHF hospitalization is crucial, with about one-quarter of patients at risk of readmission and a 10% higher mortality rate within 30 days.2,3 This risk persists, remaining elevated for up to 90 days, indicating an extended period of patient vulnerability. 3 According to a study by Khan MS et al, 18% of AHF patients were readmitted within 30 days, with this figure rising to 31% within 90 days. 4 Considering the substantial economic burden and the opportunity for targeted interventions among high-risk patients, there is a critical need to identify individuals at a higher risk of readmission or mortality early post-discharge, thus extending the monitoring and intervention period well beyond the initial 30 days to cover the first 90 days.
Recent research has utilized traditional clinical factors, including age, albumin, and body mass index (BMI), to predict the risk of readmission or death in AHF patients.5,6 While valuable, these indicators fail to encapsulate the full spectrum of predictive data available from patients. Some studies have shown that specific peripheral immune cells, such as classical monocytes (CD14++CD16-), contribute to myocardial inflammation, whereas natural killer (NK) cells play a role in its regulation.7,8 Furthermore, recent findings indicate a correlation between an increase in peripheral neutrophils and a decrease in CD4+ T cells with the progression of AHF.9–11 Given these insights, we propose that peripheral immune cells could serve as significant predictors of 90-day readmission or mortality in patients with AHF, suggesting a nuanced approach to understanding and managing this condition.
The widespread adoption of electronic medical records (EMRs) in clinical research underscores the necessity of leveraging EMRs over traditional clinical trial data for predicting HF prognosis. 12 The complex and often nonlinear relationships between voluminous medical data and clinical outcomes pose a significant analytical challenge, diminishing the efficacy of linear models like logistic regression (Logit) for precise prediction. With the advent of artificial intelligence, machine learning (ML) has increasingly been applied to construct cardiovascular disease prediction models. 13 ML's exceptional ability to identify complex patterns within large, intricate datasets makes it indispensable for developing effective predictive models. 14 Therefore, ML stands out as a crucial tool for enhancing the accuracy of 90-day readmission or mortality predictions in AHF patients, marking a shift towards more sophisticated analysis techniques in medical research.
In light of this context, our study seeks to develop and validate an interpretable ML model that combines data on peripheral immune cells with traditional clinical indicators. Our objective is to predict 90-day readmission or mortality among AHF patients. Early identification of patients at high risk for these outcomes is crucial for timely intervention and providing them with the necessary support.
Methods
Ethics Approval
This retrospective, single-center study was conducted in accordance with the Declaration of Helsinki principles and received approval from the Ethics Committee of Shuyang Hospital of Traditional Chinese Medicine (No. 2024005). Informed consent was obtained from all participants or their relatives.
Patient Selection
From October 2022 to December 2023, we screened 5912 hospitalization records from the Department of Cardiology at Shuyang Hospital of Traditional Chinese Medicine for study inclusion. The inclusion criteria included: (1) patients aged ≥18 years; (2) initial diagnosis of AHF at admission; (3) survival until discharge. Exclusion criteria encompassed: (1) previous major organ transplant; (2) pregnancy; (3) incomplete or missing medical records; (4) patients with active infections, systemic diseases, or cancer. Following meticulous screening, we included 1210 AHF patients in our study cohort. To bolster the predictive model's reliability, we divided the cohort randomly into training and external verification groups at a 7:3 ratio. The primary outcome combined AHF readmission or all-cause mortality within 90 days of discharge from the initial AHF hospitalization.
Data Collection
We thoroughly reviewed each patient's EMRs, systematically gathering anthropometric measurements and laboratory investigation results. Traditional clinical parameters and peripheral immune cell counts were documented upon the patient's initial hospital admission within 24 h. All laboratory indicators, including peripheral immune cells, were derived from data first tested within 24 h of admission. Peripheral blood immune cells were analyzed using flow cytometry in a whole-blood assay. This process involved 100 µl of blood and was completed within 8 h of collecting the sample.
Data Preprocessing
Before developing a prediction model, a crucial data preprocessing phase was conducted to guarantee the fairness of the process. This phase included normalizing all data, which encompassed traditional clinical parameters as well as peripheral immune cells. The normalization technique varied according to the variable type. For continuous variables, we applied Z-score normalization to adjust them to a scale where the mean is zero and the standard deviation is one. Meanwhile, categorical variables were converted into binary format, receiving values of either “0” or “1”.
Derivation and Internal Validation of ML Models
To assess the risk of 90-day readmission or mortality in AHF patients, we utilized four recognized ML classifiers: Logit, Random Forest (RF), Support Vector Machine (SVM), and Extreme Gradient Boosting (XGBoost). We developed prediction models based on traditional clinical parameters, peripheral immune cells, and a combination of both, serving as distinct analytical foundations. In the model training phase, we implemented a triple-repeated five-fold cross-validation strategy. This approach maximized the utility of the training set by segmenting it into inner training and test datasets. It systematically cycled through each subset for testing purposes, while utilizing the remaining data for training. For the RF classifier, we selected a configuration of 500 trees, setting the number of features for node splitting to the square root of the total number of features. In the case of the SVM, we chose a radial basis function (RBF) kernel for its effectiveness with non-linear data. We meticulously tuned hyperparameters, optimizing the SVM cost parameter through a grid search over [0.1, 1, 10], and similarly determining the gamma parameter for the RBF kernel within [0.001, 0.01, 0.1]. For the XGBoost classifier, parameters were carefully chosen following a grid search to strike a balance between model complexity and predictive accuracy. These included a learning rate of 0.02, a maximum tree depth of 4, and an ensemble of 600 trees.
After model development, each underwent thorough internal validation, assessing discrimination, calibration, and clinical utility. The selection of the optimal model was based on its superior ability to discriminate, combined with robust calibration and practical clinical value.
Interpretability and External Validation of ML Models
Upon identifying the optimal predictive models, our next step was to uncover the individual contribution of each variable to the prediction. We incorporated the SHAP (Shapley Additive Explanation) methodology to gain a deeper understanding of feature importance, emphasizing the variables with the most significant impact. Features were ranked by their SHAP values in descending order, pinpointing the most crucial predictors within our patient cohort. 15 Additionally, to confirm the robustness of our models, we conducted external validation. This meticulous assessment verified their discriminative power, calibration, and clinical relevance, offering a detailed insight into the predictive performance of these models.
Statistical Analysis
We utilized a tailored statistical approach based on data type. The chi-square test was applied to categorical variables, while the Shapiro-Wilk test initially assessed the distribution of continuous variables, guiding the use of either the Mann–Whitney U test or the independent-sample t-test. To evaluate model performance, receiver operating characteristic (ROC) curve analysis, including area under the curve (AUC), Precision, Recall, and F1 Score metrics, was used to thoroughly examine discrimination capability. AUC comparisons utilized Delong's test. We also assessed model fit using calibration curve analysis and the Brier Score for the precision of probability predictions. Decision Curve Analysis (DCA) was implemented to highlight the models’ clinical value by estimating net benefits across various threshold probabilities. Statistical analyses were performed using IBM SPSS Statistics (v 22.0) and Python (v 3.7.1).
Result
Patient Characteristics
Figure 1 outlines the patient selection process, along with the development and validation phases of our model. We meticulously applied inclusion and exclusion criteria to assemble a cohort of 1210 patients, dividing them into 847 for training and 363 for external validation. The incidence of 90-day readmission or mortality was comparably observed in both groups—28.1% (238/847) in the training cohort and 29.2% (106/363) in the external verification cohort, showing no statistically significant variation (χ2 = 0.156, P = 0.698). Table 1 supports these observations, revealing uniform distributions of traditional clinical parameters and peripheral immune cells across the cohorts, without any notable differences (all P > 0.05).
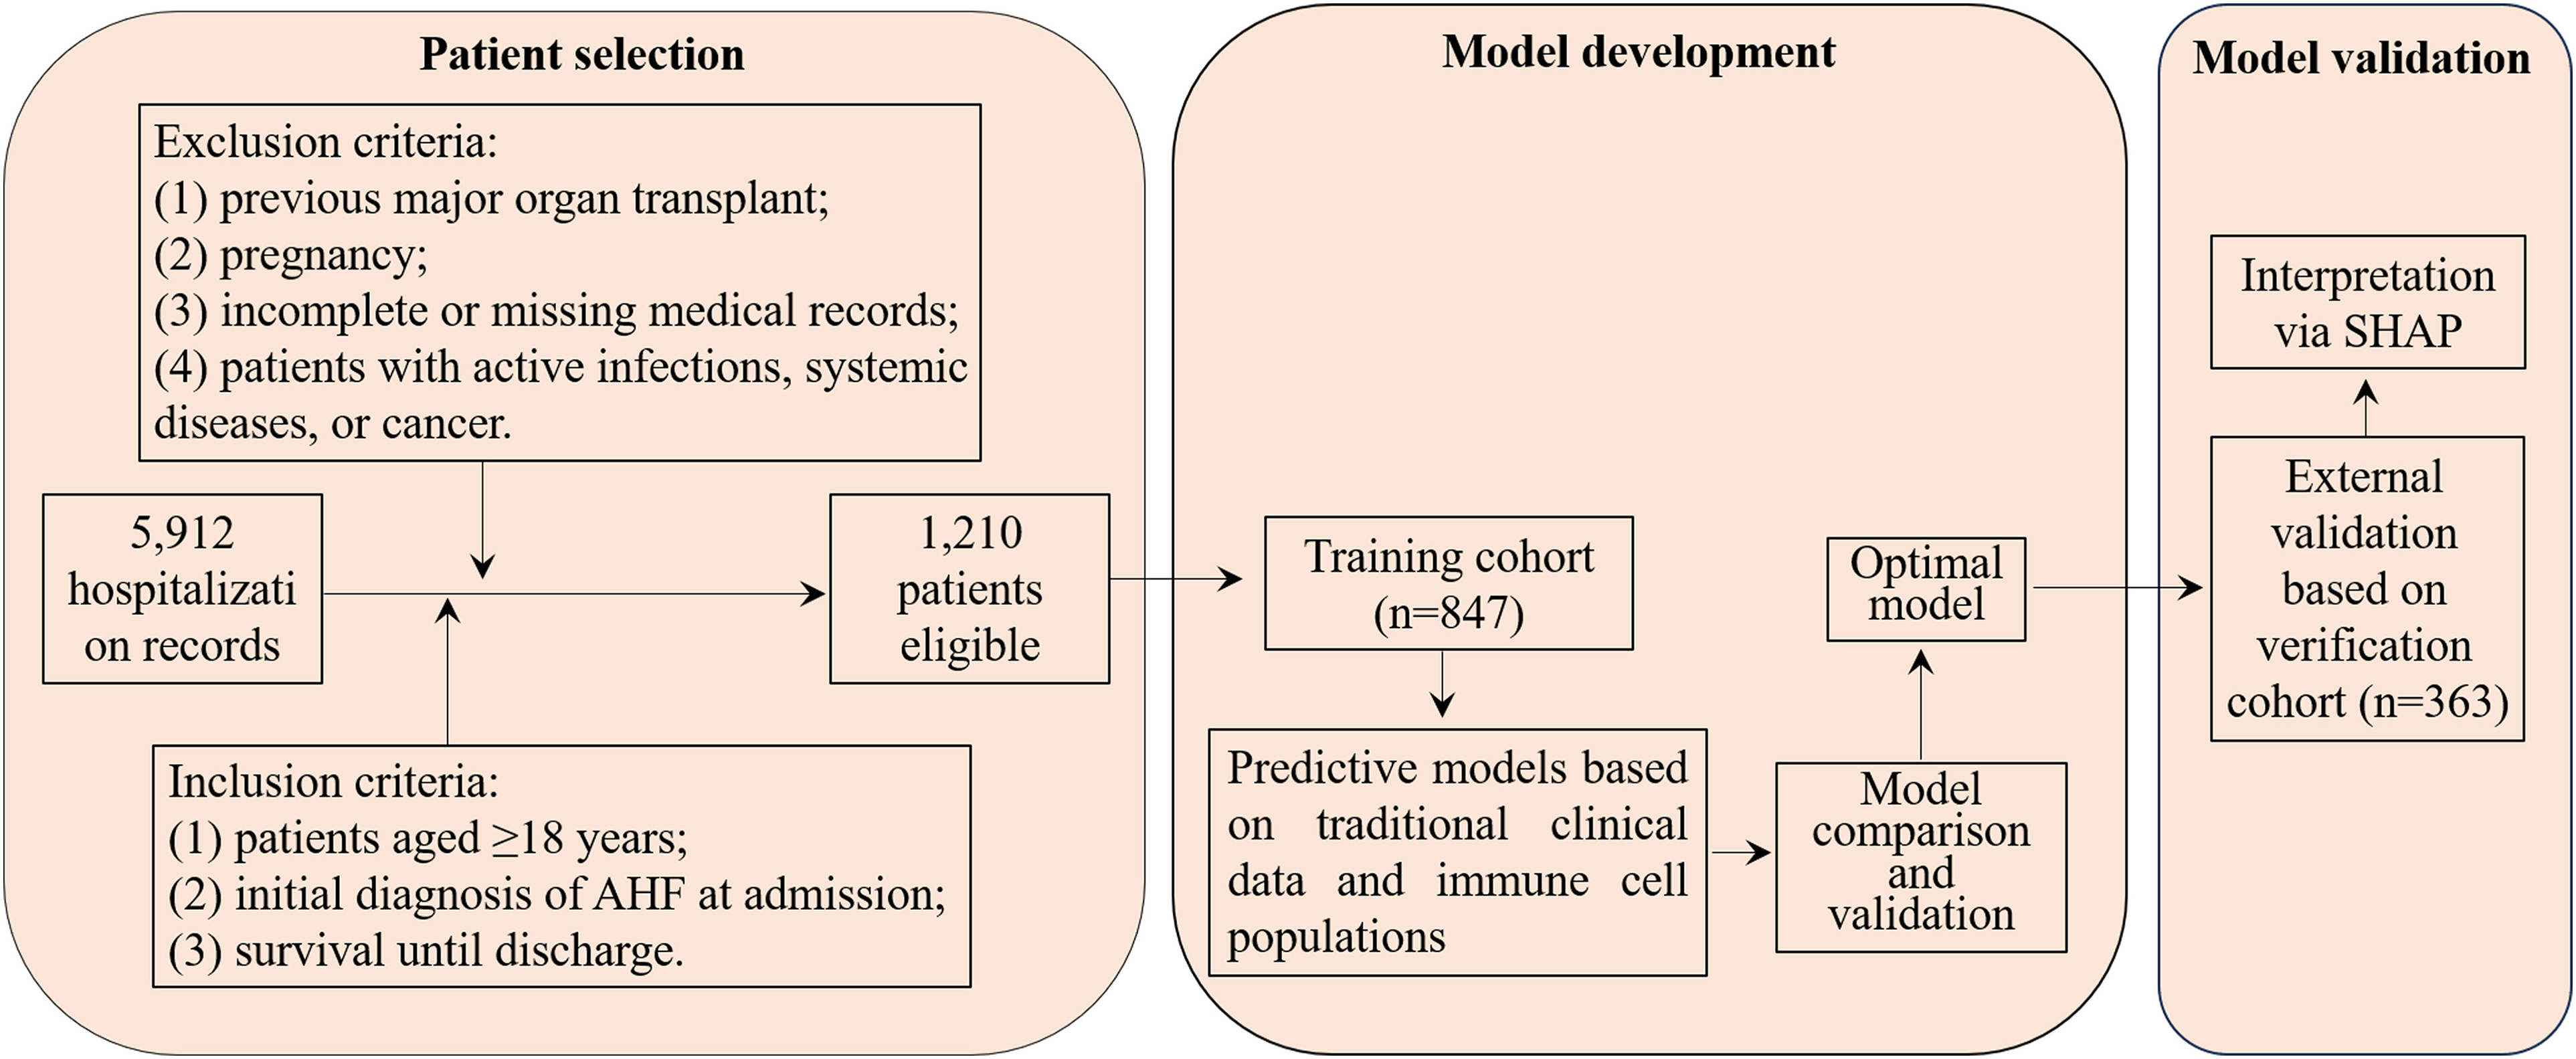
Flowchart of patient selection and cohort distribution for developing and validating predictive models in AHF patients.
Comparative Analysis of Traditional Clinical Parameters and Peripheral Immune Cells Across Training and External Validation Cohorts.
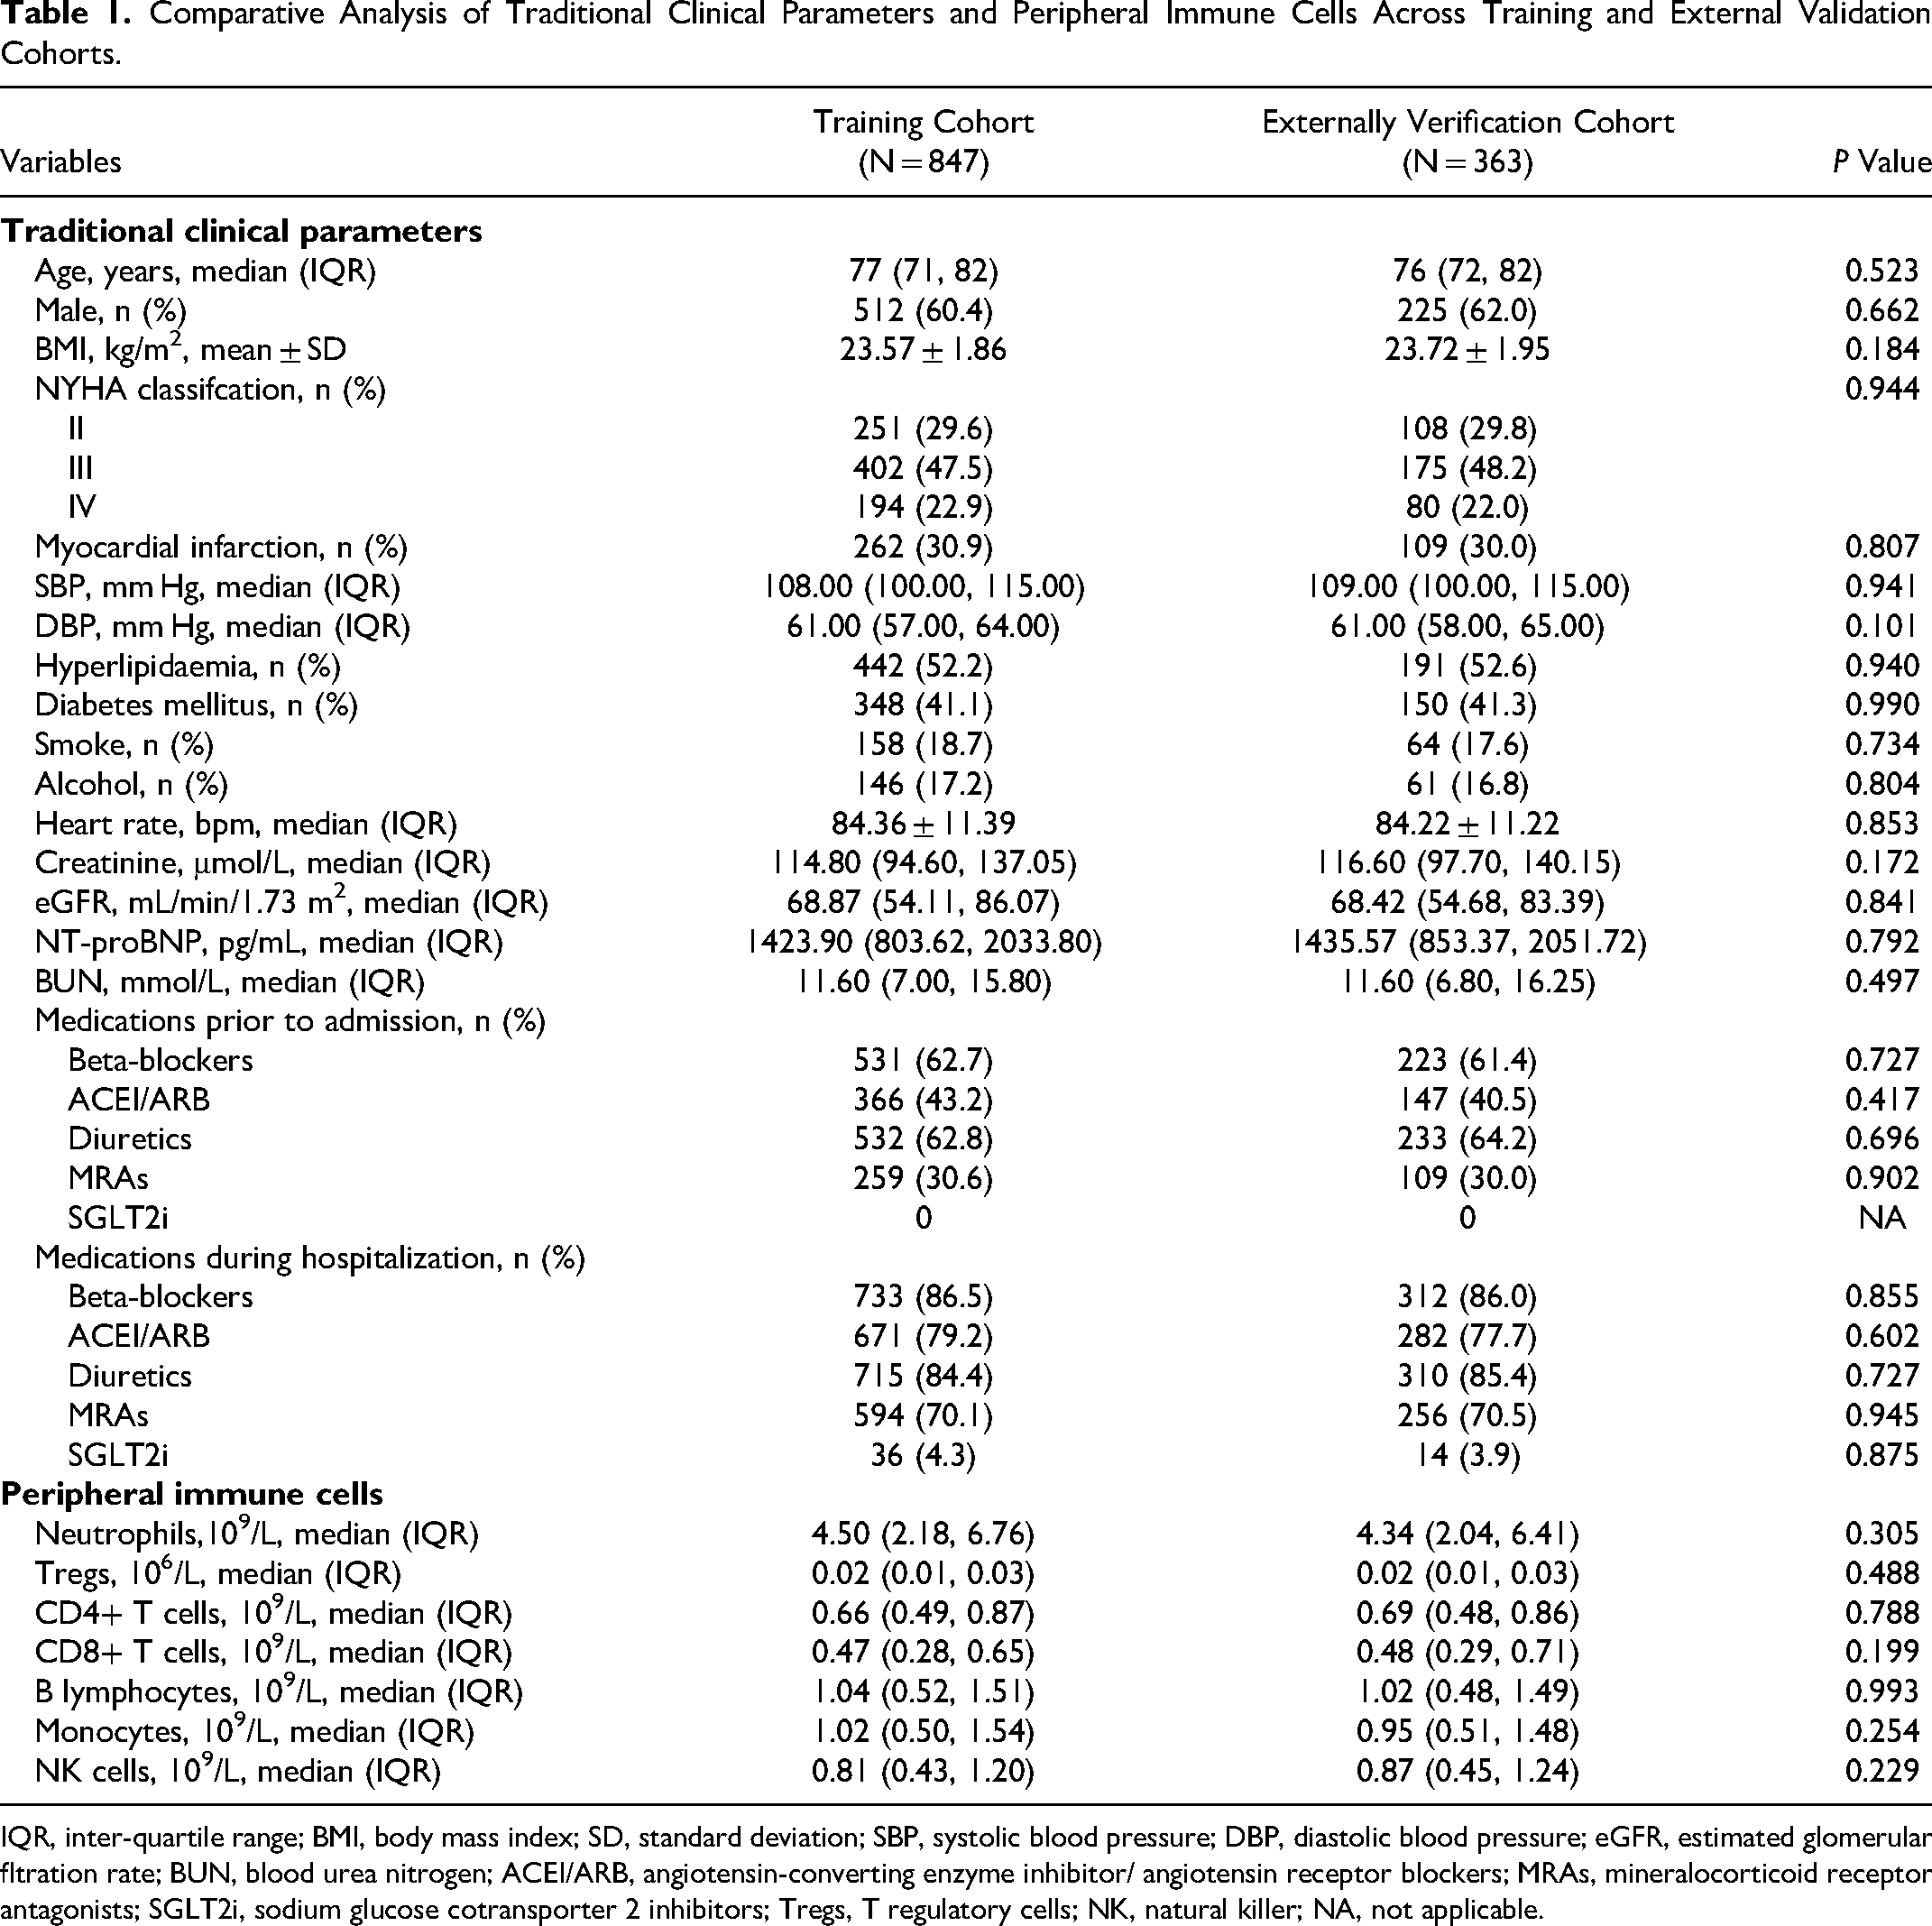
IQR, inter-quartile range; BMI, body mass index; SD, standard deviation; SBP, systolic blood pressure; DBP, diastolic blood pressure; eGFR, estimated glomerular fltration rate; BUN, blood urea nitrogen; ACEI/ARB, angiotensin-converting enzyme inhibitor/ angiotensin receptor blockers; MRAs, mineralocorticoid receptor antagonists; SGLT2i, sodium glucose cotransporter 2 inhibitors; Tregs, T regulatory cells; NK, natural killer; NA, not applicable.
Comparing Traditional Clinical Factors and Peripheral Immune Cells in Patients with and Without 90-day Readmission/Mortality in the Training Cohort
Table 2 contrasts traditional clinical indicators and peripheral immune cell levels between patients with 90-day readmission/mortality and those without in the training cohort. Findings indicate that patients facing 90-day readmission/mortality were characterized by older age, higher NYHA classifications, reduced systolic and diastolic blood pressures, increased creatinine levels, decreased estimated glomerular filtration rate (eGFR), elevated NT-proBNP and blood urea nitrogen (BUN) levels, alongside an increase in neutrophils and a reduction in CD4+ T cells (all P values < 0.05). The key parameters were standardized via Z-score normalization to a mean of zero and a standard deviation of one. This standardization facilitated their documentation and integration into the development of ML prediction models, streamlining the process for enhanced predictive performance.
Comparative Analysis of Traditional Clinical Parameters and Peripheral Immune Cells in AHF Patients Based on 90-day Readmission or Mortality.
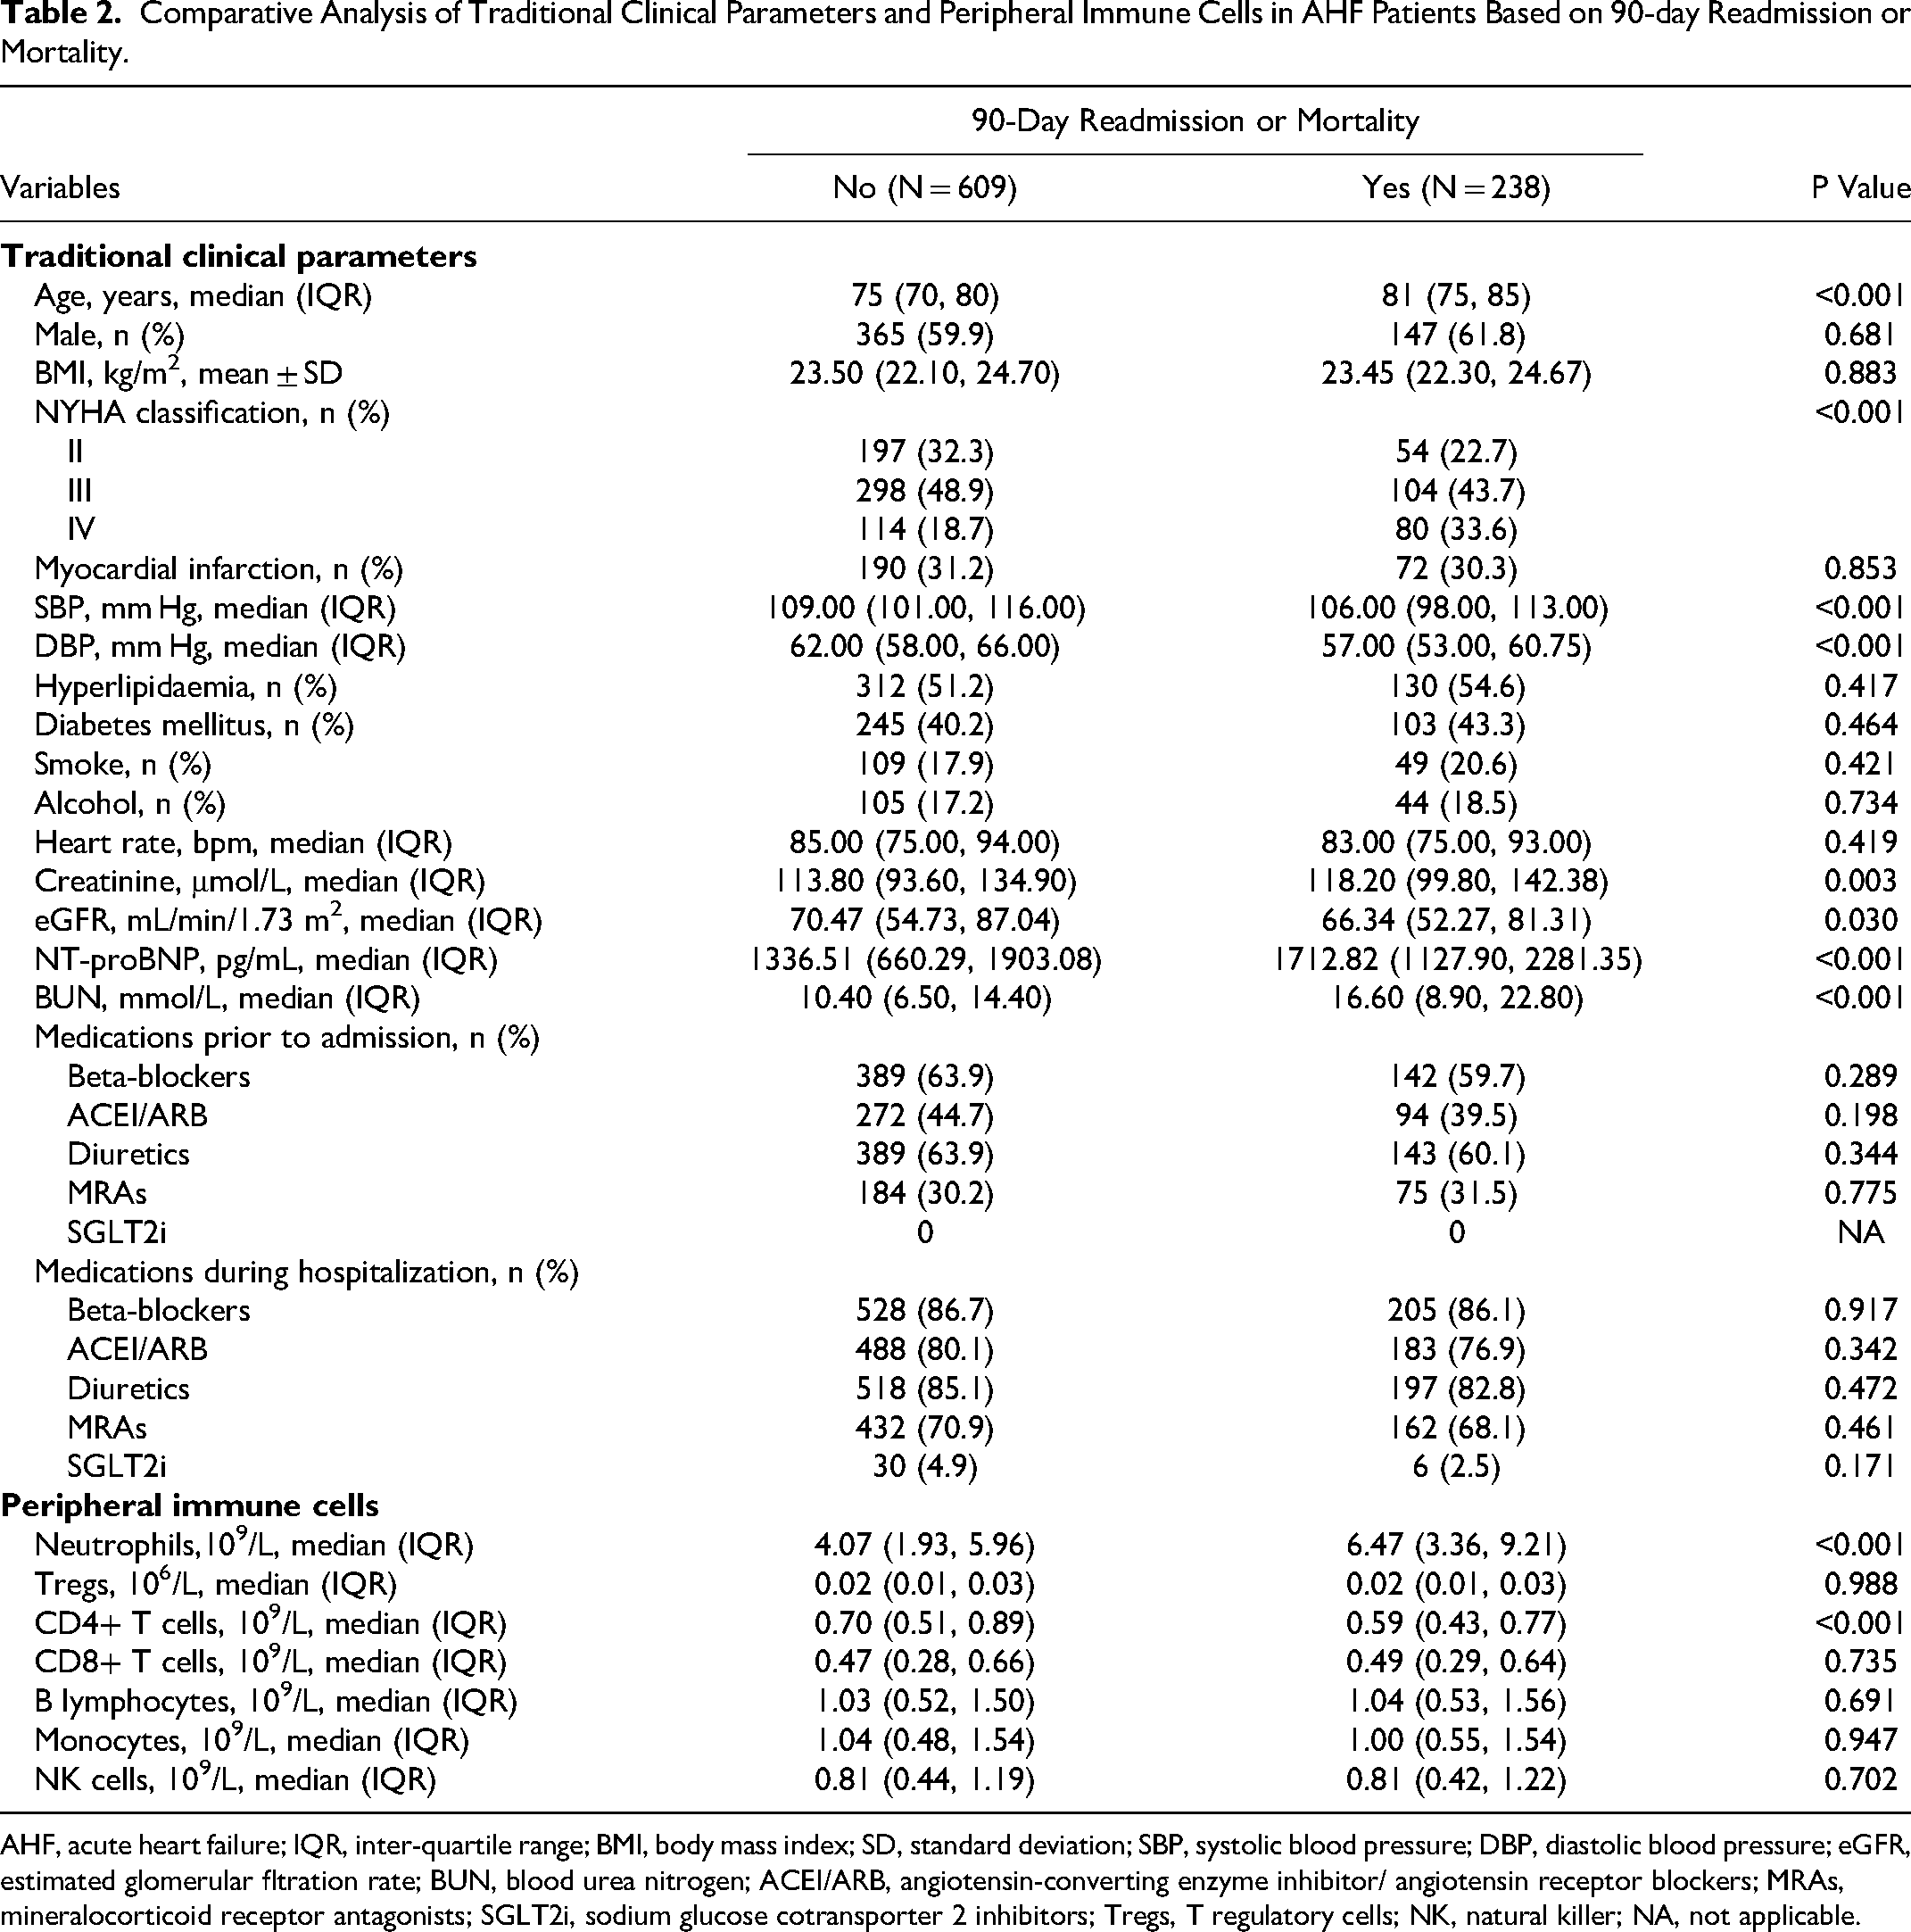
AHF, acute heart failure; IQR, inter-quartile range; BMI, body mass index; SD, standard deviation; SBP, systolic blood pressure; DBP, diastolic blood pressure; eGFR, estimated glomerular fltration rate; BUN, blood urea nitrogen; ACEI/ARB, angiotensin-converting enzyme inhibitor/ angiotensin receptor blockers; MRAs, mineralocorticoid receptor antagonists; SGLT2i, sodium glucose cotransporter 2 inhibitors; Tregs, T regulatory cells; NK, natural killer; NA, not applicable.
Comparing Models for Predicting 90-day Readmission/Mortality Risk
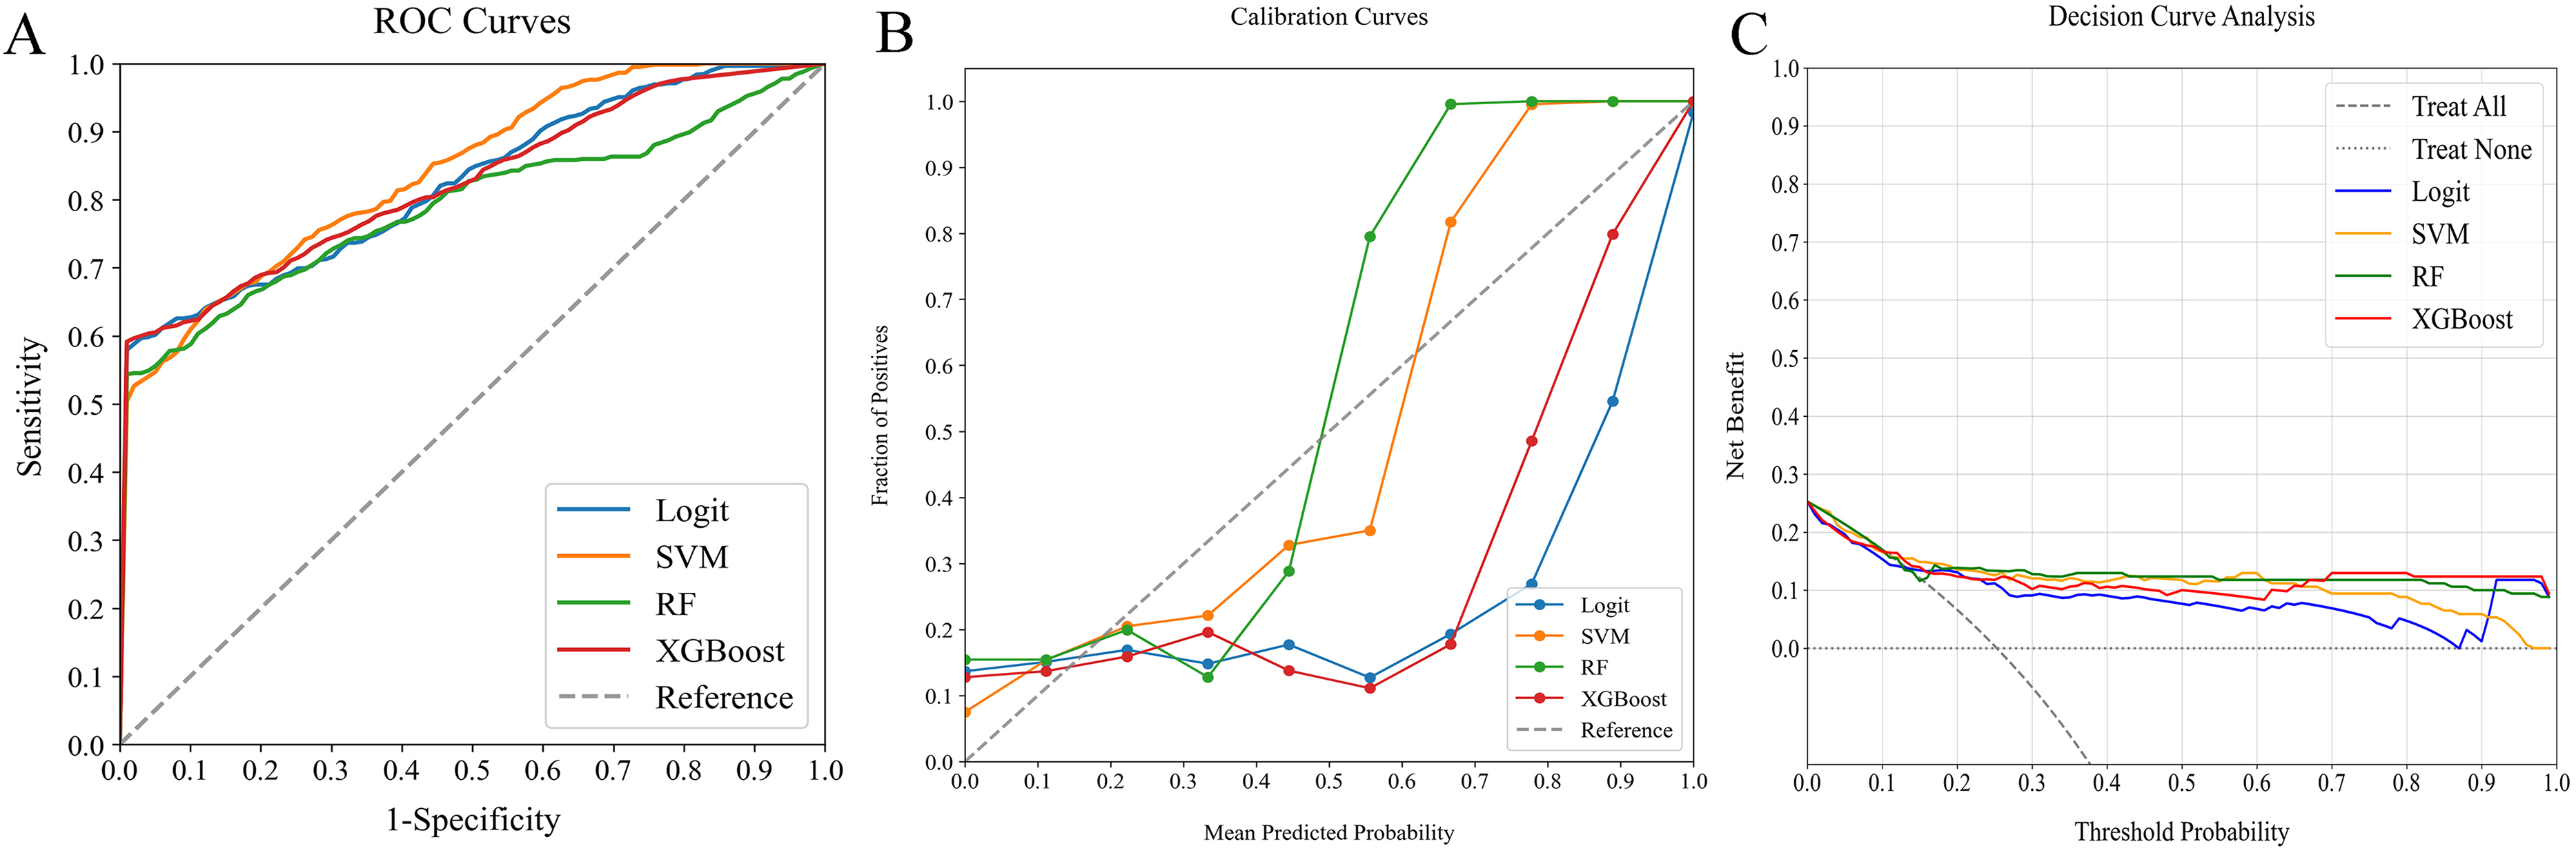
In our detailed study on predictive models for 90-day readmission or mortality among AHF patients, we evaluated four ML classifiers: Logit, SVM, RF, and XGBoost. These were tested across three categories: traditional clinical indicators, peripheral immune cells, and a combination of both. The comparative performance of these models is outlined in Table 3, while Figures 2–4 illustrate the ROC curves, calibration plots, and DCA. Our analysis revealed that the combined models (AUC: 0.728-0.948) demonstrated superior discrimination compared to models based solely on traditional clinical indicators (AUC: 0.675-0.807) or peripheral immune cells (AUC: 0.789-0.841), confirmed by Delong's test (P < 0.05).
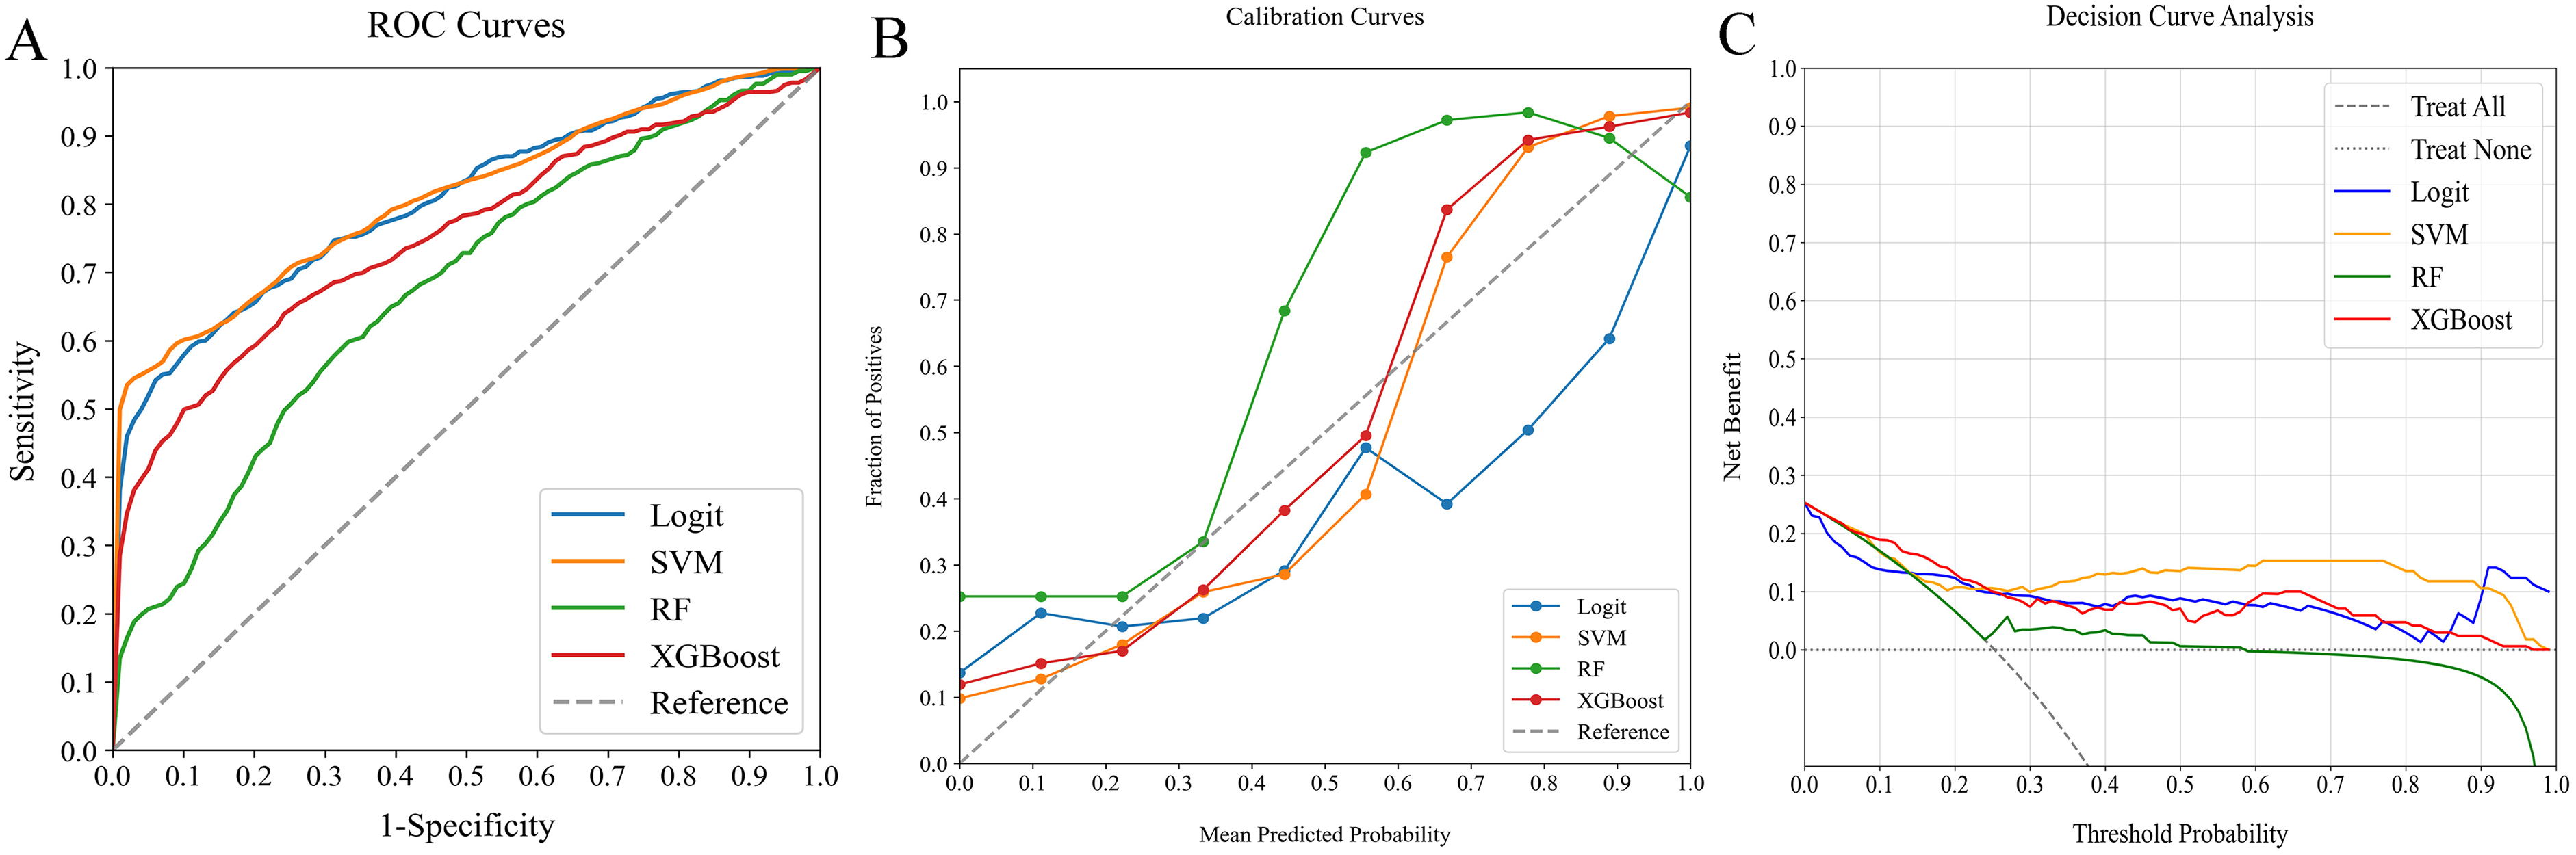
Comparative analysis of ML classifiers-namely Logit, SVM, RF, and XGBoost - on traditional clinical data, detailing their performance through (A) ROC curves, (B) calibration plots, and (C) DCA. They achieved ROC-AUCs of 0.804, 0.807, 0.675, and 0.752, respectively. ML, machine learning; ROC, receiver operating characteristic; AUC, area under the curve; DCA, decision curve analysis; Logit, logistic regression; SVM, support vector machine; RF, random forest; XGBoost, extreme gradient boosting.
Comparative analysis of ML classifiers-namely Logit, SVM, RF, and XGBoost - using peripheral immune cells, as illustrated through (A) ROC curves, (B) calibration plots, and (C) DCA. They yielded AUCs of 0.823, 0.841, 0.789, and 0.822, respectively. ML, machine learning; ROC, receiver operating characteristic; AUC, area under the curve; DCA, decision curve analysis; Logit, logistic regression; SVM, support vector machine; RF, random forest; XGBoost, extreme gradient boosting.
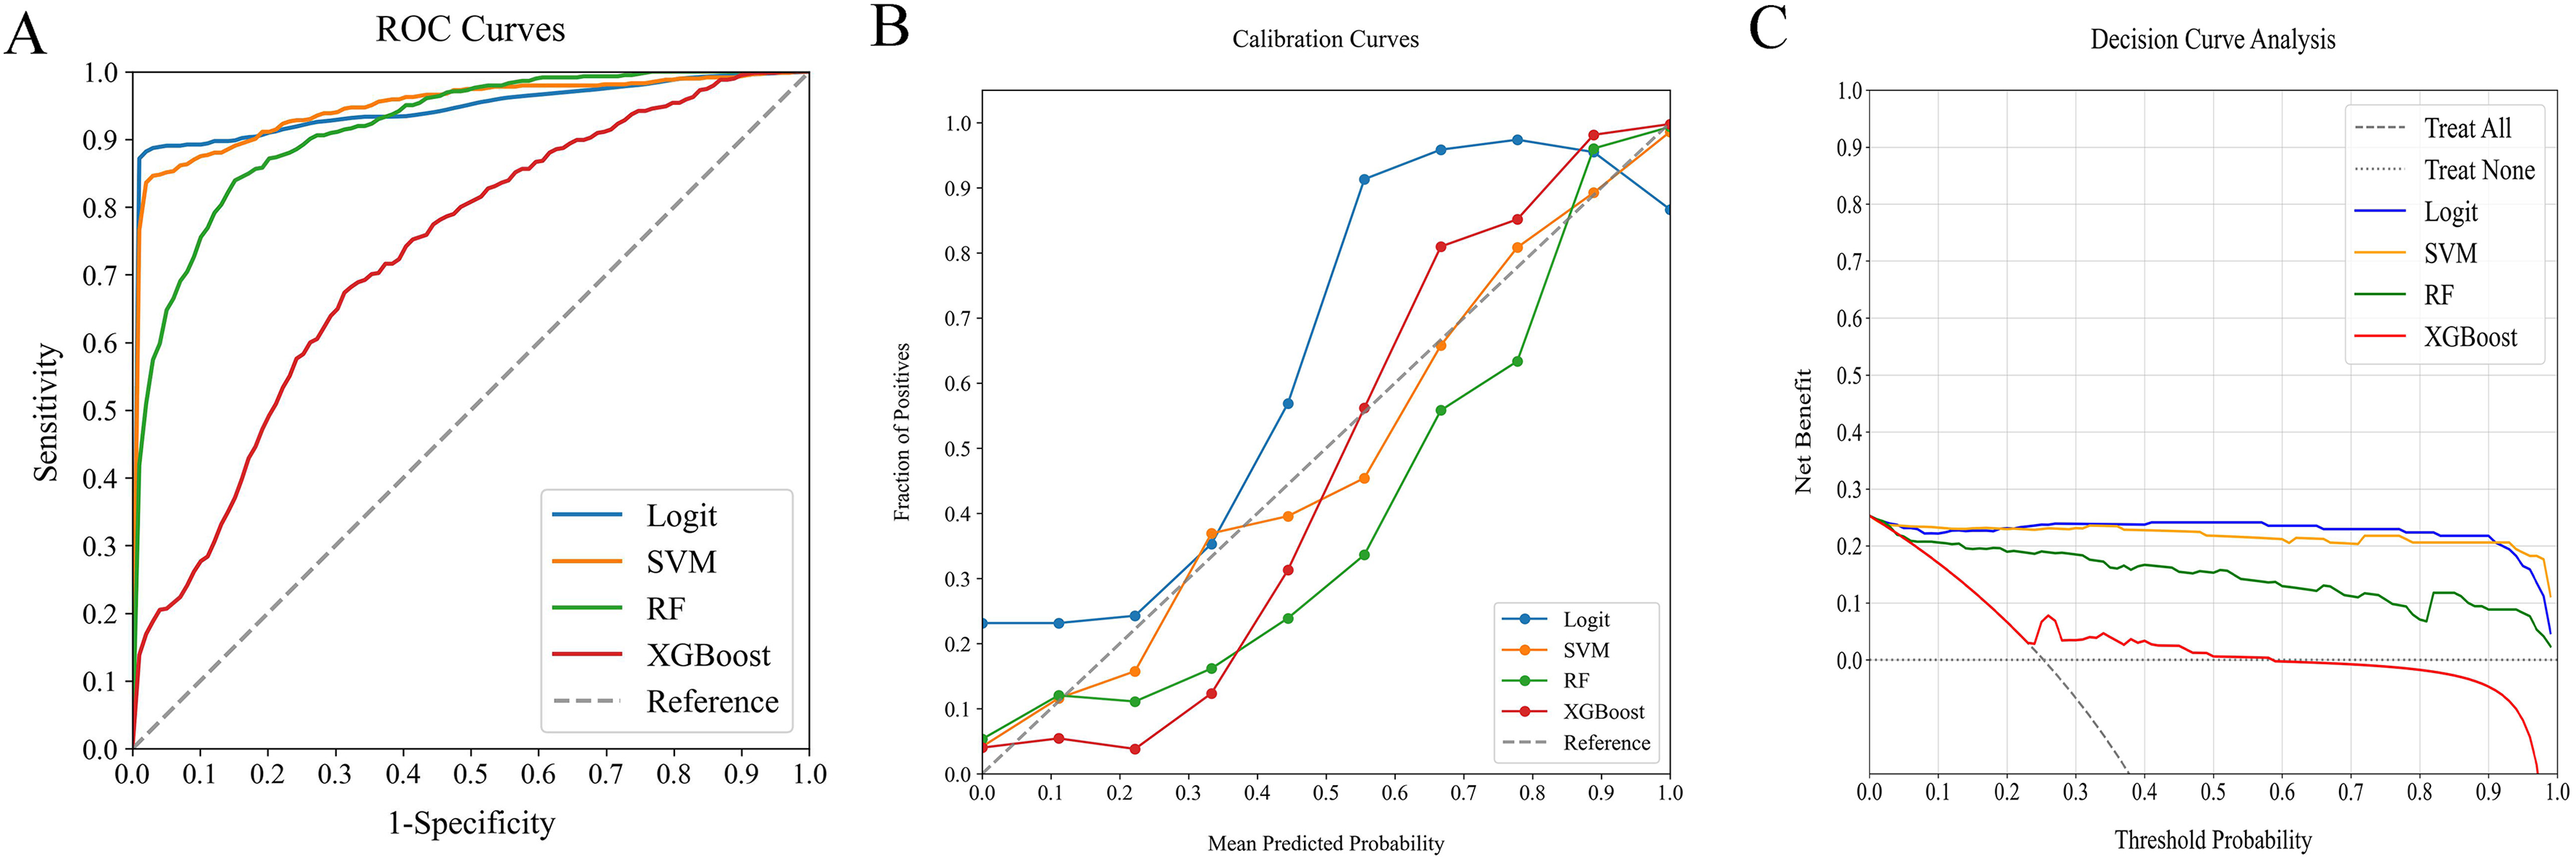
Comparative analysis of ML classifiers-namely Logit, SVM, RF, and XGBoost on combined traditional clinical data and peripheral immune cells, as demonstrated through (A) ROC curves, (B) calibration plots, and (C) DCA. They achieved AUCs of 0.946, 0.948, 0.912, and 0.728, respectively. ML, machine learning; ROC, receiver operating characteristic; AUC, area under the curve; DCA, decision curve analysis; Logit, logistic regression; SVM, support vector machine; RF, random forest; XGBoost, extreme gradient boosting.
Performance of ML Classifiers for Predicting 90-day Readmission or Mortality Using Traditional Clinical Parameters, Peripheral Immune Cells, and Combined Datasets in AHF Patients.
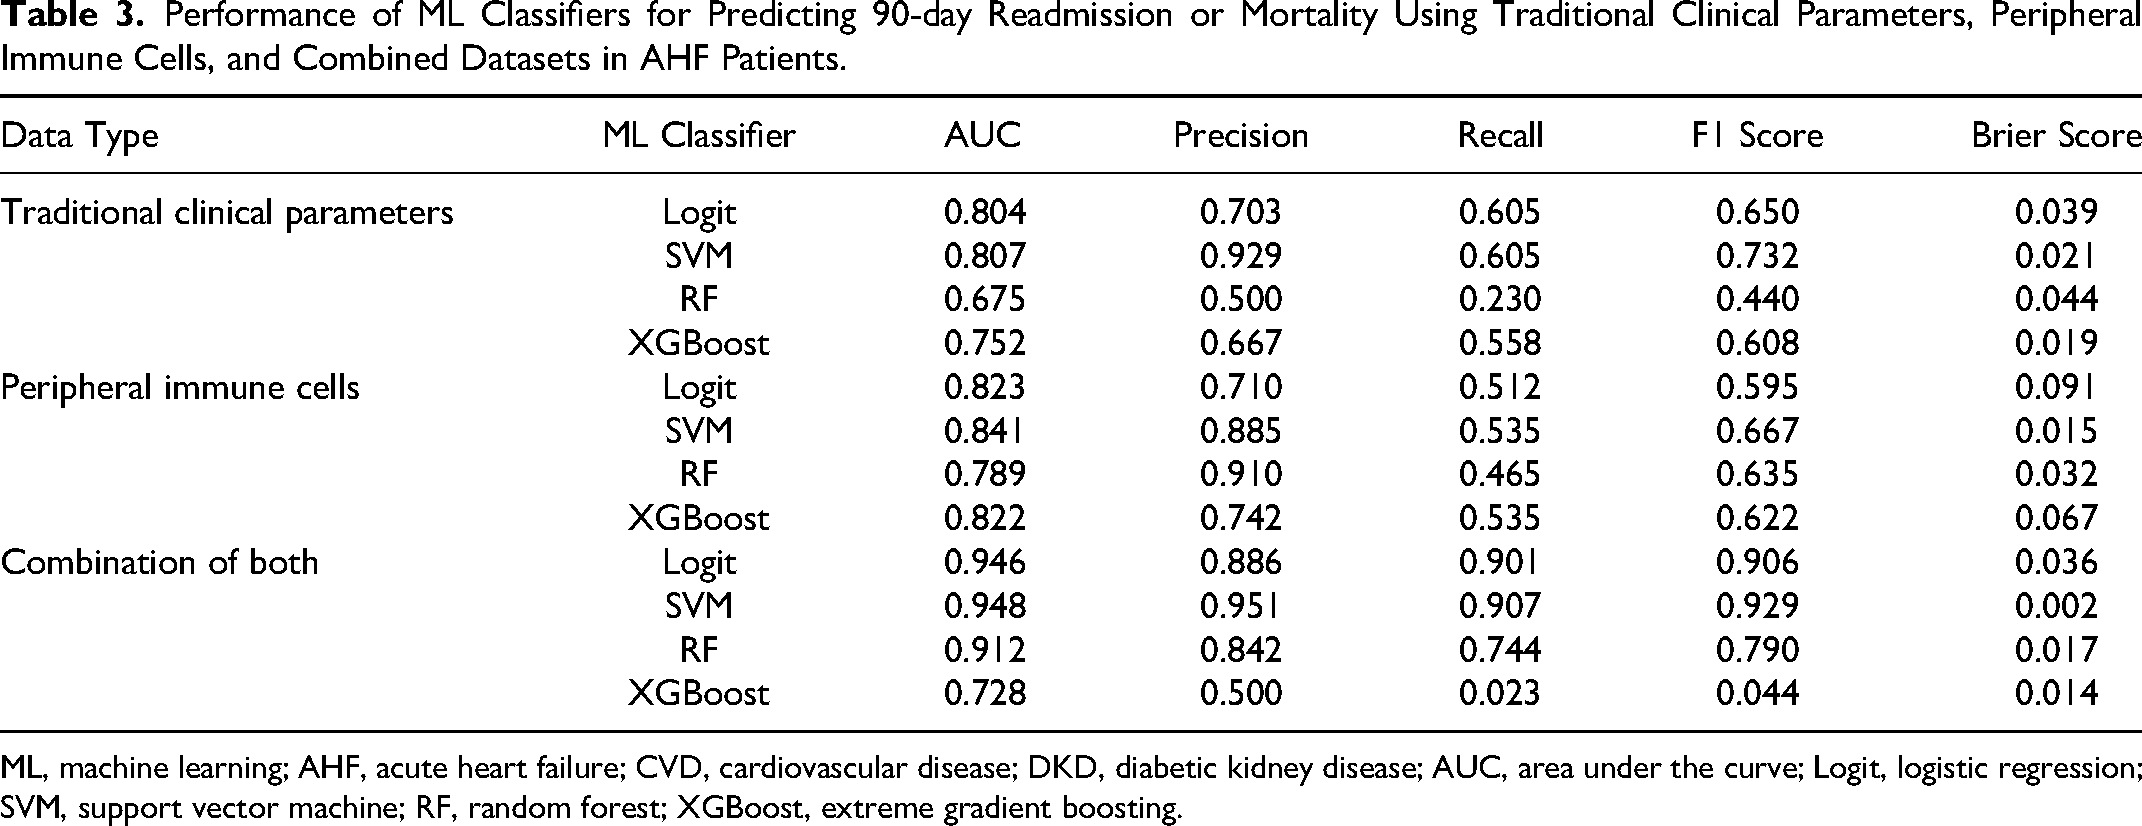
ML, machine learning; AHF, acute heart failure; CVD, cardiovascular disease; DKD, diabetic kidney disease; AUC, area under the curve; Logit, logistic regression; SVM, support vector machine; RF, random forest; XGBoost, extreme gradient boosting.
Among the models incorporating traditional clinical indicators and peripheral immune cells, Logit and SVM achieved the highest AUC scores of 0.946 and 0.948, respectively. However, SVM showed better calibration, as Logit models tended to underestimate probabilities near the 55% range. Both models performed similarly in DCA, but SVM's balanced performance across key metrics such as Precision, Recall, F1 Score, and Brier Score solidified its status as the preferred classifier for predicting 90-day readmission or mortality risk.
Assessing ML Model with the External Verification Cohort
The external verification cohort served to assess the SVM model's predictive accuracy regarding actual 90-day readmission or mortality outcomes, using ROC, calibration, and DCA analyses (Figure 5). Despite a slight performance decrease compared to the training cohort, the SVM model still demonstrated substantial discriminative ability, achieving an AUC of 0.888 (Figure 5A). Its calibration curve showed a high concordance between predicted risks and observed frequencies, notably for predictions exceeding 75% (Figure 5B). Moreover, the DCA curve validated the model's efficiency, demonstrating significant net benefits (Figure 5C). These results highlight the SVM model's efficacy as a predictive instrument for 90-day readmission or mortality risk, confirming its clinical utility.
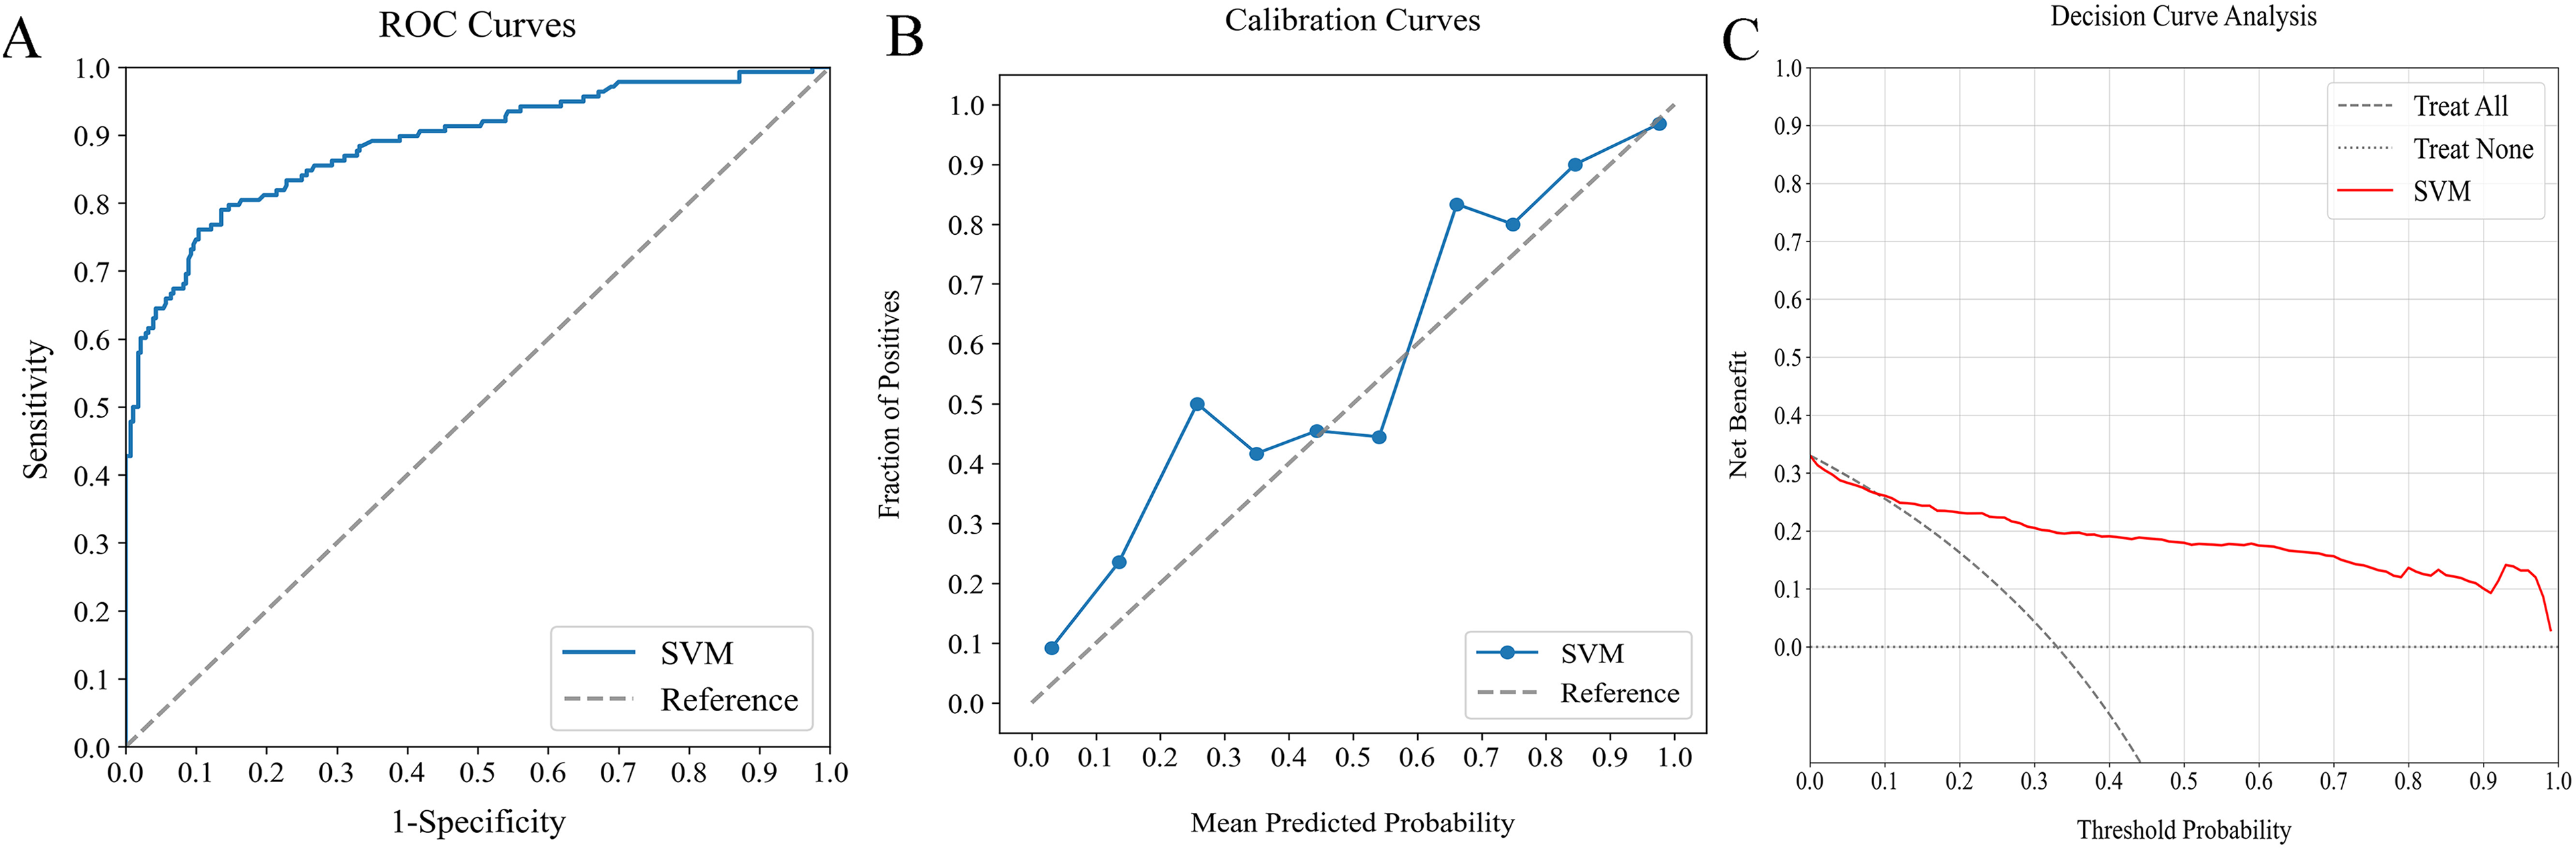
Assessment of optimal ML model's predictive performance using external verification cohort: (A) ROC curve (AUC = 0.888), (B) calibration curve, and (D) DCA. ML, machine learning; ROC, receiver operating characteristic; AUC, area under the curve; DCA, decision curve analysis.
Interpretation of the Model
SHAP analysis was used to decode the SVM model by quantifying each feature's impact. By calculating absolute mean SHAP values, features were ranked in terms of importance, identifying three traditional clinical indicators and two peripheral immune cells as the top five contributors (Figure 6A). A summary plot visualizing the cumulative impact of each feature via SHAP values was created for clearer insight (Figure 6B). This visualization offered an in-depth view of how individual features influenced predictions for each patient. Notably, higher values of these leading five features were associated with increased 90-day readmission or mortality risk in AHF patients.
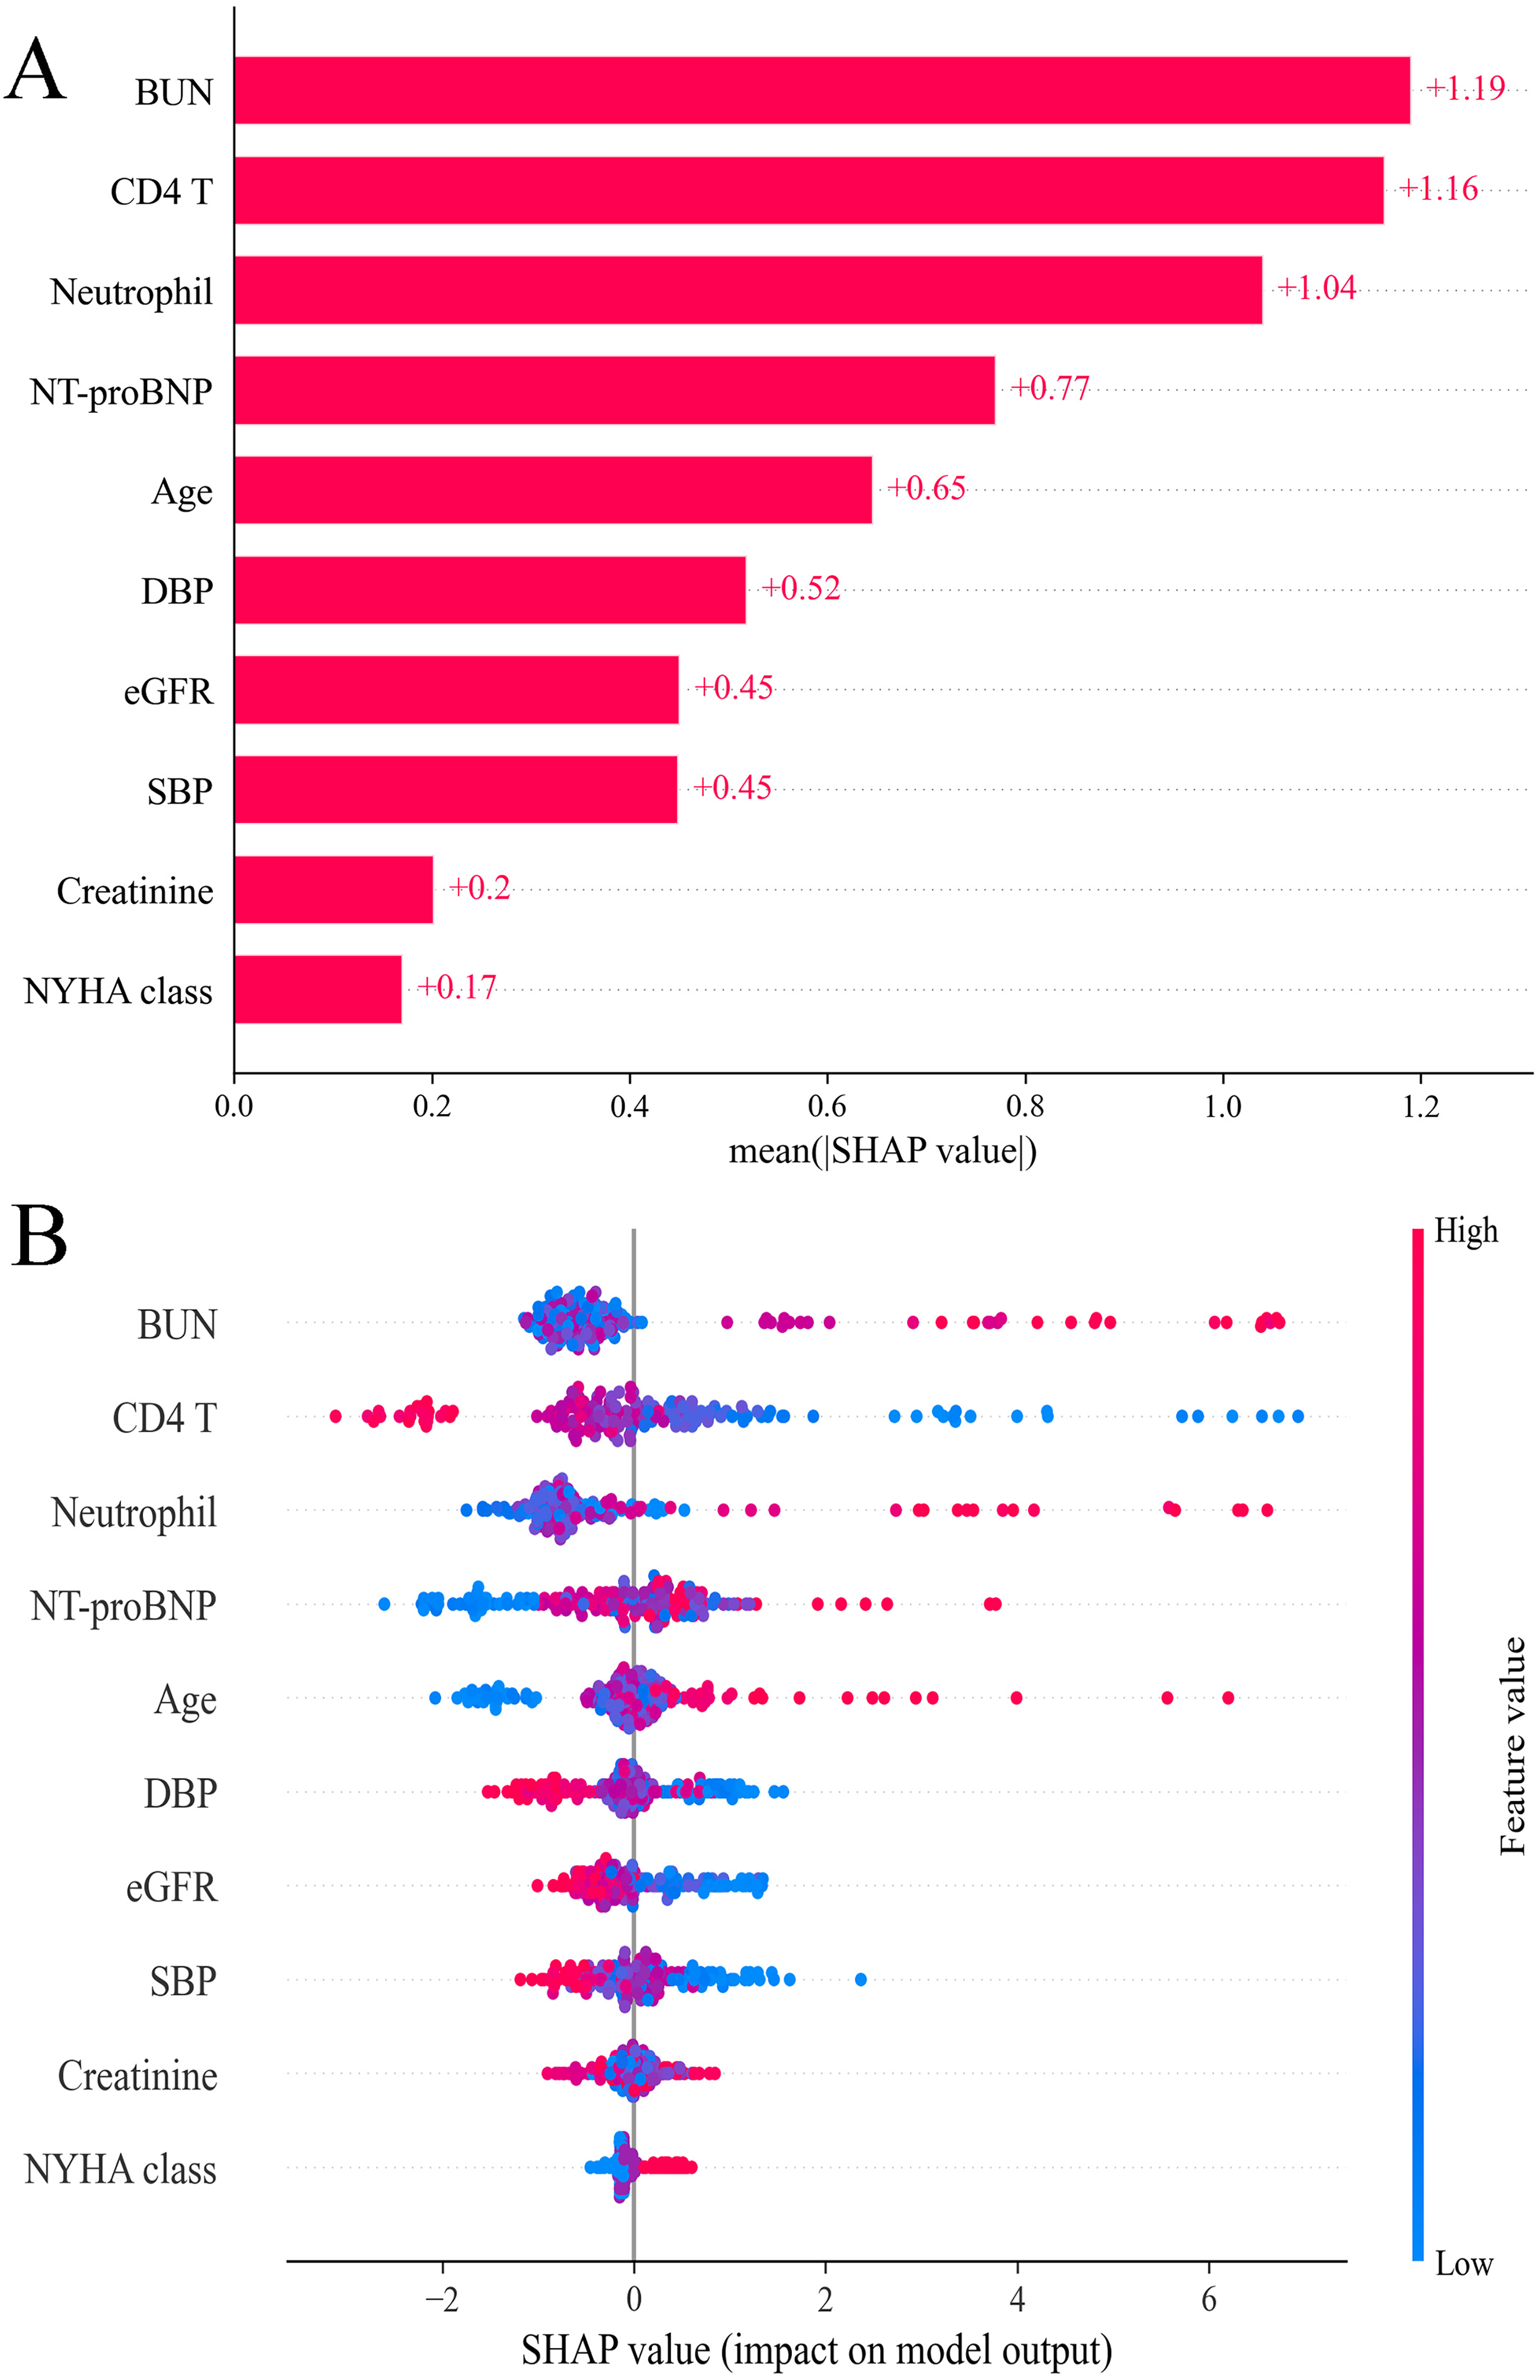
SHAP analysis of SVM model for predicting 90-day readmission or mortality: (A) feature importance ranking and (B) summary plot. SHAP, shapley additive explanations; SVM, support vector machine; BUN, blood urea nitrogen; SBP, systolic blood pressure; DBP, diastolic blood pressure; eGFR estimated glomerular filtration rate.
Discussion
Few ML models have leveraged peripheral immune cells to forecast 90-day readmission or mortality risks in patients with AHF. To fill this gap, our study developed and evaluated predictive models employing four ML classifiers, integrating traditional clinical indicators with peripheral immune cells. Our analysis pinpointed the SVM model, which combines these indicators and cells, as the most accurate in predicting 90-day outcomes. Importantly, incorporating SHAP analysis into the SVM model enhanced interpretability, shedding light on the specific role of peripheral immune cells in these predictions. This research marks a significant stride in utilizing ML to amalgamate clinical indicators and peripheral immune cells for precise 90-day risk assessments. Continuous refinement of this innovative model aims to improve individual risk predictions post-discharge, ultimately aiming to lower 90-day readmission and mortality rates.
HF stands as a prevalent cardiovascular disease, increasingly affecting populations worldwide.16,17 Despite advancements in managing chronic HF, AHF remains associated with a dire outlook. 16 The period following discharge from an initial AHF hospitalization is critical, with a significant number of patients at risk of readmission. Mortality rates also increase notably within the first 30 days.2,3 This vulnerability window extends, experiencing a surge in events up to 90 days post-discharge before stabilizing. 18 This insight underscores the importance of focusing on care transitions, implementing pre-discharge quality measures, and ensuring early post-discharge follow-up and monitoring. There is a pressing need to identify those at heightened risk of readmission or mortality within the first 90 days after discharge, to better target interventions and improve outcomes.
In our study, we opted for ML models for their adeptness at deciphering complex non-linear relationships between variables and outcomes, an ability that surpasses that of conventional linear models. 19 We applied four ML models to evaluate traditional clinical indicators, peripheral immune cells, and a combination of both. The models integrating both data types were found to be most effective for predicting 90-day readmission or mortality risk, showing superior discrimination abilities compared to models using either data type alone. This superiority likely arises from the wider array of factors these combined indicators capture, directly impacting 90-day outcomes. This comprehensive approach thus significantly enhances predictive accuracy.
Among the evaluated ML models, the SVM emerged as the most effective, utilizing traditional clinical indicators and peripheral immune cells, demonstrating high accuracy, including during external validation. To overcome the challenges of interpretability common with complex ML models, we utilized SHAP analysis. This method elucidates the model's decision-making at the cohort level, enhanced by visual tools that allow for an in-depth understanding of how individual factors contribute to predictions, thus building trust between clinicians and AI technologies.15,20 It identified five crucial predictors of 90-day readmission or mortality: three were traditional clinical indicators, and two were peripheral immune cells. Notably, activated neutrophils, by releasing enzymes like myeloperoxidase, acid phosphatase, and elastase, contribute to tissue damage. 21 Elevated levels of myeloperoxidase and other inflammatory markers, frequently seen in HF patients, suggest a link between inflammation and AHF pathogenesis. 22 Moreover, recent findings underscore the significant role of specific CD4 + and CD8+ T cell subpopulations in HF's progression and prognosis, 23 with animal studies indicating a correlation between CD4+ T cell proportions, activator production, and AHF clinical outcomes. 24 Our analysis also validated three established clinical indicators—age, BUN, and NT-proBNP—aligning with prior studies.5,25 These have been proven in traditional predictive models.6,26,27 Through SHAP, SVM provided transparent insights into the impact of various factors on outcomes, proving indispensable for 90-day readmission or mortality risk screening. Incorporating ML in this screening process promises to empower clinicians to implement post-discharge interventions that enhance AHF patient outcomes.
Our study, despite its promising outcomes, faced several limitations. First, the retrospective design prevented us from dynamically monitoring immune cell changes as patients’ clinical statuses changed, highlighting the need for further investigation in future studies. Second, the retrospective nature of our research poses a challenge to the generalizability and validity of our ML model; thus, future prospective studies are necessary. Third, the study's limited sample size might have impacted its comprehensiveness. Fourth, the absence of external validation from other centers restricts our model's confirmed efficacy beyond our dataset. Nevertheless, our findings underscore the potential of ML models that incorporate traditional clinical indicators and peripheral immune cells for predicting 90-day readmission or mortality risks in AHF patients. To address these limitations, forthcoming research should embrace larger-scale, multi-center, prospective designs and include inter-rater reliability assessments to bolster the model's reliability and wider applicability.
In conclusion, our evaluation identified the SVM model, which combines traditional clinical indicators and peripheral immune cells, as the most effective ML model for predicting 90-day readmission or mortality in AHF patients. Our innovative SVM model, integrating traditional clinical indicators with peripheral immune cells through ML, promises more accurate quantification of 90-day readmission or mortality risks with continuous improvements. With further refinement, the SVM model could enable clinicians to accurately identify patients at high risk of 90-day readmission or mortality, facilitating earlier, more intensive interventions and improved monitoring strategies.
Footnotes
Acknowledgments
The authors would like to thank Kunpeng Gao for his outstanding assistance with the statistical analysis and machine learning models.
Author Contributions
Conception and design: Junming Chen.
Development of methodology: Liting Yang.
Acquisition of data: Jiangchuan Han.
Analysis and interpretation of data: Liang Wang.
Writing, review, and/or revision of the manuscript: Tingting Wu.
Study supervision: Dongsheng Zhao.
Data Availability Statement
All data generated or analyzed during this study are included in this article. Further enquiries can be directed to the corresponding author.
Declaration of Conflicting Interests
The authors declared no potential conflicts of interest with respect to the research, authorship, and/or publication of this article.
Ethical Approval
This study was conducted in accordance with the Declaration of Helsinki principles and received approval from the Ethics Committee of Shuyang Hospital of Traditional Chinese Medicine (No. 2024005).
Funding
The authors received no financial support for the research, authorship, and/or publication of this article.
Informed Consent
Informed consent was obtained from all participants or their relatives.