
Abstract
Background and Aims
The diagnostic standard of coronary artery disease (CAD) is coronary angiography (CAG). Since CAG is an invasive procedure underscores the need for identifying non-invasive, effective, and innovative biomarkers. Our study aimed to retrospectively analyze hematological markers for predicting the severity of CAD.
Methods and Results
Case data were collected from 195 CAD patients admitted to the hospital for CAG. According to Gensini score, patients were divided into mild, moderate, and severe CAD groups. Blood indexes and predictive efficacy of the triglyceride-glucose (TyG) index were retrospectively analyzed. Among 195 CAD patients, 81 had mild CAD, 60 had moderate CAD, and 54 had severe CAD. Sex, fast blood glucose (FBG), TyG index, and high-sensitivity C-reactive protein (hs-CRP) significantly differed among the three groups. The TyG index demonstrated higher values in patients with moderate (9.07[8.62-9.44]) and severe (8.98[8.46-9.45]) CAD compared to those with mild CAD (8.75[8.49-9.14]). The AUC of the TyG index was 0.615 (95% confidence interval (CI): 0.536-0.694, P =.004), with a cut-off value of 8.997, specificity of 0.704, and sensitivity of 0.535. Logistics analysis showed the risk of moderate and severe CAD with an odds ratio (OR) value of 2.595 (95% CI: 1.199-5.619, adjusted P = .016) following regrouping by the TyG index optimal cut-off value of 8.997. The TyG index combined with FBG and hs-CRP had an elevated AUC value, significantly higher than other combinations (P = .011 and 0.02, respectively).
Conclusions
The severity of CAD is positively correlated with an increased TyG index value. A combination of TyG, FBG, and hs-CRP has demonstrated improved diagnostic efficiency, suggesting its potential as a novel indicator for predicting and diagnosing CAD progression.
Introduction
Coronary artery disease (CAD) is characterized by vulnerable atherosclerotic plaque, which causes coronary stenosis and myocardial ischemia. The blockage of the blood vessel caused by the detachment of the endovascular plate leads to an acute CAD attack. Without timely intervention, this can be life-threatening for the patient. Currently, coronary angiography (CAG) is the reference standard for diagnosing CAD with inconclusive evidence to confirm the morbid state. Although it assesses the severity of coronary vascular occlusion, this technique is invasive and carries inherent risks. No diagnosis criteria of the individual laboratory biochemical indexes are applied in the clinical practice, and the current non-invasive hematological indicators have poor specificity and sensitivity. A promising non-invasive peripheral biomarker is challenging to identify and diagnose CAD in clinical practice.
New approaches to mixed biochemical indexes are being explored among metabolism-related parameters, based on the fundamental mechanisms underlying CAD, dyslipidemia, and metabolic disorders. The triglyceride-glucose index (TyG index) is calculated as a surrogate marker of metabolic syndrome, reflecting both lipid metabolism and glucose homeostasis.1–3 Levels of triglyceride (TG), low-density lipoprotein cholesterol (LDL-C), glucose, insulin resistance (IR), and obesity are the most determined risk factors for CAD.4–6 Several studies demonstrated that the TyG index has a positive relevance with type 2 diabetes, 7 IR, 8 subclinical myocardial injury, 9 and acute coronary syndrome (ACS). 10 A higher TyG index correlates with a greater incidence of major adverse cardiovascular events in patients with diabetes and ACS, indicating its potential as an independent predictor for cardiovascular disease prognosis.10, 11
However, no studies have examined the predictive power of the TyG index in CAD patients. Our study aimed to investigate the disparity in TyG index among patients with CAD stratified by Gensini score, assess the correlation between TyG index and disease severity, and evaluate the diagnostic efficiency of TyG index and combined blood markers.
Patients and Methods
Participants
A total of 195 CAD patients hospitalized from January to March 2021 were included in our study. The inclusion criteria were as follows: patients with a diagnosis of CAD, first procedure for CAG, and 18-65 years old. The exclusion criteria were as follows: pregnant or lactating women; patients with previous intravenous thrombolysis, percutaneous coronary intervention, and/or coronary bypass grafting; long-term use of statins or other lipid-regulating drugs; complicated with congenital heart disease, acute heart failure, chronic cardiac insufficiency, myocarditis, acute/chronic infection, severe liver/renal insufficiency, and malignant tumor. The study was approved by the Ethics Committee of Tianjin Chest Hospital, and informed consent was obtained from all patients.
Gensini Score
Gensini Score is calculated using the coronary artery severity score and the region multiplying factor for the complexity of coronary artery lesion, which is widely used in CAG analysis. 12 The region multiplying factor is 5 points for the left main artery, 2.5 points for a proximal segment of the left anterior descending or circumflex branch, 1.5 points for the middle left anterior descending branch, 1.0 points for the distal left anterior descending branch, the middle and distal segment of the left circumflex branch, and the right coronary artery.
Gensini score of each lesion segment = stenosis score × lesion site factor.
The individual Gensini score was the sum of the scores of all lesion segments. Gensini score < 25 was identified for mild CAD, 25-50 for moderate CAD, and ≥ 50 for severe CAD.
Trial Design
CAG was conducted by experienced cardiologists, and initial biochemical tests within 24 h after being admitted to the hospital as well as the degree of cardiovascular stenosis were determined. The patient's characterization records and basic laboratory indicators information were collected. The differences in serum TG, fast blood glucose (FBG), serum high-density lipoprotein cholesterol (HDL-C), cholesteroI (CHO), LDL-C, LDL-C/HDL-C, CHO/HDL-C, high-sensitivity C-reactive protein (hs-CRP), UCG LA, UCG LV, EF% values were retrospectively analyzed. Serum TG and FBG concentrations of patients were used to calculate the TyG index. The calculation formula was as follows:

Statistics
The laboratory indicator values in this study exhibited an abnormal distribution and were represented by the median and quartile range (P25, P75). The Kruskal-Wallis test, a non-parametric test, was used for comparison between groups. Spearman's test was employed to analyze the correlation between the TyG index and the other indicators. The efficiency of the TyG index was evaluated using Receiver Operating Characteristic (ROC) curve analysis, and the cut-off value, sensitivity, and specificity were subsequently calculated. Binary logistic regression was utilized to test the predictive effect of the TyG index on CAD severity. P < .05 was considered statistically significant. The statistical analysis was performed using SPSS 26. The comparison of the ROC curve was performed by Medcalc.
Results
Characteristics
The baseline characteristics of the patients are presented in Table 1. Among all 195 CAD patients, 81 had mild CAD, 60 had moderate CAD, and 54 had severe CAD. The proportions of females were different in the three groups: 33 (40.7%), 11(18.3%), and 8 (14.8%), respectively. Almost all patients were older than 45, indicating that CAD is more prevalent in the elderly; however, no significant group differences were observed. Moderate CAD patients had higher FBG, TyG index, and hs-CRP levels, the difference between the three groups was significant. Meanwhile, the Gensini scores of patients with severe and moderate CAD exhibited a remarkable elevation. Increased LDL-C/HDL-C and CHO/HDL-C levels were associated with increased CAD severity, whereas the opposite was observed for EF%. No significant difference was found in general information.
Characteristics of CAD Patients.
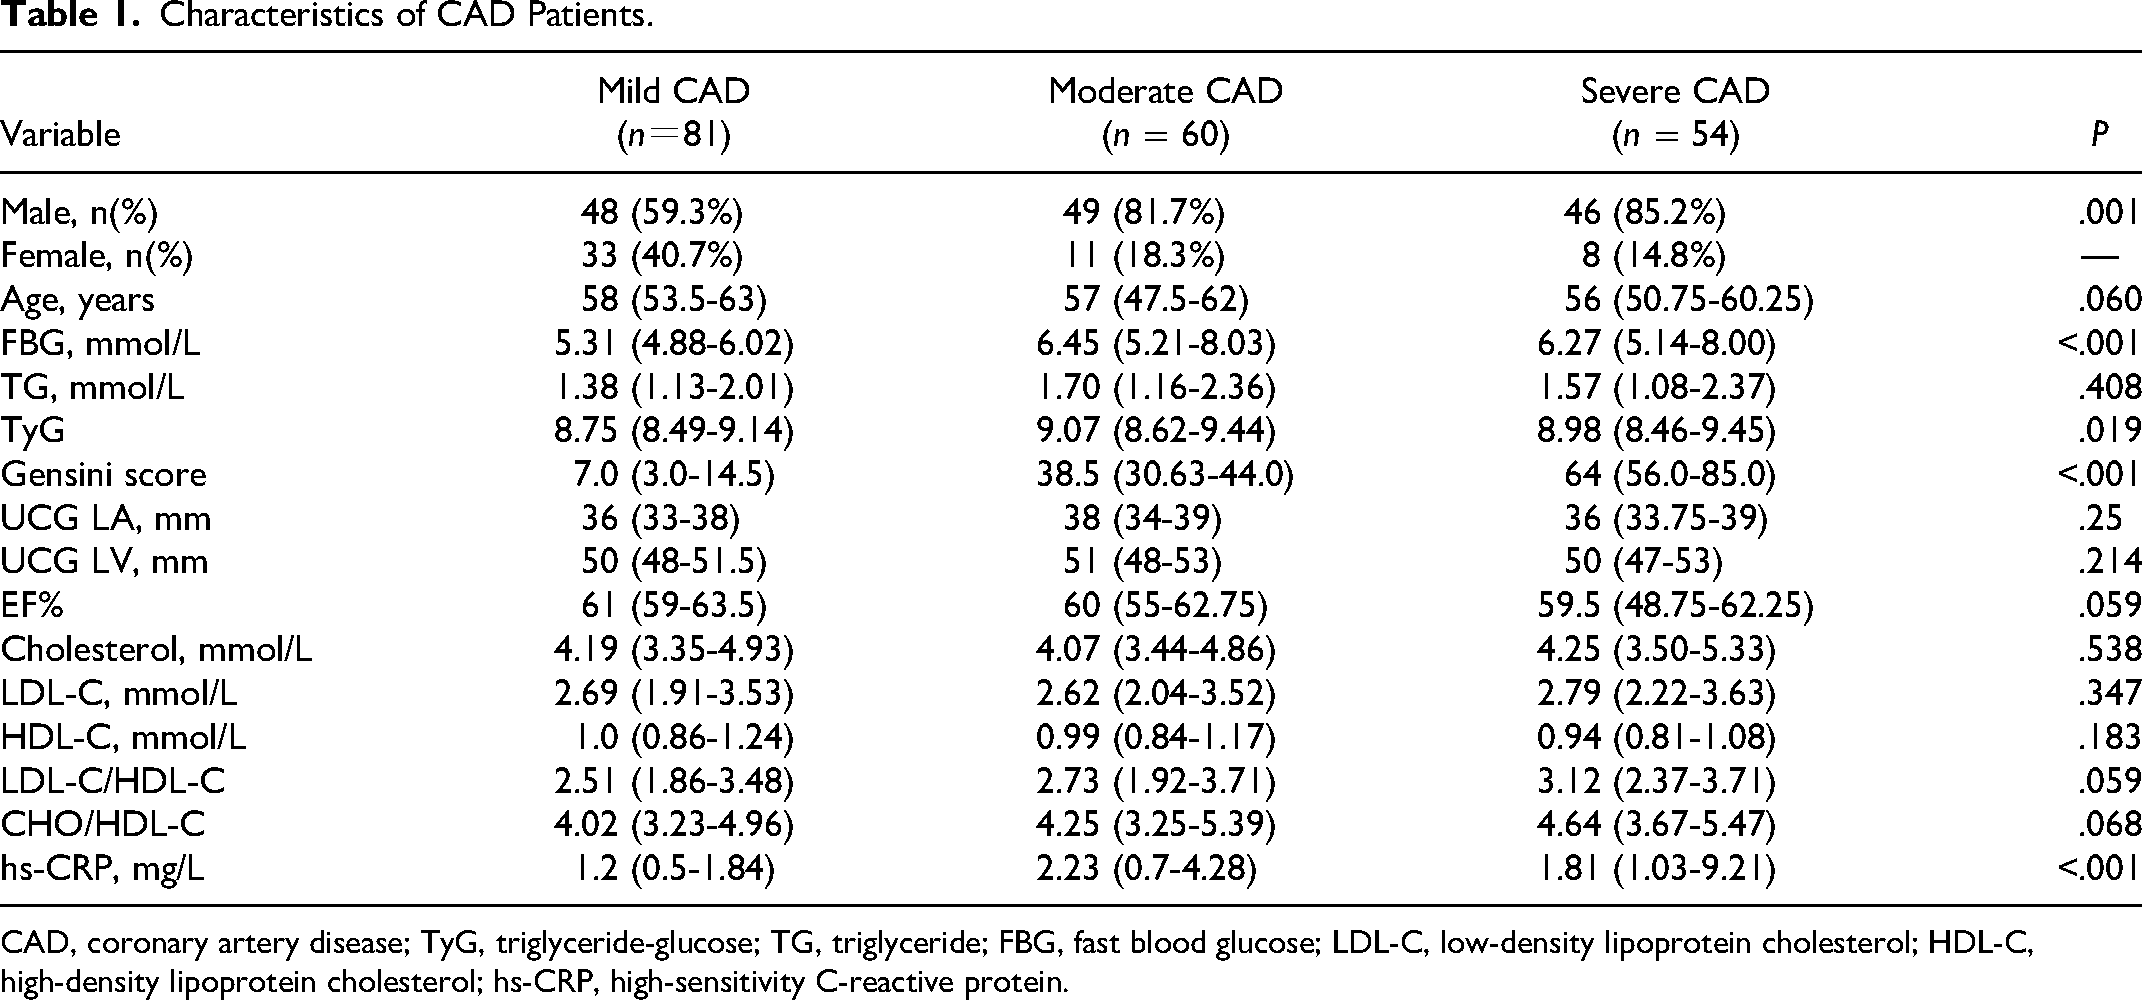
CAD, coronary artery disease; TyG, triglyceride-glucose; TG, triglyceride; FBG, fast blood glucose; LDL-C, low-density lipoprotein cholesterol; HDL-C, high-density lipoprotein cholesterol; hs-CRP, high-sensitivity C-reactive protein.
Correlation Between TyG index and Gensini Score
Table 1 shows TyG index in moderate [9.07 (8.62-9.44)] and severe [8.98 (8.46-9.45)] CAD patients were greater than mild CAD patients [8.75 (8.49-9.14)]. Statistical differences were shown in the comparison between moderate and mild CAD patients (P = .045), while there were no obvious differences between severe and mild CAD patients (P = .35) (Figure 1A).
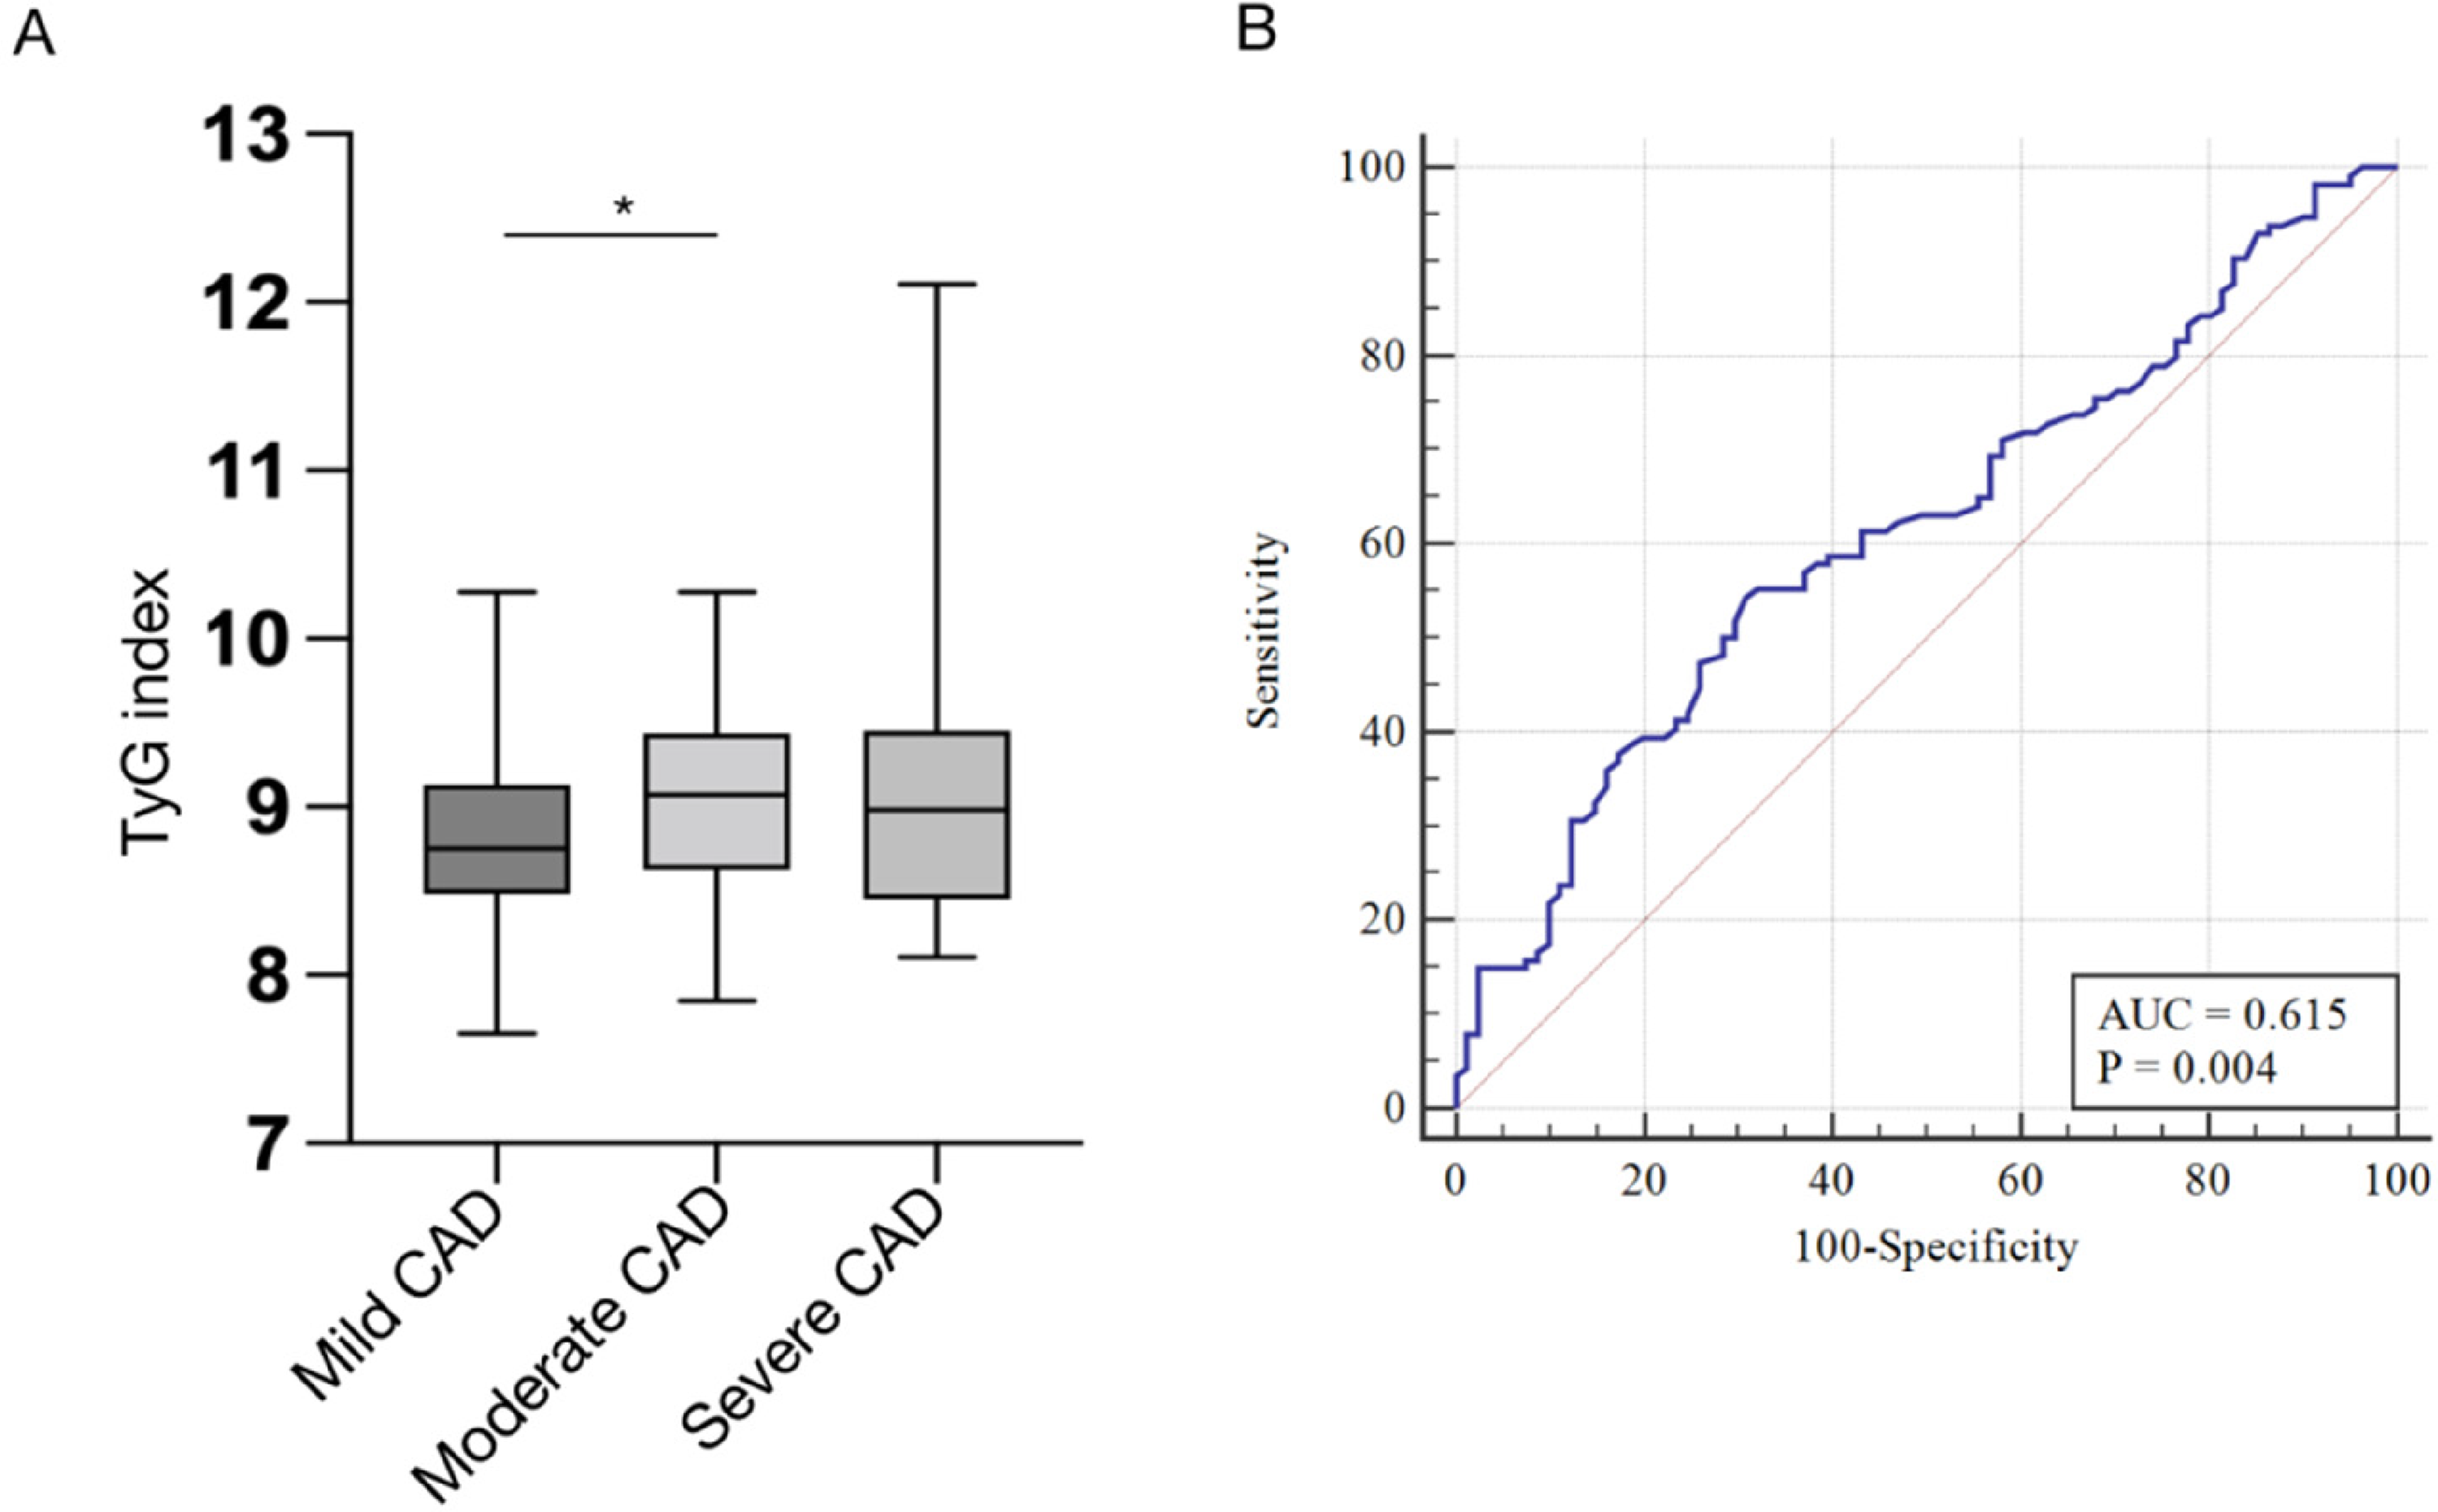
(A) histogram represents the comparison of TyG index among the mild, moderate, and severe CAD groups. (B) ROC analysis of TyG index. CAD, coronary artery disease; TyG, triglyceride-glucose.
To explore the correlation between TyG and Gensini score, we performed Spearman's analysis. The results demonstrated that no correlation existed with the significance of P < .05 (r = 0.137, P = .056). ROC curve analysis indicated the AUC of TyG was 0.615 (95% confidence interval (CI): 0.536-0.694, P = .004), with a cut-off value of 8.997, specificity of 0.704, and sensitivity of 0.535 (Figure 1B).
Predictive Value of TyG index for CAD Severity
According to the optimal cut-off value of the TyG index selected above, CAD patients were regrouped into TyG index < 8.997 and TyG index ≥ 8.997. Table 2 lists the clinical characteristics of the two groups after regrouping. After grouping by 8.997 of TyG index, the values of FBG, TG, cholesterol, LDL-C/HDL-C, CHO/HDL-C, and hs-CRP in TyG index ≥ 8.997 group were found to be significantly higher than those in the group with TyG index < 8.997, while HDL-C was significantly lower than that in the group with a TyG index < 8.997, indicating that the traditional risk factors for CAD were markedly different between the two groups. In particular, those with a Gensini score of TyG index ≥ 8.997 were 40 (between 25-50) points, which could be classified as moderate CAD. Those with a TyG index < 8.997 had 24 (6.0-50.5) points (<25 scores), which could be classified as a mild group, speculating that the TyG index may serve as a predictor of CAD severity.
Clinical Characteristics of CAD Patients Stratified by the optimum cut-off TyG index Value.
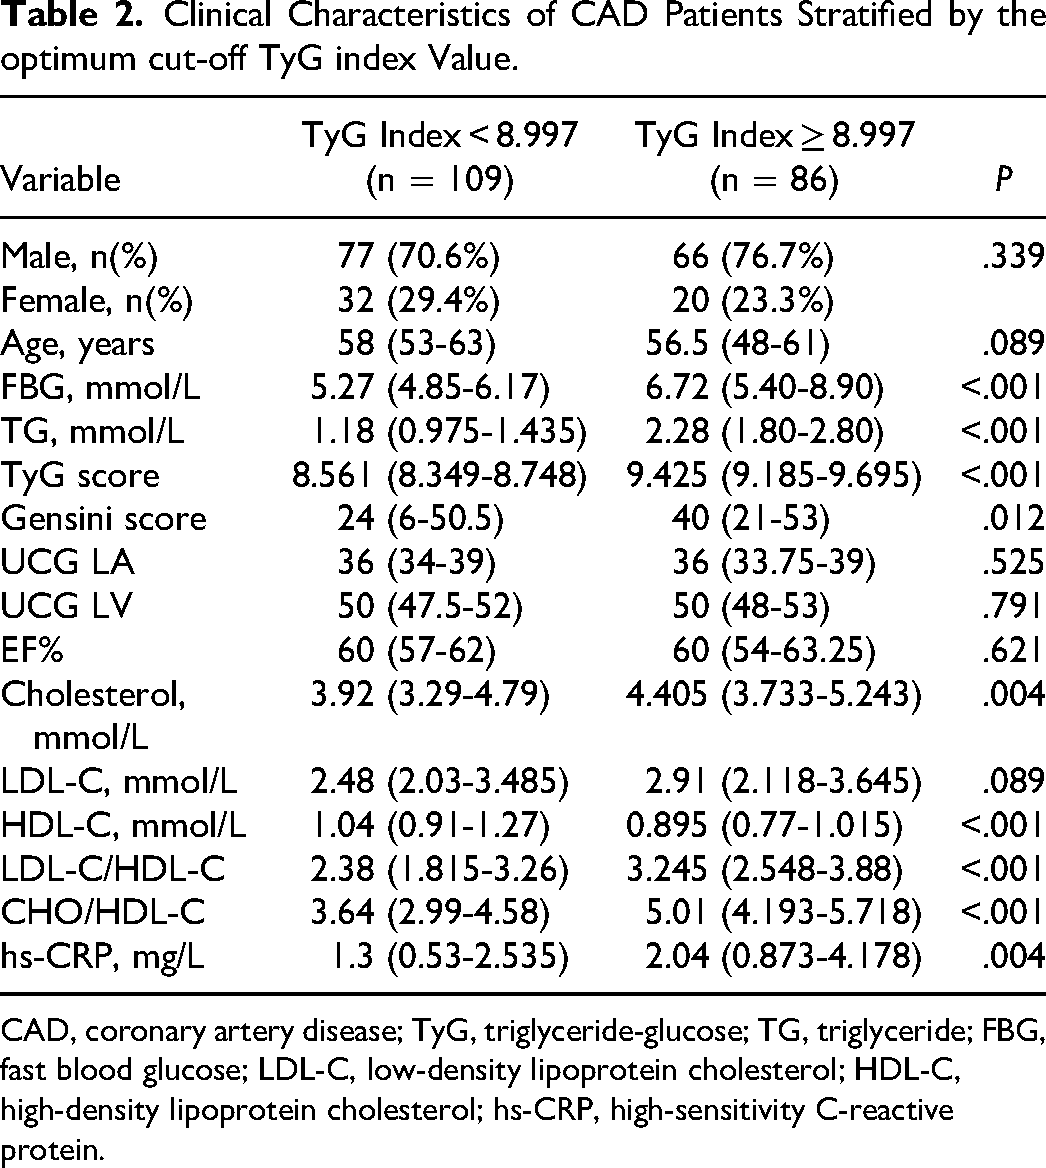
CAD, coronary artery disease; TyG, triglyceride-glucose; TG, triglyceride; FBG, fast blood glucose; LDL-C, low-density lipoprotein cholesterol; HDL-C, high-density lipoprotein cholesterol; hs-CRP, high-sensitivity C-reactive protein.
Spearman's analysis was subsequently used to analyze the correlation between the TyG index and traditional CAD risk factors. Table 3 shows that the TyG index had no significant correlation with gender and age. TyG index was significantly positively correlated with FBG, TG, cholesterol, LDL-C/HDL-C, CHO/HDL-C, and hs-CRP and significantly negatively correlated with HDL-C, further suggesting that the TyG index has a certain predictive effect on CAD severity. Additionally, binary logistic regression was used to analyze the relationship between the TyG index and CAD severity (Table 4). The results revealed that after adjusting for age, sex, TG, cholesterol, HDL-C, and hs-CRP, the risk of moderate and severe CAD patients in the TyG index ≥ 8.997 group was 2.595 fold (95% CI: 1.199-5.619, P = .016) to the patients in the TyG index < 8.997 group.
Correlation Between the TyG index and the CAD Risk Factors.
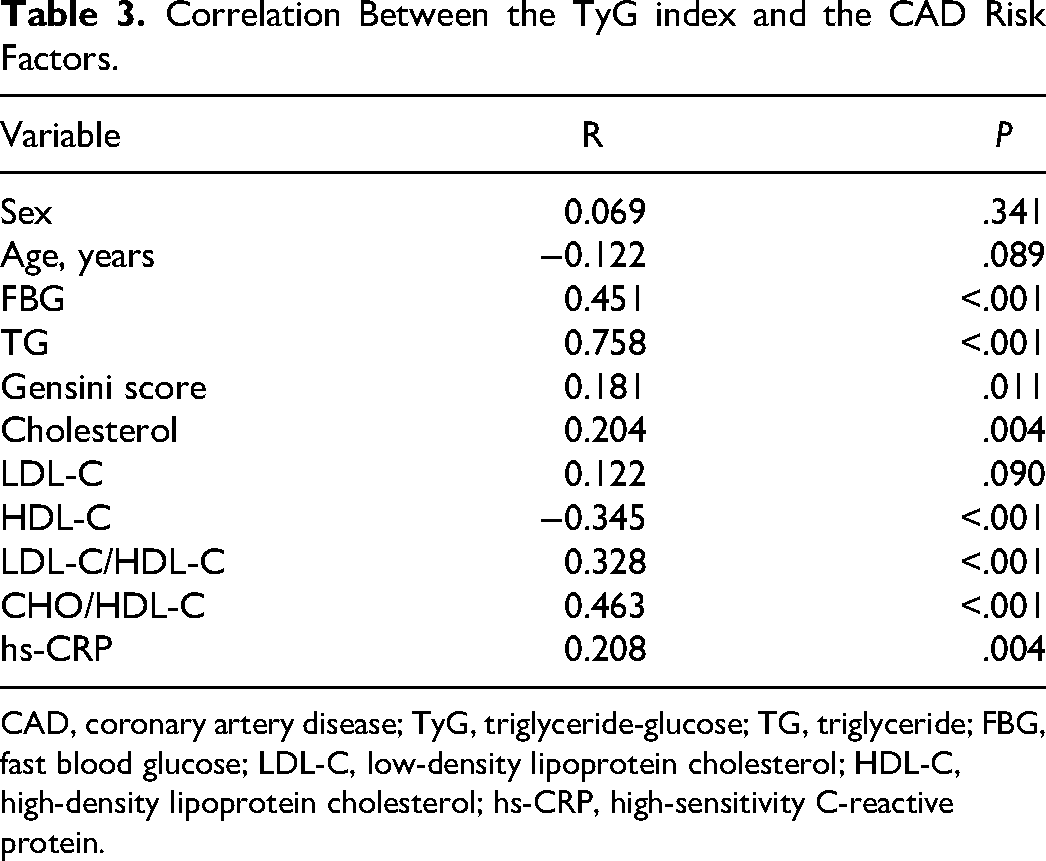
CAD, coronary artery disease; TyG, triglyceride-glucose; TG, triglyceride; FBG, fast blood glucose; LDL-C, low-density lipoprotein cholesterol; HDL-C, high-density lipoprotein cholesterol; hs-CRP, high-sensitivity C-reactive protein.
The Effect of the TyG index to Predict the Severity of Coronary Artery Disease.
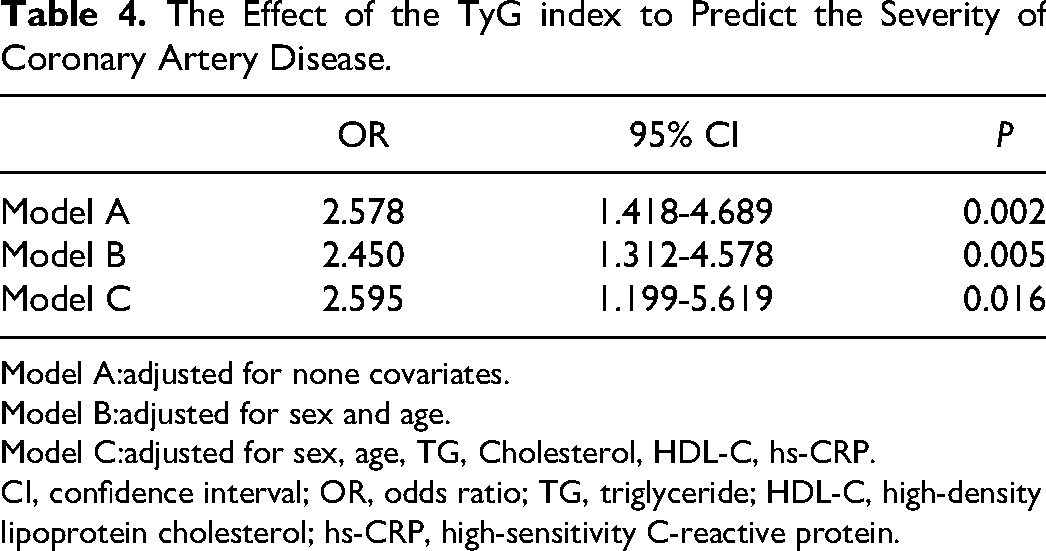
Model A:adjusted for none covariates.
Model B:adjusted for sex and age.
Model C:adjusted for sex, age, TG, Cholesterol, HDL-C, hs-CRP.
CI, confidence interval; OR, odds ratio; TG, triglyceride; HDL-C, high-density lipoprotein cholesterol; hs-CRP, high-sensitivity C-reactive protein.
ROC of Combined Markers
We hypothesized that TyG combined these two indicators of significance would have higher diagnostic efficiency. We established three index models to assess the validity of our hypothesis. Figure 2 and Table 5 demonstrate that Model 3, which integrates TyG with FBG and hs-CRP, exhibits enhanced AUC values, with a specificity of 0.778. Moreover, the AUC for Model 3 is markedly superior to that of TyG and Model 1 (P = .011 and 0.02, respectively). In conclusion, TyG combined with FBG and hs-CRP can improve the diagnostic efficiency of CAD patients.
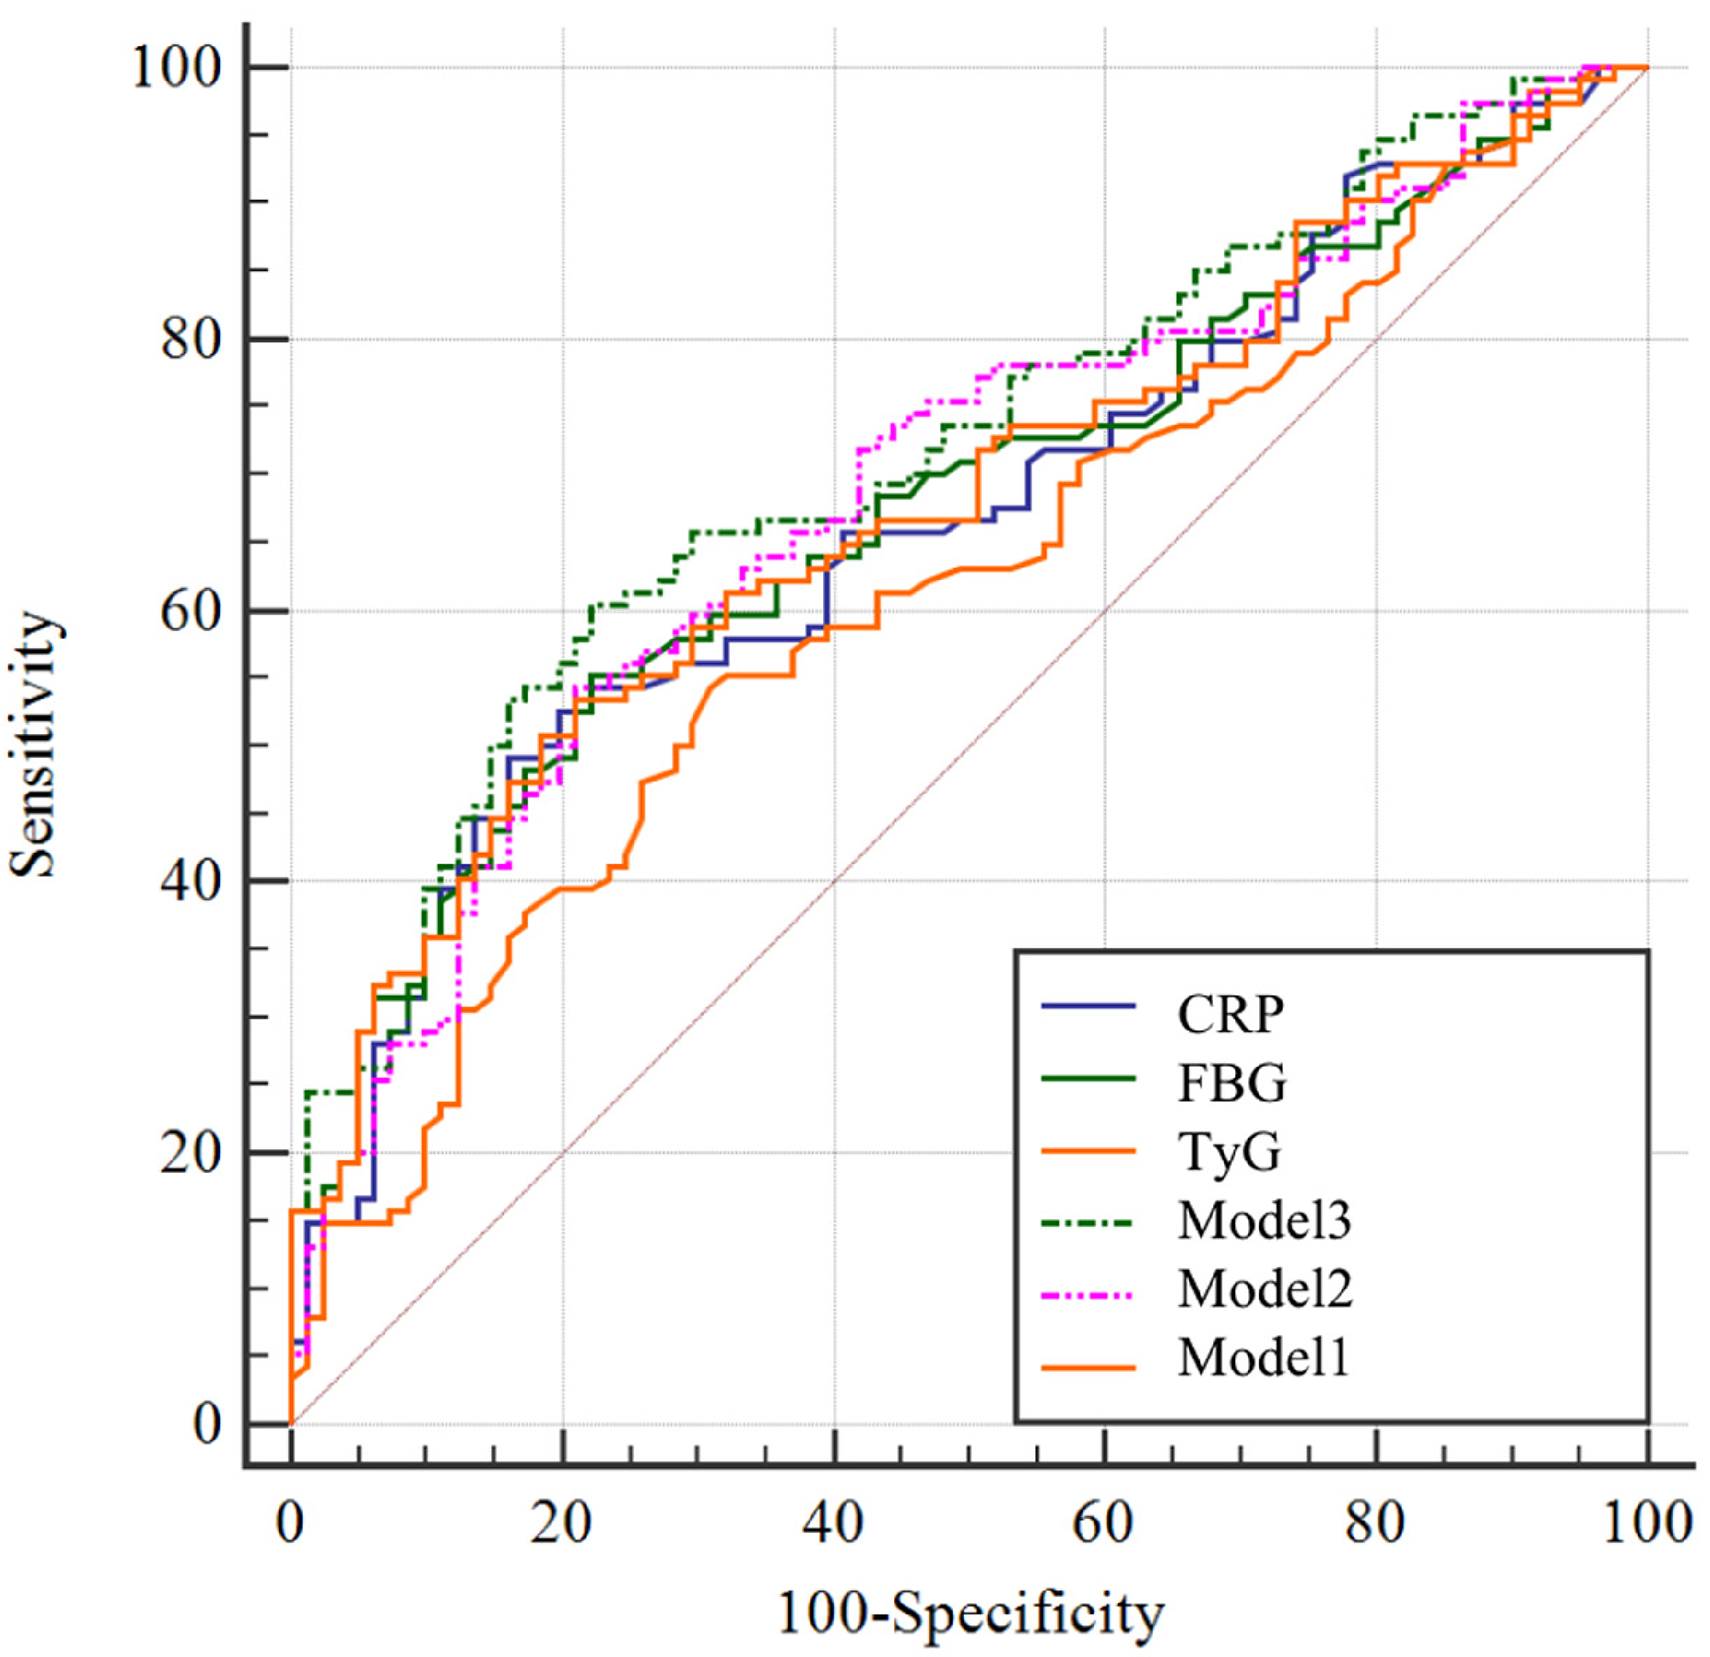
ROC analysis of combined markers.
Diagnostic Efficiency of Index Model.
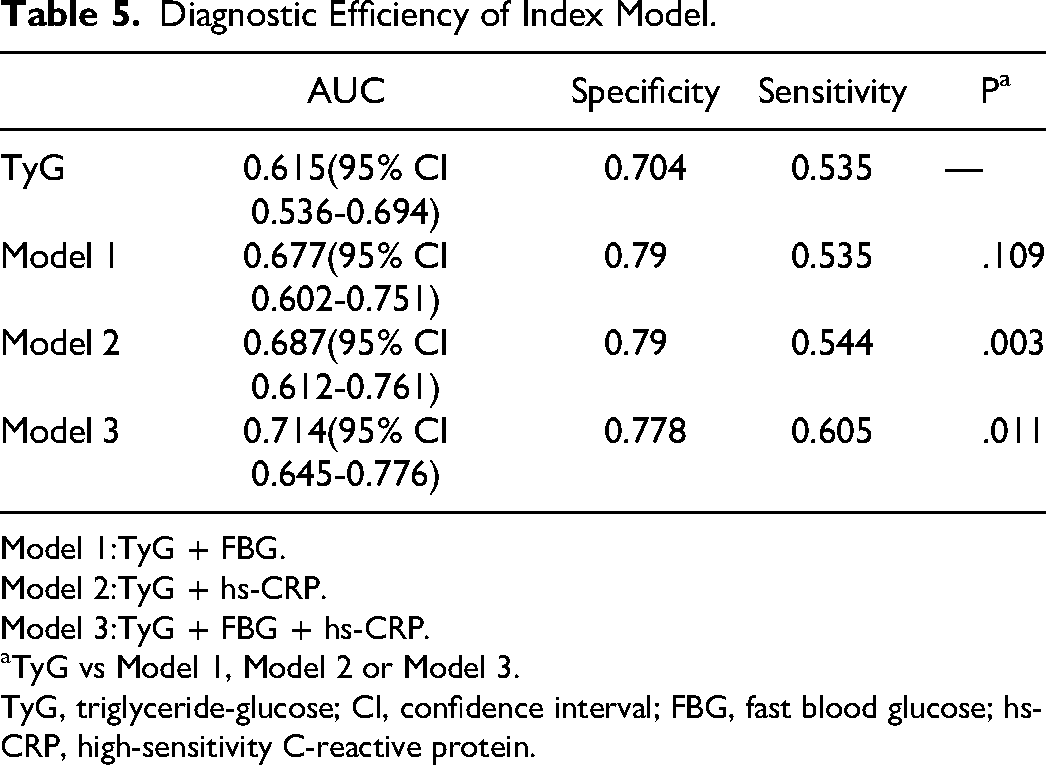
Model 1:TyG + FBG.
Model 2:TyG + hs-CRP.
Model 3:TyG + FBG + hs-CRP.
aTyG vs Model 1, Model 2 or Model 3.
TyG, triglyceride-glucose; CI, confidence interval; FBG, fast blood glucose; hs-CRP, high-sensitivity C-reactive protein.
Discussion
In 2013, CAD incidence was 10.2% in China, according to the China Fifth Health Services Survey, which was rising yearly. In this study, we aimed to screen blood indicators that can predict CAD risk at an early stage. We retrospectively analyzed the data of CAD patients with different risks and calculated the TyG index obtained by TG and FBG. The results showed that the TyG index, FBG, and hs-CRP of moderate and severe CAD patients were significantly higher than those of mild CAD patients. ROC analysis showed that the AUC of the TyG index was 0.615 (95% CI: 0.536-0.694), with a relatively high specificity of 0.704. A recent study also reported that the TyG index had an AUC of 0.601 in detecting CAD severity and effectively identified patients at high risk of multi-vessel CAD. Additionally, the author indicated that the TyG index was associated with CAD severity in the case of DM. 13 The comparable AUC value of our study indicates that it had a certain degree of validity. A retrospective study that collected follow-up data over ten years to predict the capacity of the TyG index showed that the TyG index was associated with the risk of CVD, with a cut-off value of 9.04 and sensitivity of 62.5%. 14
The predictive effect of the TyG index for CAD severity was investigated further, and all patients were regrouped based on the optimal cut-off value of the TyG index. Correlation analysis showed that the TyG index significantly correlated with traditional independent risk factors for CAD disease. Logistic regression analysis revealed that after adjusting for other risk factors, patients with a TyG index ≥ 8.997 had a markedly higher risk of developing moderate or severe CAD than patients with a TyG index < 8.997. In conclusion, the TyG index is an independent risk factor for predicting the severity of CAD.
The widely recognized pathological basis of coronary atherosclerosis is a chronic disease caused by inflammation, accompanied by abnormal glycolipid metabolism. Tang X et al demonstrated that hsCRP levels were increased in patients with ACS, which was correlated with HDL dysfunction and remodeling. 15 The National Academy of Clinical Biochemistry (NACB) advised that hs-CRP could serve as a biomarker for the primary prevention of heart disease and stroke. 16 LDL-C and TG infiltrate the endothelium and damage endothelial cells, which induce the activation of inflammatory response. Therefore, our study utilized a synthetic marker comprising TyG, FBG, and hs-CRP to improve the predictive efficacy of CAD severity in patients. ROC analysis of combined markers indicated that Model 3 had an AUC of 0.714, which was significantly higher than that of the TyG index alone and exhibited increased specificity and sensitivity. It indicated that Model 3 could be employed for diagnosing high-risk CAD and guide the implementation of an active clinical intervention.
Many scholars have pointed out that the status of coronary atherosclerosis can be assessed through the detection of blood indicators that comprehensively reflect CAD threats, as CAG is deficient in this regard. Therefore, it was imperative to develop new blood indexes to meet clinical requirements and provide patients with easy-to-accept and reliable detection services. Consequently, our study innovatively combined TyG, a surrogate of IR, FBG, and hs-CRP to comprehensively assess the progression of CAD by accounting for the effects of glucose metabolism, lipid metabolism, and inflammation. Blood tests could avoid invasive CAG examination and conveniently predict the development of CAD. It is also conducive to the rational application of the clinical intervention. Blood tests could avert invasive CAG and conveniently predict CAD development, facilitating rational clinical intervention application.
Our study had some limitations. First, the number of cases included in our study was small. The TyG index slightly correlated with the Gensini score, but there was no statistical significance. However, after grouping with the cut-off value of the TyG index, a significant correlation was found between the TyG index and other CAD risk factors, such as cholesterol and TG levels. Thus, it can be inferred that the TyG index may be correlated with the severity of CAD disease. Further research should verify the results of this study by an increased sample size. Second, the study excluded patients over 65 due to the high likelihood of developing complex primary diseases. It may cause certain interference with peripheral blood hematological indexes and may inaccurately represent the predictive effect of the TyG index on the severity of CAD disease. After being gradually adjusted by general influencing factors, logistic regression analysis still showed that patients with a high TyG index had a significantly increased risk of developing CAD. The next step will be to conduct age-stratification research on all age groups. Third, although long-term survival data is not analyzed, it does not affect the results of our study. The purpose of this study was to screen out non-invasive circulatory markers capable of identifying the early stage of CAD deterioration; therefore, the analysis of the TyG index for survival prediction was not performed in this study.
In conclusion, our study manifested that the TyG index of moderate or severe CAD patients (Gensini score ≥ 25) was significantly higher than those with mild CAD, and the optimal diagnostic cut-off value was 8.997. Patients with a TyG index ≥ 8.997 had a higher risk of developing severe CAD when compared to patients with a TyG index < 8.997. The correlations between TyG, FBG, and hs-CRP indexes and CAD severity imply their potential use in predicting and diagnosing CAD progression.
Footnotes
Declaration of Conflicting Interests
The author(s) declared no potential conflicts of interest with respect to the research, authorship, and/or publication of this article.
Funding
The author(s) disclosed receipt of the following financial support for the research, authorship, and/or publication of this article: This work was supported by the National Natural Science Foundation of China Grants, the Project of Science and Technology of Tianjin Health Commission in 2021, and Tianjin Key Medical Discipline(Specialty) Construction Project, (grant number 81900265,TJWJ2021MS027, TJYXZDXK-042A).