
Abstract
This study aimed to identify predictors of venous thromboembolism (VTE) in hospitalized cancer patients and develop a predictive model using demographic, clinical, and laboratory data. Our analysis showed that patient groups categorized under a very high risk, and high risk, patients with low hemoglobin levels and renal disease were at a significantly increased risk of developing VTE. We developed a VTE risk-assessment model (RAM) with moderate discriminatory performance, high specificity, and negative predictive value, indicating its potential utility in identifying patients without VTE risk. However, the model's positive predictive value and sensitivity were low due to the low prevalence of VTE within the analyzed population. Future studies are needed to analyze additional predictive factors, and to validate the effectiveness of our VTE RAM to safely rule out VTE, compare it with other VTE RAMs in hospitalized cancer patients, and address any limitations of our study.
Introduction
Venous thromboembolism (VTE) is a disorder characterized by the formation of thrombus or thrombi in veins in various anatomical locations. VTE may manifest as deep vein thrombosis (DVT), which can embolize and result in life-threatening pulmonary embolism (PE). Hospitalized patients are at high risk for DVT and PE,1,2 with 547 596 hospitalizations with VTE among patients aged 18 or older in the United States from 2007 until 2009, according to the Centers for Disease Control and Prevention (CDC). DVT accounts for about two-thirds of these cases, and PE accounts for one-third. VTE has a high mortality rate,3,4 with an estimated 100 000 annual deaths in the United States, and is one of the leading causes of preventable hospital deaths. 5 About 10% to 30% of VTE cases result in death within 30 days of hospital admission, with most VTE-related sudden deaths occurring due to PE (20%-25%). 6 Despite the availability of safe and effective pharmacologic prevention methods, they are often underutilized. 7
Cancer patients have a significantly higher risk of developing VTE, with a 5- to 7-fold increased risk compared to the general population.8–11 VTE risk is influenced by patient related factors (age, gender, co-morbidities, immobility, previous VTE), cancer-associated factors (type and location of cancer, stage, histological subtype, time since diagnosis), and cancer treatment (surgery, anti-angiogenesis treatment, chemotherapy, and central venous catheters). 12 The prognosis is relatively poor for patients diagnosed with VTE at the time of cancer diagnosis or within a year of diagnosis. 13 In addition to increasing morbidity and mortality, VTE can negatively impact the quality of life and interrupt cancer treatment. On the other hand, anticoagulation for VTE prophylaxis can increase the risk of bleeding and its related complications in hospitalized patients, particularly those with delirium or at risk for head trauma from falls. It is crucial to identify patients not at risk for VTE and avoid inappropriate anticoagulation while providing VTE prophylaxis for those at risk.
Our study aims to identify predictive factors of VTE and develop a predictive model for VTE risk in cancer patients using their demographic, clinical, and laboratory data. We outline the methods used for model development, testing, and validation.
Methods
Study Population
We conducted a retrospective cohort study of cancer patients admitted to Sparrow Hospital in Michigan, USA from January 2013 to September 2015. Out of a total of 6438 cancer inpatient admissions, we identified 3914 patients for initial analyses. For patients with multiple admissions, we used their earliest admission date for analysis.
Inclusion Criteria
Age > 18 years.
Cancer in patients who were admitted to Sparrow Main Hospital.
In addition to demographic factors, such as age and gender, we evaluated potential predictors of VTE risk in three categories: (a) cancer, (b) comorbidities, and (c) laboratory variables. The 22 cancer types coded in the dataset were grouped into 9 categories based on the International Classification of Diseases, Ninth Revision, Clinical Modification (ICD-9 CM). Nearly 93% of patients had a single cancer site. For patients with multiple cancer sites (ranging from 2 to 4), we used clinical judgment (by authors RS, SS) to assign a cancer category to all but 45 patients, resulting in a total of 3869 patients included in the analyses (Table 1).
VTE Prevalence in Cancer Groups.

The different types of cancer were classified as very high, high, and low risk for VTE (Table 2). Very High Risk = Digestive, Genitourinary (Female), High Risk = Respiratory, Lymphomas, Hematologic, Low risk = Breast, Genitourinary (male), head/neck, sarcoma
Cancer was the main focus of this study, so we categorized it into mutually exclusive subgroups: very high risk, high risk, low risk, pancreatic cancer, and renal cancer (see Table 2). Comorbidities were recorded as present or absent, with no missing information. Continuous laboratory variables were categorized based on either previous analysis 14 or clinical thresholds. Missing values were less than 3%, the only exception was albumin which had 16.5% missing values. We applied a simple strategy of imputing a random value between the minimum and maximum of each variable in the data set for each patient independently in the derivation and validation sets. Statistical analyses were conducted using SAS Software, version 9.4 (SAS Institute Inc, Cary, NC).
Primary Cancer Classification. a

a Pancreatic cancer and renal cancer are separate subgroups.
Table 3 shows the association of cancer risk groups with VTE prevalence. Relative to the low-risk group, all other cancer risk groups had higher odds of VTE prevalence.
IRB Approval
The study was approved by the Michigan State University Human Research Protection Program
Model Derivation
We randomly divided the dataset into a derivation set (n = 1935) and a validation set (n = 1934). Using the derivation set, we identified potential risk factors for VTE, including demographic variables (eg, age, gender), cancer categories, baseline laboratory variables, and comorbidities. These variables were selected based on previous research and our clinical experience. 14 To assess the balance between the derivation and validation sets, we used Chi-squared tests to compare the distribution of potential risk factors between the two sets.
We used backward elimination to build a multivariable logistic regression model based on a set of risk factors. Comorbidities with fewer than 10 VTE events (coronary arterial disease, cerebrovascular disease) were excluded, as were laboratory variables with 1 to less than 10 events in non-missing cells (sodium, BUN, calcium, glucose) before imputation.15–17 The backward elimination process was conducted in two steps: first with comorbidities, and then with laboratory variables. Cancer risk groups were maintained in both steps. In the final step, all variables with a P-value <.2 were included in the model. 18 We examined the potential improvement in the model's predictive power by adding two-way interactions between main effects using likelihood ratio tests, but found no significant interactions. We estimated odds ratios (OR) and 95% confidence intervals (CI) for all factors. 19
The final model was subjected to rigorous evaluation for detecting potential outliers and influential observations and was assessed for overall goodness-of-fit and predictive power. A model's predictive ability was assessed by the c-statistic, and goodness-of-fit by the Hosmer–Lemeshow tests. 19
To inform the prediction model's discriminative performance, we used cross-validated predicted probabilities of VTE to obtain sensitivity, specificity, positive and negative predicted values, and the c-statistic. The cross-validated probability removes an individual's contribution to model estimation, thereby mitigating bias of an individual's contribution to the model's prediction of the patient's own VTE risk.
For a pair of patients, one with VTE and the other without VTE, the c-statistic is the model ability to estimate a higher probability of VTE in the patient with VTE than in the patient without VTE. The c-statistic is equivalent to the area under the receiver operating characteristic (ROC) curve, which is a graphical representation of the model's ability to predict the occurrence of the event. The ROC maps the points (sensitivity, 1 − specificity) as the cut-point of model-predicted probability of VTE varies between 0 and 1.
Validation Data Set
We applied the same prediction model obtained from the derivation dataset to the validation dataset without refitting it. This process is known as scoring the validation dataset. 20 We obtained several fit statistics, but to ensure a fair comparison, we used individual probabilities from the derivation file instead of those from cross-validation.
Results
Overall, in our study sample of 3869 patients, 52.7% were male, mean age was 65.9 years (SD = 13.9); 55.5% were 65 years or older. VTE prevalence was 3.9%. We classified the various types of cancer as very high, high, or low risk for VTE (Table 2). Table 3 shows the association between cancer risk groups and the prevalence of VTE. Compared to the low-risk group, odds of VTE prevalence were higher in all cancer risk groups except for renal cancer.
Association of Cancer Groups With VTE Prevalence (n = 3869).
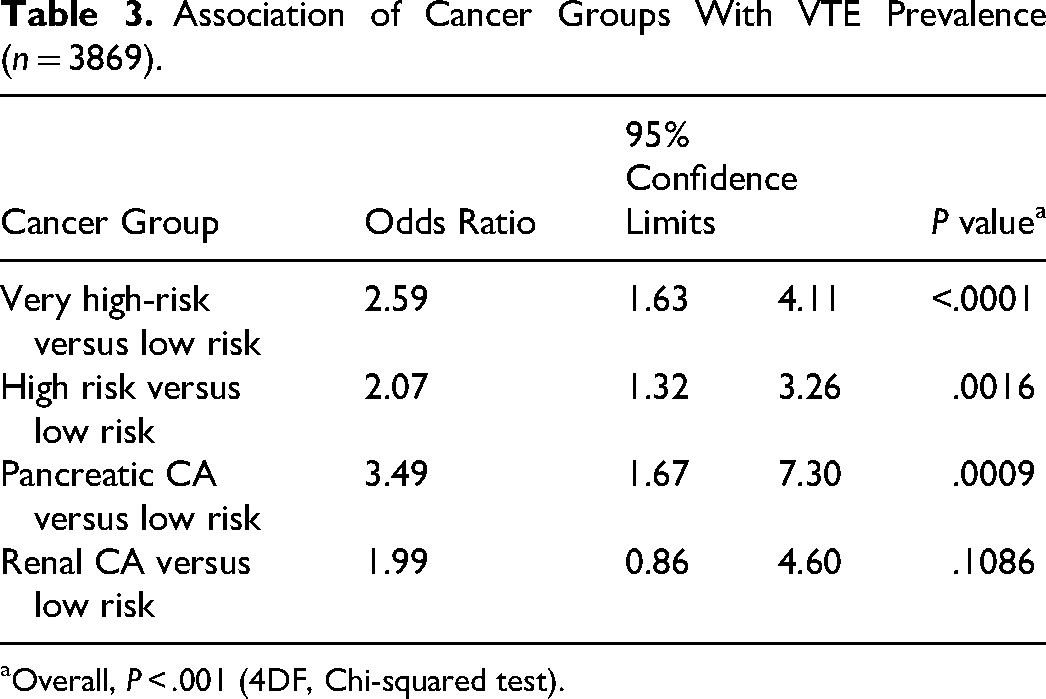
Overall, P < .001 (4DF, Chi-squared test).
Prediction Model for VTE
In the derivation data set, VTE prevalence was 4.0%. Females had a higher risk than males, with an odds ratio (OR) of 1.96 (95% CI: 1.23, 3.13). Age was not associated with VTE. Among comorbidities, only renal disease showed a significant association in the presence of cancer group and gender. To avoid collinearity between baseline laboratory variables, we examined correlations and included variables with a correlation <0.60 in the multivariable model. These variables included hemoglobin, white blood cells (WBC), platelets, glomerular filtration rate (GFR), creatinine, body mass index (BMI), and potassium. We used reference values to categorize laboratory variables.
Table 4 summarizes the results of the derivation model using OR and 95% CI. The c-statistic was 0.70 (95% CI: 0.64, 0.76). We used a cutoff of 0.06 for the model's predicted individual probabilities to obtain the true positive fraction (sensitivity, TPF) of 42.3% [95% CI: 31.3%, 53.3%], and a true negative fraction (specificity, TNF) of 82.3%. [95% CI: 80.6%, 84.1%]. With a VTE prevalence of 4%, the positive predictive value (PPV) was 9.1% [95% CI: 6.1%, 12.1%] and the negative predictive value (NPV) was 97.1% [95% CI: 96.3%, 98.0%]. The overall correct classification of VTE events was 80.7%.
Derivation Model—Predictors of VTE.

Validation Dataset
We tested the performance of our prediction model using a separate data set that was not used in model construction. We found no significant differences between the derivation and validation cohorts in a host of variables (Appendix Table A-Supplemental material). To calculate the individual fitted probability of VTE for each patient in the validation dataset, we applied the estimated regression parameters from the derivation model. Figure 1 shows the distribution of the probability of VTE by cancer group in the derivation and validation cohorts. In the derivation cohort, the probability is predicted, while in the validation cohort, it is fitted. Based on our estimates, pancreatic cancer had the highest predicted probability of VTE (mean 7%), followed by renal cancer (mean 6%). The very high-risk and high-risk cancer groups had an estimated mean predicted probability of 5% each, while the low-risk cancer category had an estimated VTE risk of 2%. There was some variation in the distribution of these estimates, as shown in Figure 1. These estimates support the cancer risk classifications in Table 1 from previous literature and were made independently of the data in this study.

Distribution of individual probabilities of VTE by cancer categories in the derivation and validation cohort.
Figure 2 compares the ROC curves for both cohorts. In the validation data set, the c-statistic was 0.60 (95% CI: 0.53, 0.66). Using a cutoff of 0.06 on fitted probabilities, and a VTE prevalence of 4%, we obtained the following values: TPF (sensitivity), 29.2% [95% CI: 18.7%, 39.7%], TNF (specificity), 82.9% [95% CI: 81.2%, 84.6%], PPV 6.2% [95% CI: 3.6%, 8.8%], NPV 96.8% [95% CI: 95.9%, 97.7%]. The overall correct classification of VTE events was 80.9%.
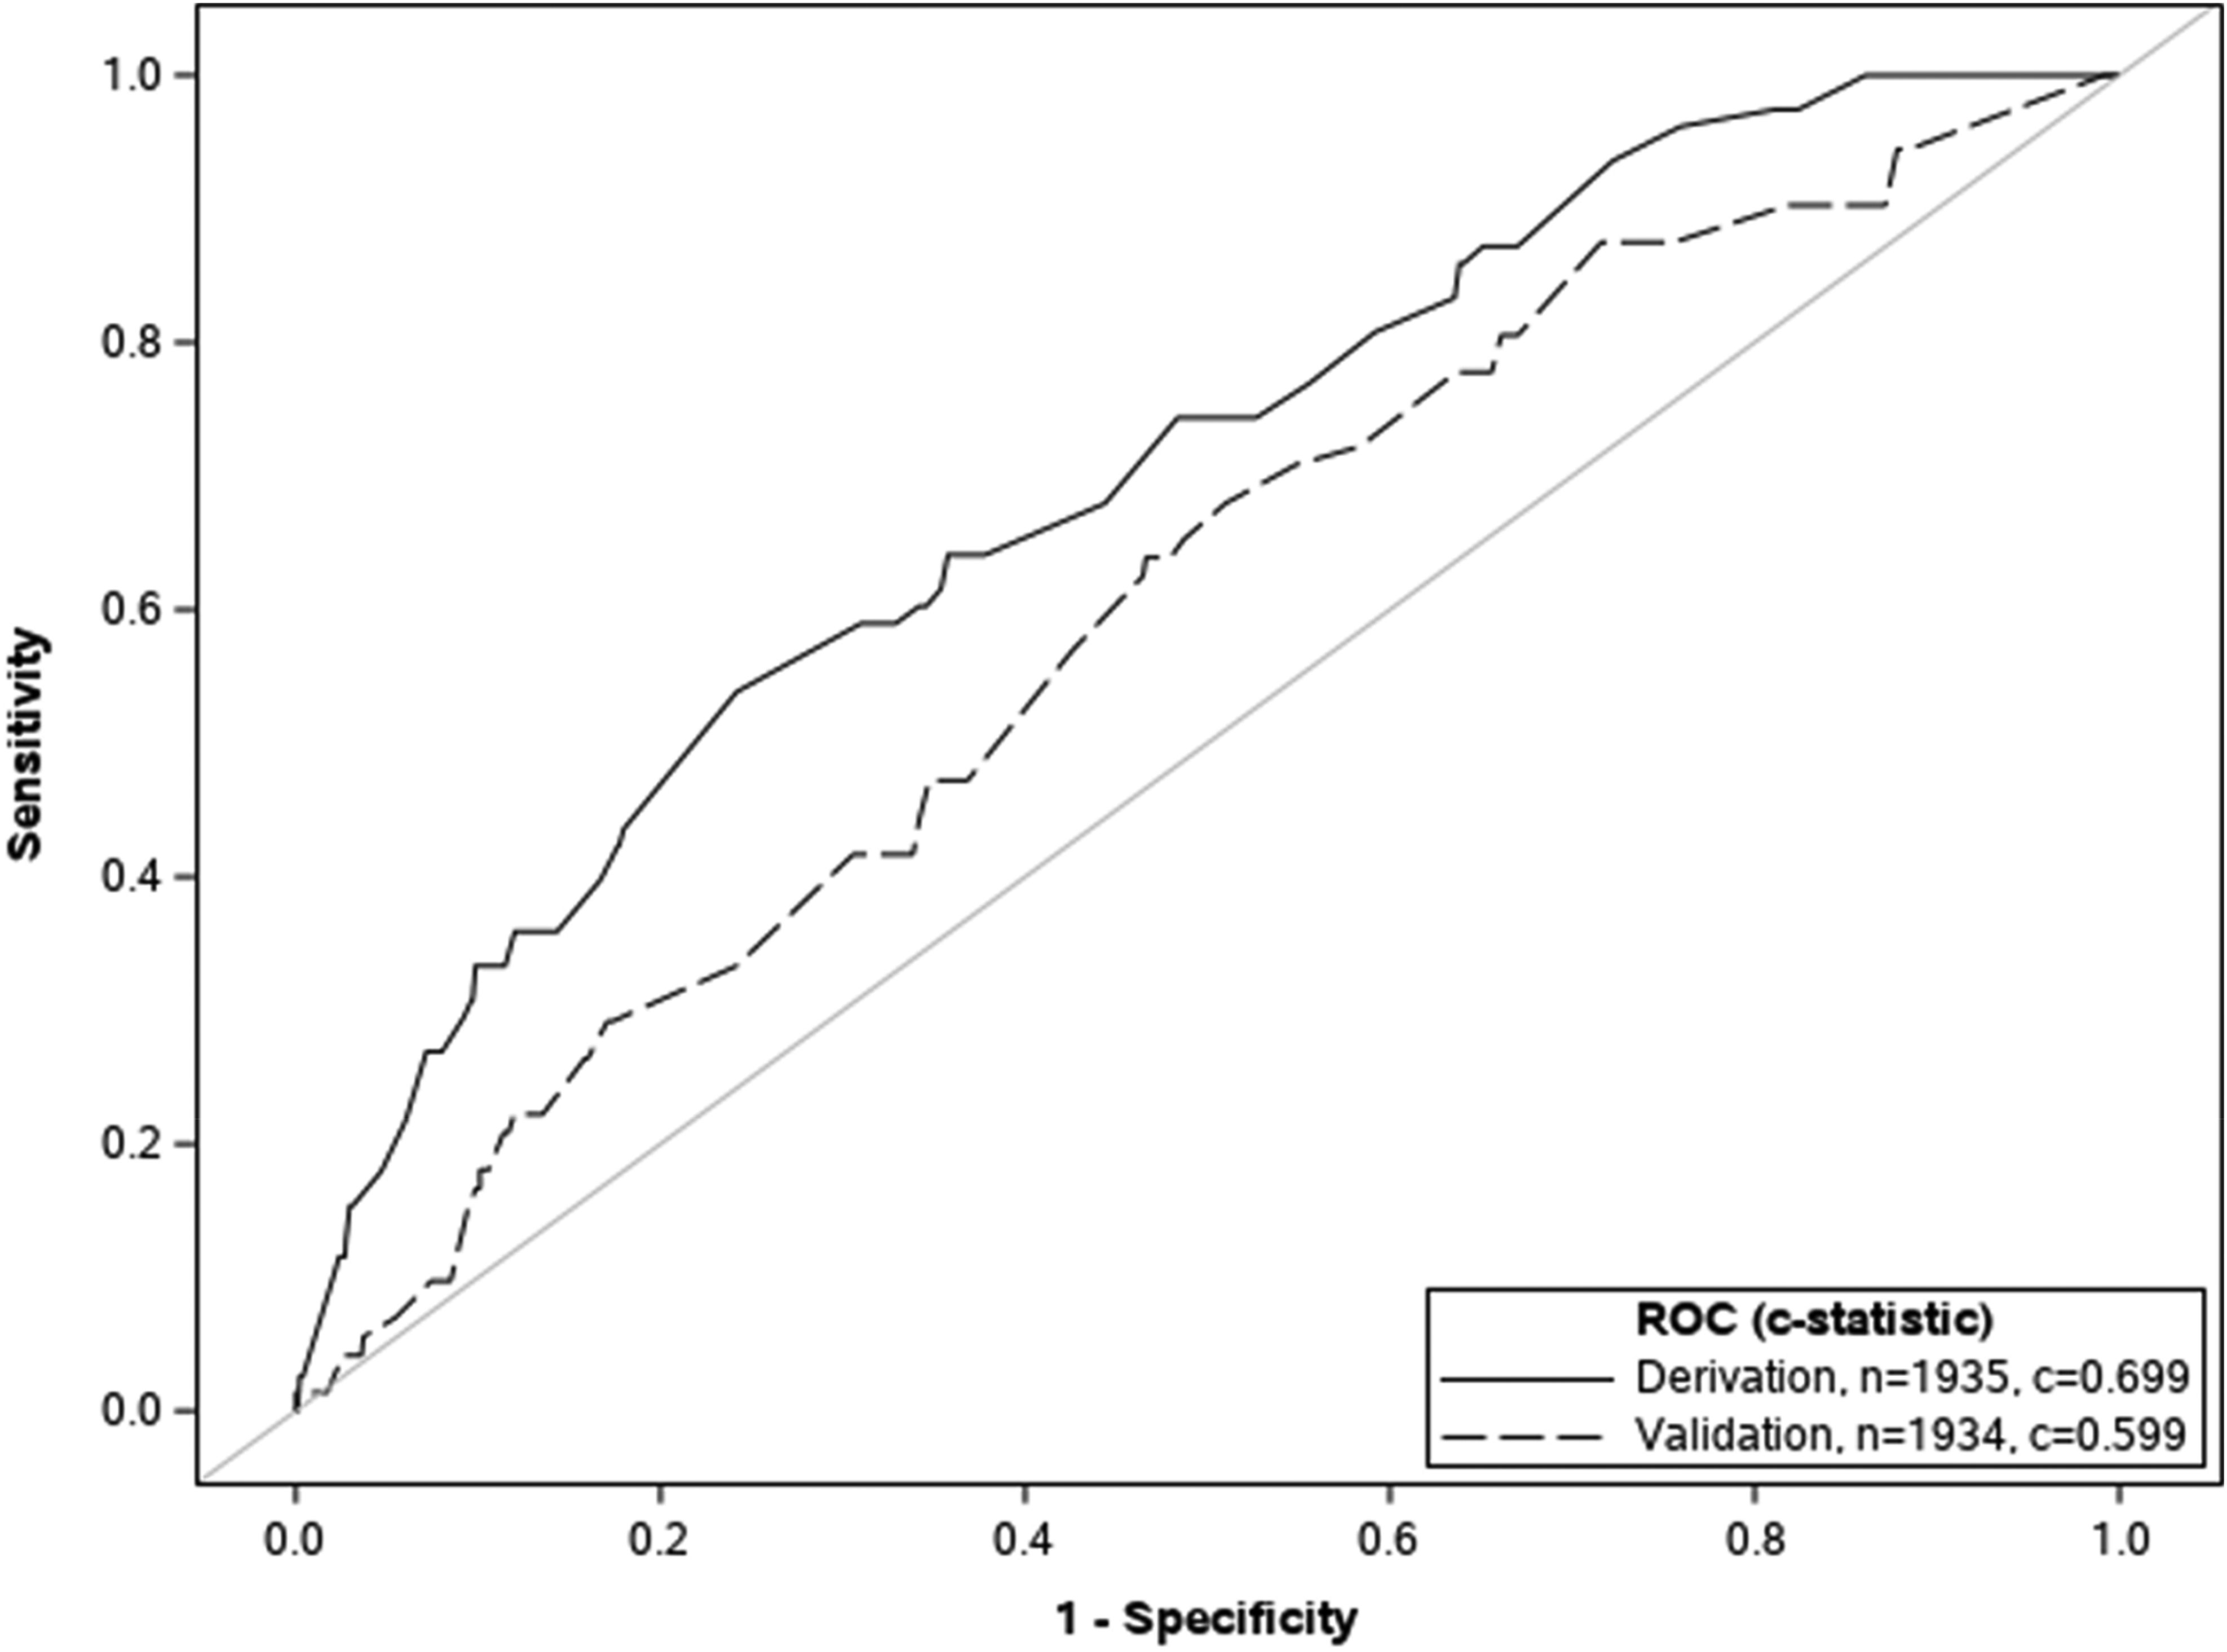
Receiver operating characteristic curves.
Discussion
Our study aimed to identify factors that increase the risk of inpatient VTE in cancer patients and create a risk-assessment model specific to this population. In addition, we aimed to accurately identify patients who are at low risk for VTE, exclude cancer patients who are not at high risk for VTE, and identify patients who are at high risk for VTE during their hospital stay and require prophylaxis.
We initially identified five cancer categories, one comorbidity, two laboratory parameters, and gender as potential predictors for inpatient VTE in cancer patients. In our derivation model, very high-risk groups, high-risk groups, hemoglobin <12.4 g/dL, and renal disease were found to be statistically significant predictors of inpatient VTE risk. The Khorana VTE risk-assessment model (RAM) 14 also includes two risk categories–very high risk (stomach, pancreas), high risk (lung, lymphoma, gynecologic, bladder, testicular), and a low hemoglobin level as VTE risk predictors. In addition to these factors, Khorana VTE RAM includes a prechemotherapy platelet count of 350 × 109/L or above and a BMI of 35 kg/m2 or above as predictors. However, unlike our VTE RAM, Khorana VTE RAM does not consider renal disease a risk factor for VTE in cancer patients. Recently, Nichetti et al 21 proposed a mathematical model that examined various parameters to identify risk factors for VTE. The study analyzed different factors, including Khorana score, hemoglobin, and various types of treatments, but found that only albumin, lactate dehydrogenase (LDH), and vascular compression were statistically significant in their univariate analysis. These factors were then included in the final model. However, it is important to note that the study had a small sample size, and therefore the results should be considered preliminary and the model needs to be validated through further studies with larger sample sizes.
The results from our study indicate that our VTE predictive model has a moderate discriminatory performance, as shown by the c-statistic of 0.60 in the validation data set, which still suggests that the model can distinguish between patients with and without VTE more often than it would by chance. Our VTE RAM model showed a high level of specificity of 82.9%, effectively identifying individuals without VTE, but sensitivity was low at 29.2% likely due to low prevalence of VTE. NPV of 96.8% and PPV of 6.2% also indicate that the model is able to identify the majority of patients without VTE, which is a positive outcome. It is important to note that the performance of a predictive model is also dependent on the prevalence of the disease in the population. In this case, the VTE prevalence is 4%, which makes it harder to achieve high sensitivity, specificity, and PPV. Overall, the model's performance is relatively high, with an overall correct classification of 80.9%. Therefore, using our model, it is more challenging to identify positive cases among a large number of negative cases.
This study estimates a 4.0% prevalence of VTE in the cohort with various cancer types with varying risks for VTE occurrence. All cancer risk groups, including pancreatic and renal cancers, had higher odds of VTE prevalence compared to the low-risk group (male genitourinary cancer, head and neck cancer, sarcoma, breast cancer—including both male and females). Hospitalization alone raises the risk for VTE development, and the presence of cancer and chemotherapy further increases this risk in hospitalized patients. The prevalence of VTE in cancer patients has been reported to be as high as 16.6% in those receiving cisplatin chemotherapy 22 compared to 7.3% in cancer patients receiving other chemotherapy agents. 23 Periodic VTE risk assessments allow healthcare providers to identify patients at high risk for VTE and implement preventive measures to decrease the likelihood of VTE occurrence in hospitalized cancer patients.
Several VTE risk-assessment models, including the Caprini RAM, Padua prediction score, IMPROVE model, Geneva risk score, and Kucher score, have been developed for use in hospital settings. 24 However, these models are not specific to cancer patients and may not be used to accurately reflect the increased risk of VTE in cancer patients compared to non-cancer patients. 25 Our study focused specifically on inpatients with a cancer diagnosis, making it more relevant to the VTE risk assessment of hospitalized cancer patients.
The Khorana VTE RAM is a tool developed for predicting the risk of VTE in ambulatory cancer patients. 14 A recent systematic review and meta-analysis conducted by Mulder et al evaluated the performance of Khorana VTE RAM in predicting VTE in ambulatory cancer patients. The results suggested that the Khorana score can help identify patients at a higher risk of developing VTE and may benefit from thromboprophylaxis. 26 However, it is important to note that most VTE events occur in inpatient settings or within a few weeks of discharge. This is despite the fact that the risk varies depending on additional factors such as cancer type, presence of a central venous catheter, and chemotherapy. Two retrospective cohort studies have established that a Khorana score of ≥2 predicts inpatient VTE.27,28 A recent prospective observational study named INDICATE study by Nichetti et al 21 showed a 95.4% NPV for VTE with a Khorana score of 0. However, it did not show any significant association of a higher Khorana VTE score with an increased VTE risk in hospitalized cancer patients. 21 In addition, the Khorana model does not take into account several inpatient biomarkers, except for hemoglobin and does not consider several other factors which have been linked to increased VTE risk in certain patient populations. 14 Previous research has demonstrated an increased risk of VTE in patients with chronic kidney disease (CKD), 29 end-stage renal disease on hemodialysis, 30 and renal transplant patients. 31 Therefore, we examined the relationship between renal disease and serum creatinine levels with the risk of VTE in our study population. Our findings showed that renal disease was associated with an increased risk of VTE, but serum creatinine levels were not.
Our study had several strengths, including large sample size, a specific focus on the risk of VTE among cancer patients in inpatient settings, examination of various biomarkers, and a detailed statistical analysis that included split-sample validation. However, we did identify some limitations. For example, unlike the Khorana study, we did not include the following risk factors for VTE in our analysis: prechemotherapy platelet count ≥350 × 10⁹/L, prechemotherapy leukocyte count >11 × 10⁹/L, and elevated BMI (BMI ≥35 kg/m²). Additionally, previous research has shown that serum creatinine and albumin creatinine ratios increase the risk of VTE, but we only used serum creatinine in this study. We also did not consider the specific chemotherapy agents used by the patients, which could potentially affect the risk of VTE. Finally, it should be noted that all the limitations of a retrospective study also apply to our study.
Conclusions
In conclusion, our research study found that very high-risk groups, high-risk groups, ones with low hemoglobin levels, and with renal disease have a statistically significant higher risk of developing VTE in the inpatient setting. Further studies are needed to identify additional VTE risk factors in hospitalized cancer patients. Our VTE RAM demonstrated a moderate discriminatory performance suggesting that it can distinguish between patients with and without VTE more often than it would by chance. In addition, our VTE RAM showed a high specificity and NPV, suggesting its utility in identifying hospitalized patients without risk for VTE and avoiding unnecessary prophylaxis. The PPV and sensitivity were low, likely due to low overall VTE prevalence. Further research is needed to confirm the effectiveness of this model in a larger population, compare it with other RAMs, such as the one developed by Nichetti et al and Khorana et al, external cohorts, and address the limitations of our study.
Supplemental Material
sj-docx-1-cat-10.1177_10760296231206808 - Supplemental material for Venous Thromboembolism Risk Assessment in Hospitalized Cancer Patients: A Single Center Study
Supplemental material, sj-docx-1-cat-10.1177_10760296231206808 for Venous Thromboembolism Risk Assessment in Hospitalized Cancer Patients: A Single Center Study by Supratik Rayamajhi, Shiva Shrotriya, Manoj Rai, Prajwal Dhakal, Nishraj Basnet, Mukta Sharma, Alexa Lupi and Joseph Gardiner in Clinical and Applied Thrombosis/Hemostasis
Footnotes
Author Contributions
This research project was collaboratively planned, conceived, and designed by SR and SS, who contributed equally and should be considered co-first authors. The data collection was executed by SS, PD, MR, NB and MS. Statistical analysis was performed by JG and AL. All authors actively participated in writing and revising the manuscript.
Data Availability Statement
Any inquiries, including requests for additional data or clarification on data usage, should be directed to the corresponding author.
Declaration of Conflicting Interests
The authors declared no potential conflicts of interest with respect to the research, authorship, and/or publication of this article.
Ethics Approval
Our study followed ethical guidelines and was approved by the Michigan State University Human Research Protection Program. The IRB did not require individual patient consent.
Funding
The authors received no financial support for the research, authorship, and/or publication of this article. All resources, time, and efforts dedicated to the project were provided voluntarily by the authors and the affiliated institutions. The work conducted and the resulting publication were not influenced by any funding agency or external financial support.
Supplemental Material
Supplemental material for this article is available online.
References
Supplementary Material
Please find the following supplemental material available below.
For Open Access articles published under a Creative Commons License, all supplemental material carries the same license as the article it is associated with.
For non-Open Access articles published, all supplemental material carries a non-exclusive license, and permission requests for re-use of supplemental material or any part of supplemental material shall be sent directly to the copyright owner as specified in the copyright notice associated with the article.