
Abstract
Preeclampsia (PE) is associated with endothelial injury and hemostatic abnormalities. However, the diagnostic role of coagulation parameters and natural anticoagulants in predicting PE has not been explored in Ghana. This study assessed plasma levels of these factors as surrogate markers of PE and its subtypes. This case–control study included 90 women with PE (cases) and 90 normotensive pregnant women (controls). Blood samples were drawn for the estimation of complete blood count and coagulation tests. The prothrombin time (PT), activated partial thromboplastin time (APTT), and the calculation of the international normalized ratio (INR) were determined by an ACL elite coagulometer while the levels of protein C (PC), protein S (PS), antithrombin III (ATIII), and D-dimers were also measured using the solid-phase sandwich enzyme-linked immunosorbent assay (ELISA) method. All statistical analyses were performed using the R Language for Statistical Computing. Results showed significantly (p < .05) shortened APTT (28.25 s) and higher D-dimer levels (1219.00 ng/mL) among PE women, as well as low levels of PC (1.02 µg/mL), PS (6.58 µg/mL), and ATIII (3.99 ng/mL). No significant difference was found in terms of PT and INR. From the receiver operating characteristic analysis, PC, PS, and ATIII could significantly predict PE and its subtypes at certain cutoffs with high accuracies (area under the curve [AUC] ≥0.70). Most women with PE are in a hypercoagulable state with lower natural anticoagulants. PC, PS, and ATIII are good predictive and diagnostic markers of PE and its subtypes (early-onset PE [EO-PE] and late-onset PE [LO-PE]) and should be explored in future studies.
Keywords
Background
Preeclampsia (PE) is defined as hypertension arising after 20 weeks of gestational age with proteinuria or other signs of end-organ damage. 1 PE is a leading cause of feto-maternal mortality worldwide and a serious obstetric condition affecting 2%-5% of all pregnancies. 2 The incidence rate of PE has been reported to be 6.55%-7.03% among Ghanaian pregnant women. 3 Although the cause of PE is unknown, abnormal placentation appears to play a role in the condition's pathogenesis, resulting in symptoms such as exaggerated inflammatory response, vasoconstriction, endothelial damage, hypercoagulability, and platelet dysfunction. 4 Pro-angiogenic factors, placental hypoxia, immune dysfunction, altered placental enzymes, and thrombophilia are among the mechanisms thought to play a major role in the development and progression of PE. 5
Normal pregnancy is associated with increased levels of a number of clotting and angiogenic factors, particularly factors VII, VIII, X, von Willebrand factor, and fibrinogen. 6 These changes primarily serve as a protective mechanism to reduce bleeding during childbirth; however, the hypercoagulable states that result may increase the risk of venous thromboembolic disease during pregnancy. 7 The balance of coagulation and anticoagulation is critical for pregnant women's uteroplacental circulation and organ perfusion. 8 The coagulation–fibrinolytic system is thought to be one of the most severely affected systems in PE patients by maternal inflammatory reactions and immune dysfunction. 9 The presence of small placental thrombi in preeclamptic women suggests that, in addition to the thrombotic nature of placental vasculature, predisposing factors to thrombosis may cause or contribute to the development of PE. 10 It has been reported that the risks of thromboembolic disease are increased during pregnancy in pregnancies complicated by PE, 6 most likely due to additional changes in clotting and angiogenic factors. 11 Even though PE and its association remain controversial, women with PE have a higher prevalence of inherited and acquired thrombophilia than non-preeclamptic women.12,13
PE diagnosis is currently based on the presence of clinical symptoms, such as hypertension, proteinuria, and other related symptoms, and may thus occur at a relatively late stage. These indicators are insufficient to provide a reliable guide for optimal delivery timing to maximize the chances of a viable fetus, 14 and reliance on symptomology can lead to inappropriate under- or overtreatment. 15
Some studies have found a coagulation–fibrinolysis imbalance in PE, which leads to multiple organ dysfunctions.16,17 Coagulation factors have been implicated in placental hemostasis and blood vessel differentiation, with changes in blood–coagulation–proteins and endothelial function being prominent features of PE. 15 However, the extent of the coagulation problems caused by PE is unknown. Several studies have found that preeclamptic mothers have prolonged prothrombin time (PT) and activated partial thromboplastin time (APTT),18–22 increased D-dimer levels,8,17,20,23,24 and decreased levels of natural coagulation inhibitors: antithrombin III (ATIII), protein S (PS), and protein C (PC).25–29 Despite the evidence of dysregulated coagulation parameters and natural anticoagulants in PE, the diagnostic potential of these parameters in predicting PE has not been explored among Ghanaian pregnant women which is a concerning limitation. This study thus aimed to assess the plasma levels of coagulation parameters and natural anticoagulants as surrogate markers of PE and its subtypes among pregnant women in Kumasi, Ghana. The association of these coagulation factors with PE, if found, will improve the understanding of the pathogenesis of PE and shed light on coagulation co-morbidities that compound PE. It will also support the development of health policy, such as early effective prophylactic treatment and management strategies for PE.
Materials and Methods
Study Design/Setting
This hospital-based case–control study was conducted at the Obstetrics and Gynaecological Directorate of the Komfo Anokye Teaching Hospital (KATH) in the Ashanti Region of Ghana between August and December 2022. A total of 180 pregnant women comprising 90 confirmed PE cases and 90 normotensive controls were recruited. KATH is the second largest tertiary hospital in Ghana with a 1200-bed capacity. It serves as a major referral center for the middle belt and northern part of Ghana. The hospital also receives referrals from other regions, and this gives fair representation of the Ghanaian population.
Ethical Consideration
The study approval was given by the Committee on Human Research, Publications and Ethics (CHRPE), School of Medicine and Dentistry, Kwame Nkrumah University of Science and Technology (KNUST), and the KATH (KATH IRB/AP/057/21). Written informed consent was obtained from all participants before the commencement of the study. Participation was voluntary, and respondents were assured that the information obtained was strictly for research and academic purposes only and were guaranteed the liberty to opt out of the study at their own convenience. Strict measures ensured confidentiality and privacy, with anonymized and securely stored data accessible only to authorized researchers involved in this study. This study was conducted in accordance with the guidelines of the Helsinki Declaration. 30
Study Population and Subject Selection
A total of 200 pregnant women were interviewed, of which 180 pregnant participants comprising 90 preeclamptics (cases) and 90 healthy normotensives (controls) matched for age and gestational age were recruited using a simple random sampling method. Sociodemographic characteristics (age, marital status, level of education, and occupation), obstetric characteristics (gravidity, parity, and gestational age), and clinical history (weight, height, systolic blood pressure, and diastolic blood pressure) were collected from participants using a pretested questionnaire and patient folders and finally confirmed with the hospital health information management system (LHIMS). Pregnant women aged 23–36 years who were at or after 20 weeks gestation and attending regular antepartum care were included as both case and control groups. Pregnant women who met the criteria for PE were considered as cases. Twenty (20) of the pregnant women with twin pregnancies, any hematological diseases, previous history of hemostatic disorders, family history of bleeding, pre-existing renal or hepatic disease, viral hepatitis infection, past record of anticoagulant drug use, oral contraceptive use, smoking record, abnormal obstetric history, and any known chronic conditions and did not give consent for the study were excluded for both groups.
Blood Pressure Measurement
The blood pressure of participants was measured by trained medical personnel using an automated blood pressure recorder (Omron MX3-Omron Matsusaka Co., Ltd, Japan) from the right arm in accordance with recommendations of the American Heart Association. 31 Repeated measurements were taken within 5–10 min rest interval, and the mean value was recorded as blood pressure.
Urine Collection and Proteinuria Estimation
Participants were asked to provide 10−15 mL of early morning urine in sterile leak-proof containers. Proteinuria was measured using a urine reagent dipstick (a semi-quantitative color scale on the URIT 2VPG Medical Electronic Co., Ltd, China). These strips categorize proteinuria as negative, trace, 0.3 g/L, 1.0 g/L, or 3.0 g/L, corresponding to negative, trace, 1+, 2+, and 3+, respectively; a positive test was considered to be ≥0.3 g/L (≥1+). 32
Diagnostic Criteria
PE was diagnosed based on the revised definition by the International Society for the Study of Hypertension in Pregnancy (ISSHP) as a new onset of gestational hypertension (≥140 mmHg systolic/≥90 mmHg diastolic) developed at or after 20 weeks gestation and with new onset of at least either one of proteinuria (spot check urine protein >30 mg/mmol [0.3 mg/mg] or >300 mg/day or at least 1 g/L [“2+” using dipstick testing]) or without proteinuria but the involvements of maternal organ dysfunctions (neurological complications, pulmonary edema, hematological complications, liver involvement, or acute kidney injury) and/or uteroplacental dysfunction. 33
Early-onset PE (EO-PE) was defined as PE occurring at <34 weeks gestation, whereas late-onset PE (LO-PE) was defined as PE occurring at ≥34 weeks gestation. 34 The clinical diagnosis of participants was confirmed by an obstetrician or gynecologist before they were included in the study.
Sample Collection and Assay
After informed consent had been obtained from all participants, 6 mL of venous blood samples were drawn from each patient under aseptic conditions for laboratory assessment. In total, 2.4 mL was kept in 2.0 mg/mL EDTA-2K tube and preserved at 37 °C for complete blood count (CBC) measurement using the Sysmex XN-2000 5-part automated hematology analyzer (Sysmex Inc., Kobe, Japan). Malaria, sickling slide test, erythrocyte sedimentation rate, and hemoglobin electrophoresis test were done afterward on all samples to rule out sickle cell disease and any inflammatory reactions. A 3.6 mL blood sample for coagulative function factors was collected into a vacuum tube (blue cap) containing sodium citrate in a 9:1 volume ratio. Platelet poor plasma (PPP) was obtained by centrifugation at 3000 g for 15 min at room temperature, and plasma supernatant aliquoted into 4 parts was frozen at −80 °C until assayed. PC and PS, ATIII, and D-dimer tests were performed using a solid phase sandwich human specific enzyme-linked immunosorbent assay (ELISA) method (R&D Systems, USA) adhering to the manufacturer’s instruction.
Analysis of PT, APTT test, and international normalized ratio (INR) calculation were performed using an ACL elite coagulometer (Instrumentation Laboratory Company, Bedford, USA). The fibrinogen was quantitated by relating the absorbance or light scatter during clotting to a calibrator, and the time was displayed. All tubes were mixed by inverting the tubes 5–10 times immediately after the blood draw and were sent to the hematology unit laboratory of the KATH for analysis. The standard operating procedures at the laboratory were strictly followed throughout specimen collection and analysis.
Statistical Analysis
The collected data obtained were entered, edited, cleaned, and coded in Microsoft Excel 2019. All statistical analyses were performed using the R Language for Statistical Computing. Categorical variables were analyzed using Chi-squared and Fisher's tests, and data were presented as frequencies and percentages. Continuous variables were analyzed using the independent sample t-test, non-parametric Mann–Whitney U test, one-way analysis of variance (ANOVA) test, or Kruskal–Wallis test where appropriate. Continuous variables were summarized as mean ± standard deviation (SD) or median (interquartile range [IQR]) depending on the normality of the data. The receiver operating characteristic (ROC) analysis was performed to determine the diagnostic accuracies of coagulation parameters and natural anticoagulants in predicting PE and its subtypes (EO-PE and LO-PE). p-values of <.05 were considered statistically significant for all analyses.
Results
Table 1 shows the sociodemographic and clinical characteristics of the study groups. Although the PE women were significantly older than the controls (32.00 vs 29.00 years, p = .0080), there was no significant difference in gestational age (33.50 vs 34.00 weeks, p = .6290), gravidity (4.00 vs 3.00, p = .1000), and parity (2.00 vs 2.00, p = .6290) between the PE women and the controls. Marital status (p = .3000), educational levels (p = .7480), and occupation (p = .5980) were similar between the PE women and the controls. Both the systolic (p < .0001) and diastolic (p < .0001) blood pressures were significantly higher in PE women compared to the controls (Table 1).
Sociodemographic and Clinical Characteristics of the Study Groups.
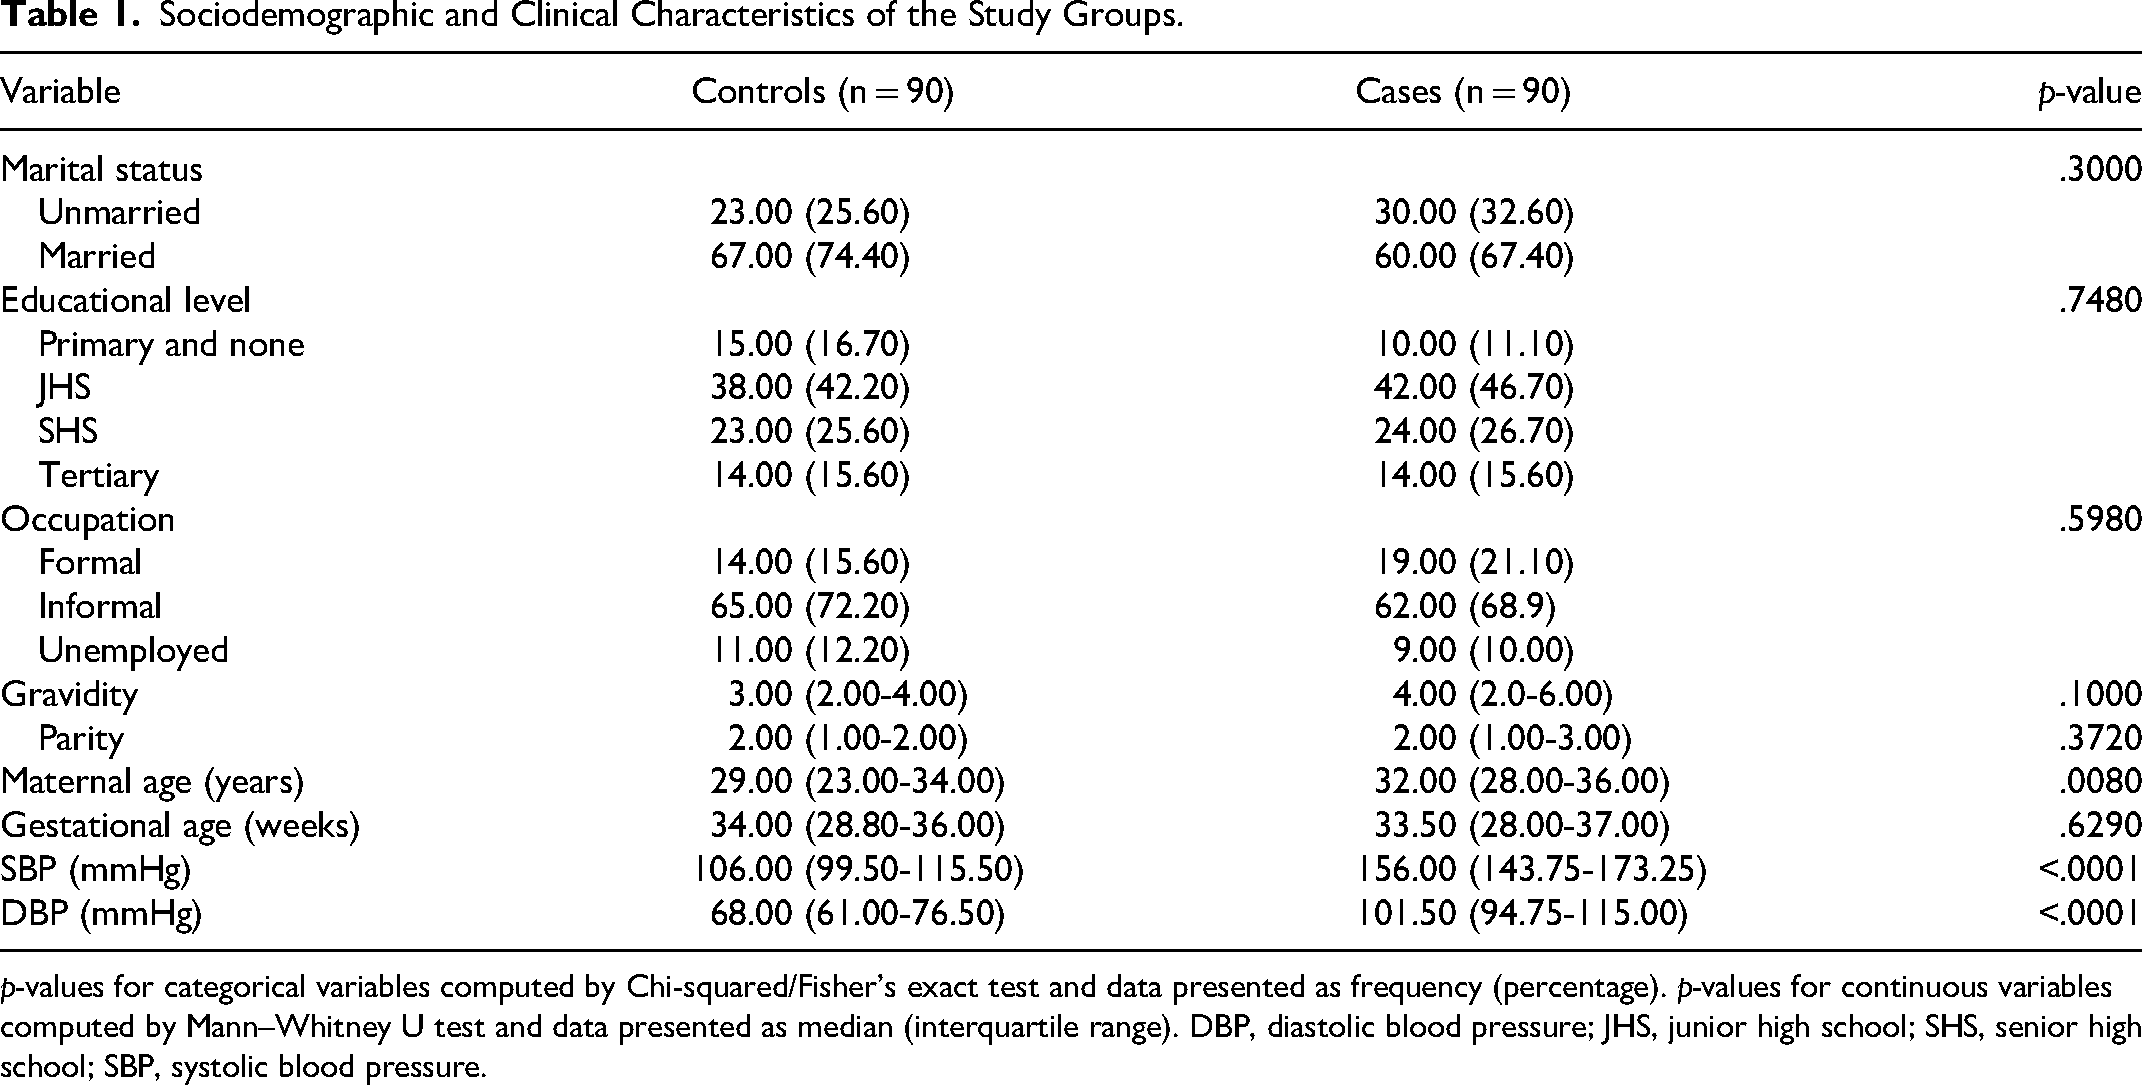
p-values for categorical variables computed by Chi-squared/Fisher's exact test and data presented as frequency (percentage). p-values for continuous variables computed by Mann–Whitney U test and data presented as median (interquartile range). DBP, diastolic blood pressure; JHS, junior high school; SHS, senior high school; SBP, systolic blood pressure.
Table 2 shows the comparison of hematological parameters between study groups. The red cell parameters, red blood cell (RBC) count (3.92 ± 0.99 × 10⁹/L vs 4.12 ± 0.66 × 10⁹/L, p = .0020), hemoglobin concentration (10.68 ± 1.18 vs 11.77 ± 1.92 g/dL, p < .0001), and hematocrit (HCT) (31.58 ± 3.33% vs 34.01 ± 5.29%, p < .0001) were significantly lower in women with PE compared to the controls. There was no significant difference in red cell indices; mean cell volume (MCV), mean cell hemoglobin (MCH), mean cell hemoglobin concentration (MCHC), and other red cell parameters (red cell distribution width [RDW]-SD) and RDW-coefficient of variation [CV]) between the PE women and the controls (p > .05). The white blood cell (WBC) count (8.67 (6.89-11.71) × 106/µL vs 7.66 (6.35-8.70) × 106/µL, p < .0001), neutrophil count (6.04 (4.13-8.38) × 106/µL vs 4.97 (4.24-5.64) × 106/µL, p = .0010), and eosinophil count (0.09 (0.05-0.18) × 106/µL vs 0.04 (0.00-0.08) × 106/µL, p < .0001) were significantly higher in women with PE compared to the controls. There was no significant difference in lymphocyte count, monocyte count, and basophil count between the PE women and the controls (p > .05). Similarly, the platelet parameters, platelet count (PLT), platelet distribution width (PDW), mean platelet volume (MPV), platelet large cell ratio (PLCR), and plateletcrit (PCT), did not differ significantly between the women with PE and the controls (p > .05) (Table 2).
Levels of Hematological Parameters Between the PE Women and the Controls.

p-values were computed using the independent samples t-test and data presented as mean ± standard deviation or the Mann–Whitney U test and data presented as median (interquartile range) where appropriate.
RBC: red blood cell; HB: hemoglobin concentration; HCT: hematocrit; MCV: mean cell volume; MCH: mean cell hemoglobin; MCHC: mean cell hemoglobin concentration; RDW-SD: red cell distribution width–standard deviation; RDW-CV: red cell distribution width–coefficient of variation; WBC: white blood cell; PLT: platelet count; PDW: platelet distribution width; MPV: mean platelet volume; PLCR: platelet large cell ratio; PCT: plateletcrit.
Figure 1 shows the comparison of levels of coagulation parameters and natural anticoagulants between PE women and controls. The plasma APTT (Figure 1B) was significantly shortened in the PE women compared to the controls (28.25 vs 30.00 s, p < .0001). However, the plasma levels of D-dimers (Figure 1D) were significantly higher in the PE women compared to the controls (1219.00 vs 988.65 ng/mL, p = .0210). There was no significant difference in PT (Figure 1A) and INR (Figure 1C) between PE women and the controls (p > .05) (Figure 1).

Levels of coagulation parameters between preeclampsia (PE) women and the controls.
Figure 2 shows the serum levels of PC (Figure 2A to D) (1.02 vs 1.72 µg/mL, p < .0001), PS (Figure 2B to E) (6.58 vs 10.66 µg/mL, p < .0001), and ATIII (Figure 2C to F) (3.99 vs 9.19 ng/mL, p < .0001) were significantly lower in the PE women compared to the controls (Figure 2).

Levels of natural anticoagulants between preeclampsia (PE) women and controls.
Table 3 shows the levels of hematological parameters between pregnant women with EO-PE and LO-PE compared to the controls. The RBC count was significantly higher in LO-PE compared to the controls (p < .05) but did not differ significantly between EO-PE women and controls (p > .05) or between EO-PE and LO-PE women (p > .05). The hemoglobin (Hb) was significantly lower in EO-PE (p < .05) and LO-PE (p < .05) women compared to the controls but did not differ significantly between EO-PE and LO-PE women (p > .05). Similarly, the HCT was significantly lower in EO-PE (p < .05) and LO-PE (p < .05) women compared to the controls but did not differ significantly between EO-PE and LO-PE women (p > .05). There was no significant difference in red cell indices, MCV, MCH, MCHC, and other red cell parameters (RDW-SD and RDW-CV), between the 3 groups (p > .05).
Hematological Parameters Between Early-Onset PE and Late-Onset PE Women Compared to the Controls.

RBC: red blood cell; HB: hemoglobin concentration; HCT: hematocrit; MCV: mean cell volume; MCH: mean cell hemoglobin; MCHC: mean cell hemoglobin concentration; RDW-SD: red cell distribution width–standard deviation; RDW-CV: red cell distribution width–coefficient of variation; WBC: white blood cell; PLT: platelet count; PDW: platelet distribution width; MPV: mean platelet volume; PLCR: platelet large cell ratio; PCT: plateletcrit.
p-values were computed using the one-way ANOVA and data presented as mean ± standard deviation or the Kruskal–Wallis test and data presented as median (interquartile range) where appropriate.
Significant difference between controls and EO-PE.
Significant difference between controls and LO-PE.
Significant difference between EO-PE and LO-PE.
Moreover, the WBC count was significantly higher in EO-PE compared to LO-PE women and the controls (p < .05) but was similar between LO-PEs and the controls (p > .05). Similarly, the neutrophil count was significantly higher in EO-PE compared to LO-PE women and the controls (p < .05) but was similar between LO-PEs and the controls (p > .05). The eosinophil count was significantly higher in EO-PE (p < .05) and LO-PE (p < .05) women compared to the controls but did not differ significantly between EO-PE and LO-PE women (p > .05).
The platelet count was significantly lower in EO-PE compared to LO-PE women and the controls (p < .05) but was similar between LO-PE and the controls (p > .05) (Table 3).
Figure 3 shows the comparison of levels of coagulation parameters and natural anticoagulants between pregnant women with EO-PE, LO-PE, and controls. The APTT (Figure 3B) was significantly shortened in EO-PE (p < .05) and LO-PE (p < .001) women compared to the controls but did not differ significantly between EO-PE and LO-PE women (p > .05). Plasma D-dimers (Figure 3D) were significantly higher in EO-PE women compared to the controls (p < .05) but did not differ between LO-PE and the controls or between EO-PE and LO-PE (p > .05). The PT (Figure 3A) and INR (Figure 3C) did not differ significantly between EO-PE, LO-PE, and the controls (Figure 3).
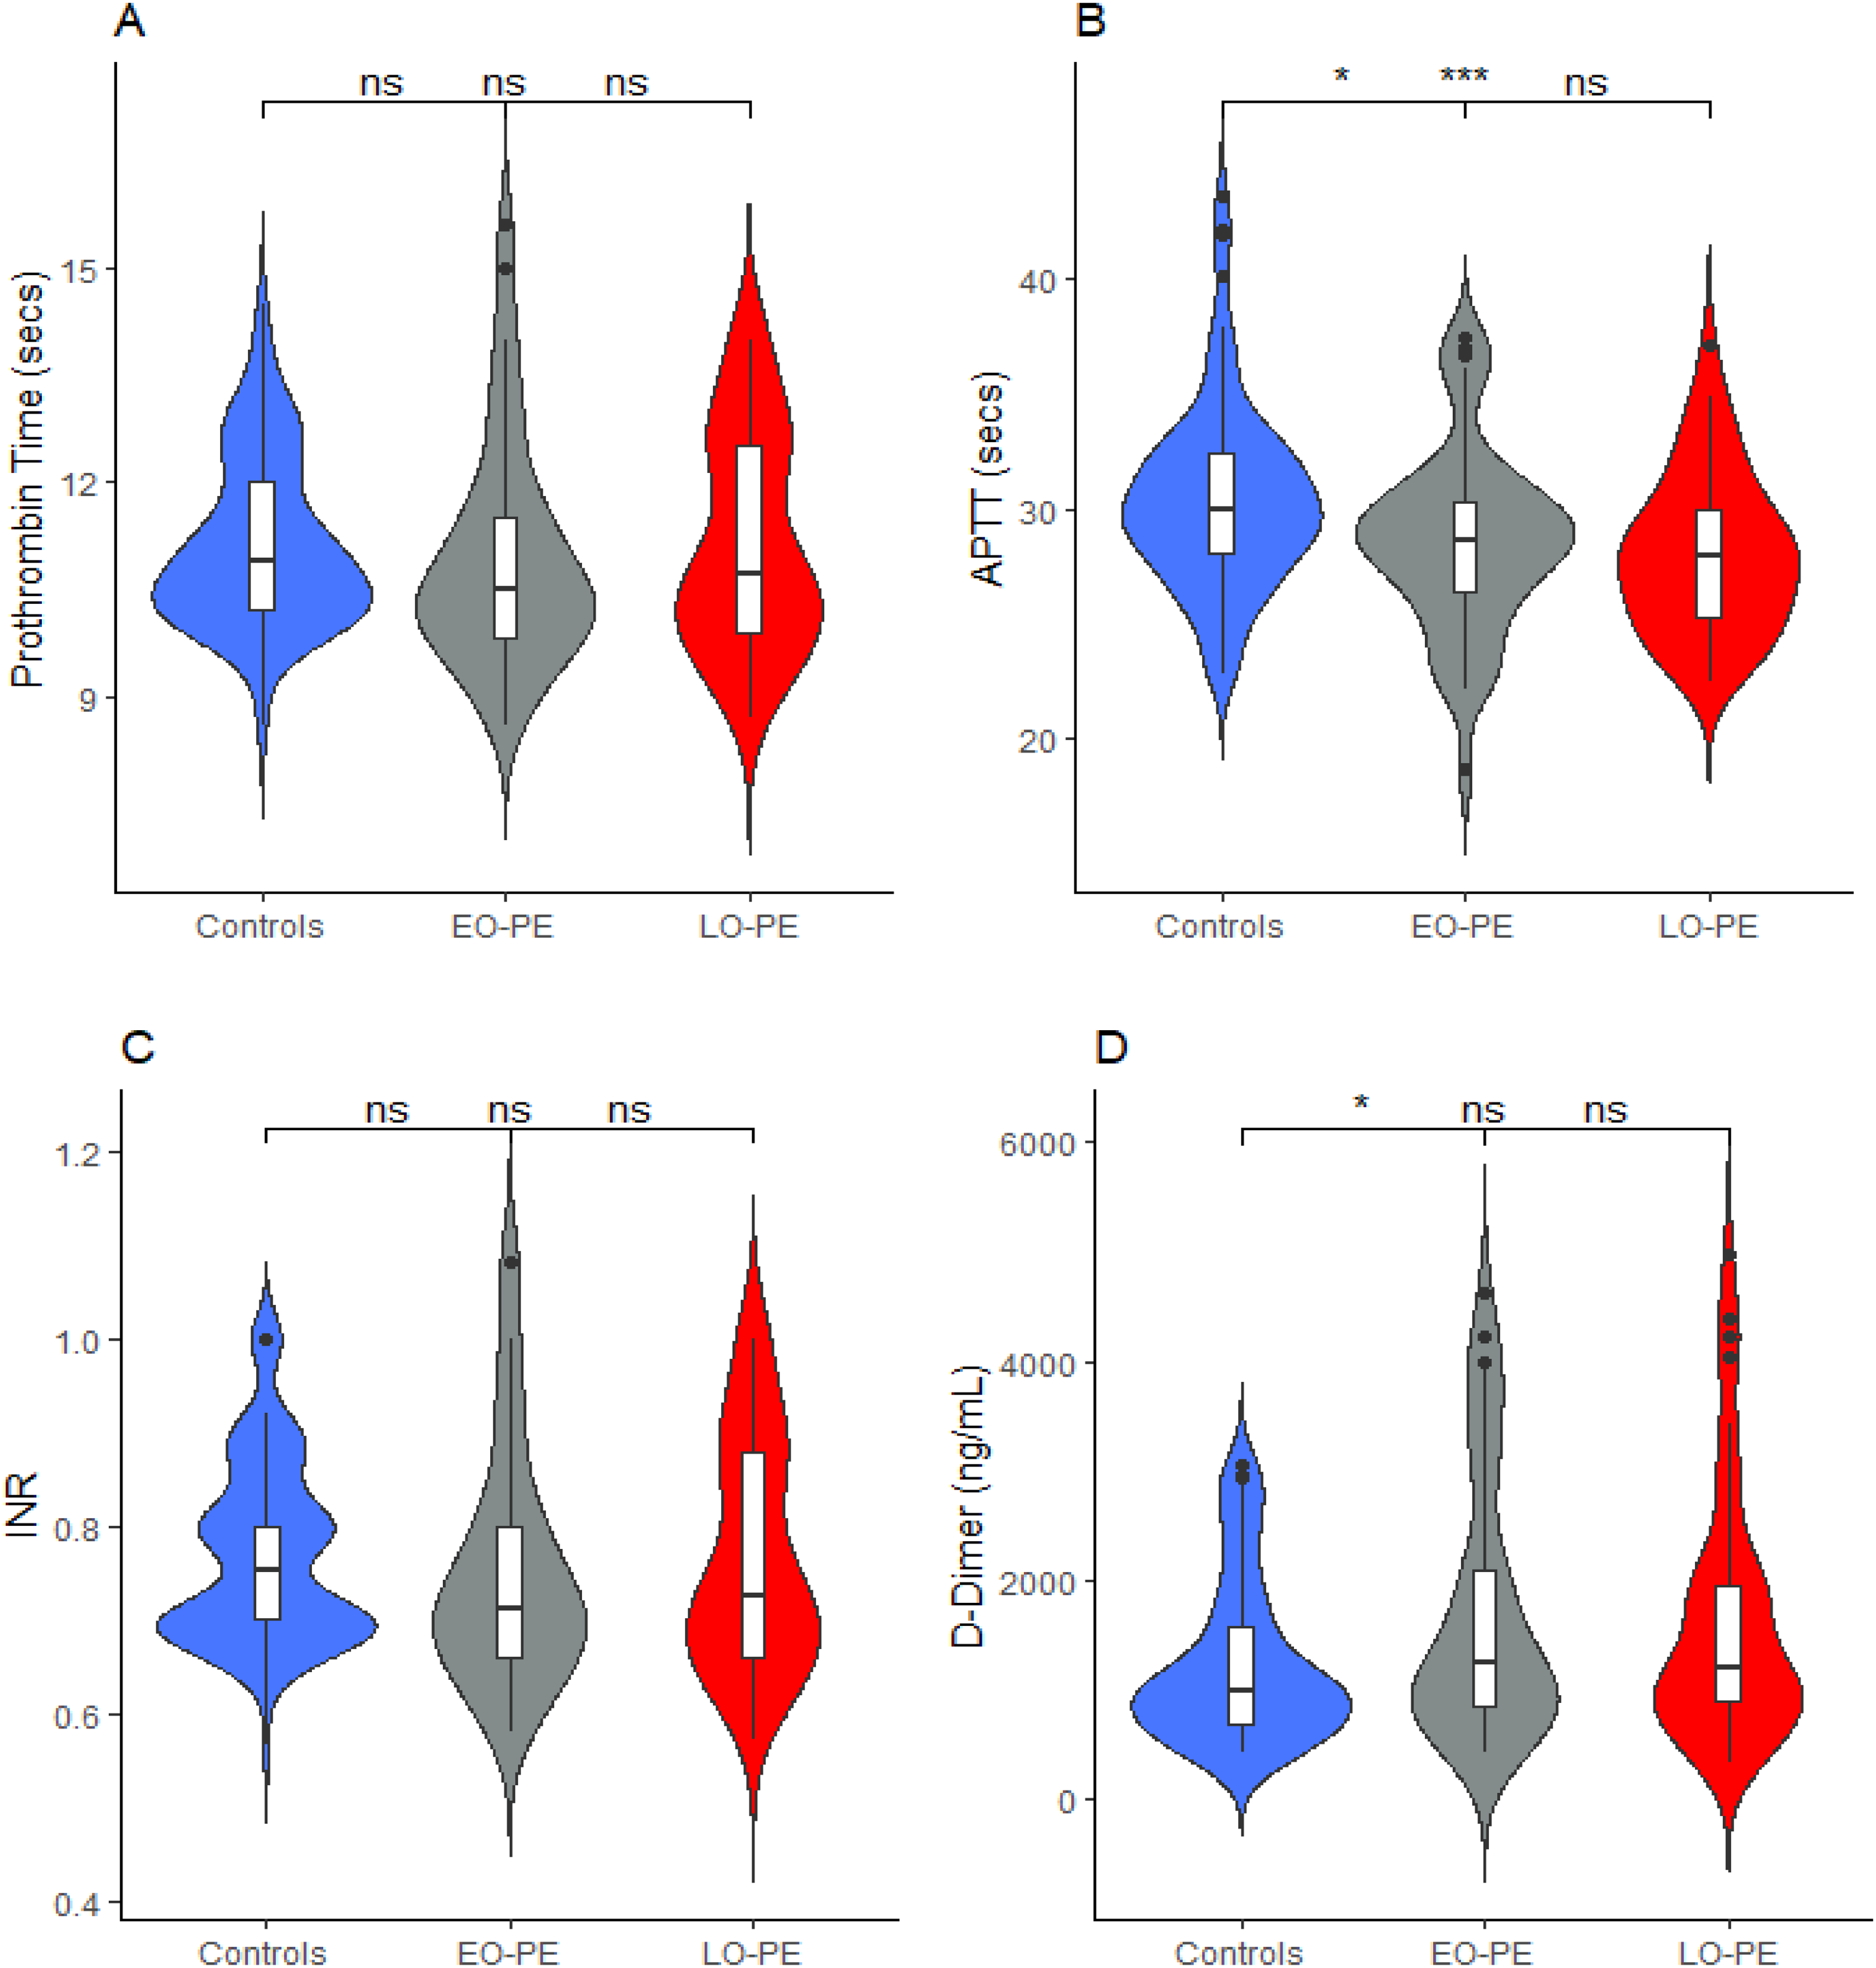
Levels of coagulation parameters between pregnant women with early-onset preeclampsia (EO-PE), late-onset pre-eclampsia (LO-PE), and controls.
Figure 4 shows the levels of natural anticoagulants between pregnant women with EO-PE, LO-PE, and controls. The serum levels of PC (Figure 4A) were significantly lower in EO-PE (p < .0001) and LO-PE (p < .0001) women compared to the controls but did not differ significantly between EO-PE and LO-PE women (p > .05). Similarly, PS (Figure 4B) was significantly lower in EO-PE (p < .0001) and LO-PE (p < .0001) women compared to the controls but did not differ significantly between EO-PE and LO-PE women (p > .05). Again, the serum levels of ATIII (Figure 4C) were significantly lower in EO-PE (p < .0001) and LO-PE (p < .0001) women compared to the controls but did not differ significantly between EO-PE and LO-PE women (p > .05) (Figure 4).

Levels of natural anticoagulants between pregnant women with early-onset preeclampsia (EO-PE), late-onset preeclampsia (LO-PE), and controls.
Figure 5 and Table 4 show the diagnostic potential of coagulation parameters and natural anticoagulants in predicting PE as predicted by ROC analysis. PC (area under the curve [AUC] = 0.73, p < .0001), PS (AUC = 0.72, p < .0001), and ATIII (AUC = 0.77, p < .0001) could significantly predict PE with high accuracies. At a cutoff of ≤1.53 µg/mL, PC could significantly predict PE with a sensitivity of 90.0% and a specificity of 54.4%. At the same cutoff, PC was associated with over 10 times chances of predicting PE (adjusted odds ratio [aOR] = 10.36, 95% confidence interval (CI) (4.62-23.23), p < .0001). At a cutoff of ≤9.47 µg/mL, PS was 77.70% sensitive and 66.70% specific in predicting PE. At the same cutoff, PS was associated with an over 6-fold higher chance of predicting PE (aOR = 6.25, 95% CI (3.16-12.35), p < .0001). Moreover, at a cutoff of ≤6.53 ng/mL, ATIII could significantly predict PE with a sensitivity and specificity of 74.40%. ATIII levels ≤6.53 ng/mL were associated with about 8 times higher chances of predicting PE (aOR = 7.94, 95% CI (3.99-15.82), p < .0001). Although APTT (AUC = 0.65, p = .0001) and D-dimers (AUC = 0.59, p = .017) could significantly predict PE, they had a weak performance (Figure 5 and Table 4).

Receiver operating characteristic (ROC) curves of coagulation parameters and natural anticoagulants in predicting preeclampsia (PE).
Diagnostic Accuracies of Coagulation Parameters and Natural Anticoagulants in Predicting PE.

Multivariate logistic regression adjusted for maternal age, gestational age, and weight.
APTT: activated plasma thromboplastin time; ATIII: antithrombin III; CI: confidence interval; PPV: positive predictive value; NPV: negative predictive value; aOR: adjusted odds ratio.
Figures 6 and 7 and Table 5 show the diagnostic potential of coagulation parameters and natural anticoagulants in predicting EO-PE. In an ROC analysis, PC (AUC = 0.75, p < .0001), PS (AUC = 0.73, p < .0001), and ATIII (AUC = 0.72, p < .0001) could significantly predict EO-PE with high accuracies. Figure 8 displays the ROC curves of coagulation parameters and natural anticoagulants in predicting EO-PE. At a cutoff of ≤1.32 µg/mL, PC could significantly predict EO-PE with a sensitivity of 86.60% and a specificity of 54.40%. At the same cutoff, PC was associated with over a 15 times chance of predicting EO-PE (aOR = 15.05, 95% CI [4.80-47.16], p < .0001). At a cutoff of ≤9.45 µg/mL, PS was 77.7% sensitive and 71.6% specific in predicting EO-PE. At the same cutoff, PS was associated with over 11-fold higher chances of predicting EO-PE (aOR = 11.15, 95% CI [3.97-31.27], p < .0001). Moreover, at a cutoff of ≤6.78 ng/mL, ATIII could significantly predict EO-PE with a sensitivity of 72.80% and a specificity of 74.30%. ATIII levels ≤6.78 ng/mL were associated with over a 9 times higher chance of predicting EO-PE (aOR = 9.08, 95% CI [3.44-23.94], p < .0001). Although APTT (AUC = 0.62, p = .0090) and D-dimers (AUC = 0.60, p = .0390) could significantly predict EO-PE, they had a weak performance. APTT was less specific (46.60%) while D-dimers were less sensitive (55.50%) (Figures 6 and 7, Table 5).

Receiver operating characteristic (ROC) curves of coagulation parameters and natural anticoagulants in predicting early-onset preeclampsia (EO-PE).

Receiver operating characteristic (ROC) curve of D-dimer in predicting early-onset preeclampsia (EO-PE).

Receiver operating characteristic (ROC) curves of coagulation parameters and natural anticoagulants in predicting late-onset preeclampsia (LO-PE).
Diagnostic Accuracies of Coagulation Parameters and Natural Anticoagulants in Predicting Early-Onset Preeclampsia.

Multivariate logistic regression adjusted for maternal age, gestational age, and weight.
APTT: activated plasma thromboplastin time; ATIII: antithrombin III; CI: confidence interval; PPV: positive predictive value; NPV: negative predictive value; aOR: adjusted odds ratio.
Figures 8 and 9 and Table 6 show the diagnostic potential of coagulation parameters and natural anticoagulants in predicting LO-PE. In an ROC analysis, PC (AUC = 0.71, p < .0001), PS (AUC = 0.71, p < .0001), and ATIII (AUC = 0.80, p < .0001) could significantly predict LO-PE with high accuracies. Figure 9 displays the ROC curves of coagulation parameters and natural anticoagulants in predicting LO-PE. At a cutoff of ≤1.32 µg/mL, PC could significantly predict LO-PE with a sensitivity of 84.40% and a specificity of 68.80%. At the same cutoff, PC was associated with over a 4 times chance of predicting LO-PE (aOR = 4.63, 95% CI [1.65-12.99], p = .0040). At a cutoff of ≤9.47 µg/mL, PS was 77.70% sensitive and 66.80% specific in predicting LO-PE. At the same cutoff, PS was associated with about a 4-fold higher chance of predicting LO-PE (aOR = 3.81, 95% CI [1.48-9.83], p < .0040). Moreover, at a cutoff of ≤7.32 ng/mL, ATIII could significantly predict LO-PE with a sensitivity of 88.80% and a specificity of 78.60%. At a cutoff of ≤7.32 ng/mL, ATIII was associated with over a 13 times higher chance of predicting LO-PE (aOR = 13.29, 95% CI [4.35-40.55], p < .0001). APTT (AUC = 0.68, p = .003) could significantly predict LO-PE, with a sensitivity of 64.40% and a specificity of 70.00%. D-dimer (AUC = 0.59, p = .0867), however, could not significantly predict LO-PE (Figures 8 and 9, Table 6).

Receiver operating characteristic (ROC) curve of D-dimer in predicting late-onset preeclampsia (LO-PE).
Diagnostic Accuracies of Coagulation Parameters and Natural Anticoagulants in Predicting Late-Onset Preeclampsia.

Multivariate logistic regression adjusted for maternal age, gestational age, and weight.
APTT: activated plasma thromboplastin time; ATIII: antithrombin III; CI: confidence interval; PPV: positive predictive value; NPV: negative predictive value; aOR: adjusted odds ratio.
Discussion
PE is a pregnancy-related condition linked with increased systemic vascular resistance, endothelial cell dysfunction, and hematological abnormalities during pregnancy. 35 The measurement of these aberrant values is a useful predictor of PE.36,37 Pregnancy causes hematologic alterations such as reduced hemoglobin, increased MCV, leukocytosis, neutrophilia, and mild thrombocytopenia. 38 Although proteinuria is the most prevalent laboratory indicator of PE, additional alterations (thrombocytopenia, neutrophilia, and an increase in HCT) may also be seen in a regular CBC. 17 As a result, various studies have been done to evaluate the potential detection or prediction of PE utilizing CBC indices.39–41 Derangements in the intrinsic and extrinsic coagulation pathways, as well as decreased levels of coagulation inhibitors, can also cause hypercoagulation. 42 This case–control study aimed to assess plasma levels of coagulation parameters and their natural inhibitors as potential predictive markers of PE.
In this study, a significantly (p < .05) shortened APTT and higher levels of D-dimers were found among women with PE (cases) compared to the normotensives (controls). During PE, multiple hematological alterations occur in the body of which thrombocytopenia is the most prevalent; thus, PT and APTT tend to increase. 43 In a study by Khan et al., 43 shortened APTT in women with PE was found during late pregnancy as compared to early pregnancy. It is possible that the time point at which APTT was measured in our study affected its activity in PE women. Even though maternal D-dimer concentrations grow progressively from conception to delivery in normal pregnancy, 9 some studies found higher D-dimer concentrations in pregnant women with PE compared to normotensive women.17,44 Furthermore, D-dimer has been shown to be involved in the dynamic balance of plasminogen activators (t-PA and uPA) and plasminogen inhibitors (PAI-1) in women with PE, 45 suggesting that its concentration can reflect dynamic changes in both the hypercoagulable and activated fibrinolytic states in PE patients.
Inflammation and coagulation are intertwined, and it has been shown that the coagulation system is active in PE. 46 In this study, the coagulation parameter APTT was shortened while plasma levels of D-dimer were also higher among women with EO-PE and LO-PE as compared to the controls. These findings are consistent with the result from a previous study. 46 The comparable D-dimer levels observed in women with EO-PE and those with LO-PE could be partly explained by the fact that EO-PE and LO-PE originate from the same challenge, and so, their outcomes overlap, accounting for the similar influence on the coagulation system. 47 However, the significant difference observed between EO-PE and the controls but not the LO-PE and controls could also be attributed to the fact that EO-PE pregnancies are typically more severe and have adverse maternal outcomes than LO-PE pregnancies. 47
Moreover, the levels of the anticoagulants, PC, PS, and ATIII, were lower among women with PE compared to the controls. In harmony with these current findings, a study by Demir and Dilek 48 reported significantly lower levels of PC, PS, and ATIII among women with PE. The significantly lower levels of PC, PS, and ATIII in the current and previous studies suggest that PE favors coagulation depicted by lower anticoagulant levels. Similarly, low levels of PC, PS, and ATIII were found among women with EO-PE and LO-PE compared to the normotensives (controls). This finding is consistent with the findings reported by Boij et al. 46 We deduce that decreased levels of the anticoagulation factors in the case group (PE), regardless of the PE subgroup, and presumably an increase in the coagulation factors resulted in a shortened APTT.
The diagnostic potential of coagulation parameters and natural anticoagulants was investigated to predict PE and its subtypes (EO-PE and LO-PE). In the ROC analyses for PE, PC, PS, and ATIII were found to be the best predictors and significantly predicted PE. At a cutoff of ≤6.53 ng/mL (AUC = 0.77, p < .0001), ATIII was observed as the best predictor for PE followed by PC at ≤1.53 µg/mL cutoff (AUC = 0.73, p < .0001) and PS at ≤9.47 µg/mL cutoff (AUC = 0.72, p < .0001). To our knowledge, previous studies have focused on the diagnostic potential of coagulation and natural anticoagulants in predicting PE only,8,49 but not EO-PE and LO-PE. Similarly, PC, PS, and ATIII were found to significantly predict EO-PE and proved to be the best predictors. At a cutoff of ≤1.32 µg/mL (AUC = 0.75, p < .0001), PC was observed as the best predictor for EO-PE followed by PS at ≤9.45 µg/mL cutoff (AUC = 0.73, p < .0001) and ATIII ≤6.78 ng/mL (AUC = 0.72, p < .0001). APTT and D-dimer were found to significantly predict EO-PE but had weak diagnostic accuracies. In another ROC analysis, all three anticoagulants were found to significantly predict LO-PE with high diagnostic accuracies in this study. Again, ATIII was found to be the best predictor at a cutoff of ≤7.32 ng/mL (AUC = 0.80). Even though APTT had a weak diagnostic potential for EO-PE and LO-PE, it was less specific (46.60%) in predicting EO-PE but was more specific in predicting LO-PE (70.00%). APTT could therefore be investigated for its potential as a late diagnostic marker of PE.
Despite the interesting findings in the present study, there were some limitations, especially the inability to determine the coagulation disorders associated with PE and its subtypes (EO-PE and LO-PE).
Conclusion
Most women with PE are in a hypercoagulable state, with lower natural anticoagulants, but less altered coagulation parameters. PC, PS, and ATIII are good predictive and diagnostic markers of PE and its subtypes (EO-PE and LO-PE), with ATIII being the best predictor of PE in general and LO-PE. Aside from routine antenatal tests such as CBC, this study strongly suggests that a profile of natural anticoagulants (PC, PS, and ATIII) will be useful in predicting and diagnosing PE and its subtypes EO-PE and LO-PE and should be recommended for pregnant women with or without history-based risk for PE worldwide. Further studies should be done on these parameters to shed light on coagulation co-morbidities that compound PE.
Footnotes
Acknowledgments
The authors are grateful to the staff of the Obstetrics and Gynaecology Directorate specifically the A1 ward and the antenatal clinic of the Komfo Anokye Teaching Hospital (KATH), Haematology Unit at KATH, and all who actively participated in the study.
Author Contribution
Availability of Data and Materials
All the necessary data are included in the manuscript.
Declaration of Conflicting Interests
The author(s) declared no potential conflicts of interest with respect to the research, authorship, and/or publication of this article.
Funding
The author(s) received no financial support for the research, authorship, and/or publication of this article.