
Abstract
The neutrophil-to-lymphocyte ratio (NLR) and platelet-to-lymphocyte ratio (PLR) are emerging tools that can be used in the diagnosis of deep venous thrombosis (DVT). This study aims to evaluate the diagnostic value of NLR and PLR for patients with DVT. Our meta-analysis included 11 eligible studies and extracted relevant diagnostic indicators. Of these studies, 4 focused on the NLR, 1 on the PLR, while 6 evaluated both. For the 10 studies on NLR, the pooled sensitivity, specificity, positive-likelihood ratio, and negative-likelihood ratio were 74%, 66%, 2.16, and 0.4, respectively. The estimated diagnostic odds ratio (DOR) was 5.3, and the area under the curve (AUC) of the summary receiver operating characteristic (SROC) curves was 0.74. For the 7 studies on the PLR, the pooled sensitivity, specificity, positive-likelihood ratio, and negative-likelihood ratio were 0.65, 0.77, 2.89, and 0.45, respectively. The estimated DOR was 6.64, and the SROC-AUC was 0.79. Our findings showed that the NLR and PLR exhibit moderate diagnostic accuracy and may be helpful biomarkers for the diagnosis of DVT. Future prospective, well-designed studies with large sample sizes will be required to provide additional evidence to establish cutoff values and clinical value of these indicators.
Introduction
Venous thromboembolism (VTE), which encompasses both pulmonary embolism (PE) and deep venous thrombosis (DVT), is the third most prevalent vascular disease worldwide, trailing only acute myocardial infarction and stroke and affecting approximately 10 million people annually. 1 The ageing population and increasing prevalence of VTE risk factors such as hypertension, hyperlipidemia, cancer, obesity, and smoking have led to a steady rise in the incidence of VTE. Furthermore, VTE incurs substantial annual economic costs, with estimates ranging from €1.5 to €3.3 billion in Europe to $7 to $10 billion in the United States.2,3
DVT accounts for approximately two-thirds of VTE. 4 Without prompt diagnosis and treatment, complications of DVT, including recurrent venous thrombosis, chronic venous insufficiency, venous ulcers, venous stasis syndrome, and post-thrombotic syndrome, can seriously diminish patients’ quality of life. In addition, a thrombus that dislodges and results in a PE may be life-threatening. Therefore, early diagnosis and treatment of DVT are crucial for reducing morbidity, mortality, and healthcare costs.
DVT is considered to result from a combination of the multiple risk factors mentioned previously. 5 The pathogenesis of DVT is still not fully understood; nevertheless, accumulating evidence suggests intricate connections between thrombosis formation and inflammation, white blood cells, and platelets, indicating the potential contribution of cellular components of the blood to the initiation and propagation of DVT. One hypothesis suggests that inflammatory stimulation activates endothelial cells, eliciting pro-inflammatory phenotypes that lead to the recruitment of blood cells (mainly platelets and neutrophils) to the vessel wall and incorporation of those cells into a growing intravascular thrombus, eventually leading to thrombosis formation. 6 With current clinical protocols, early DVT detection remains challenging due to generally atypical clinical presentation in its early stages. Therefore, there is an urgent need for clinically feasible, objective, and convenient markers to facilitate DVT diagnosis.
Because of the important roles of the inflammatory response, neutrophils, and platelets in VTE pathogenesis, research interest in these factors has increased. The neutrophil-to-lymphocyte ratio (NLR) and platelet-to-lymphocyte ratio (PLR) can be easily derived from full blood counts and reflect primary hemostasis and inflammation. These ratios are less affected by factors such as age, sex, and certain physiological or pathological conditions, and thus may be able to more accurately detect the presence of DVT than other blood indices.
The diagnostic value of the NLR and PLR for DVT has been reported frequently; however, the significance and consistency of these indicators for diagnosis remain to be determined. Therefore, this systematic review and meta-analysis were performed to assess the diagnostic value of the NLR and PLR for DVT obtained in previous studies, with the aim of providing clinicians with evidence regarding reliable diagnostic biomarkers to support their decision making.
Methods
This systematic review and meta-analysis was reported according to the Preferred Reporting Items for Systematic Reviews and Meta-Analyses (PRISMA) 2020 statement, 7 and the study protocol was registered on PROSPERO (registration number CRD42023404814).
In this study, 2 authors independently searched databases, selected studies, extracted data, and assessed the risk of bias, while the third author resolved any disagreements that arose during the process independently.
Data Sources and Search Strategy
We searched for relevant studies in PubMed, the Cochrane Library, and Embase (Ovid) on January 15, 2023, without any language restrictions. Our query combined appropriate keywords with Medical Subject Headings terms, Emtree terms, and text words. Additionally, we performed a manual search of reference lists from key articles to identify other relevant studies. Supplemental Figure 1 illustrates the complete search strategy.
Study Selection Criteria
The titles and abstracts of all articles retrieved from these databases were initially screened, and then the full text was rescreened. Studies were eligible if they met the following inclusion criteria: (1) Individuals in the DVT group were people with acute or chronic DVT diagnosed by ultrasonography, venography, or 3-dimensional computed tomography. Both inpatient and outpatient populations were included; (2) individuals in the DVT group were diagnosed using ultrasonography or venography; (3) the study provided sufficient information to construct a 2 × 2 contingency table, including true-positive (TP), false-positive (FP), false-negative (FN), and true-negative (TN) values; and (4) the PLR and/or NLR were measured using serum-based methods. Articles were excluded if they: (1) were irrelevant to the research topic; (2) had duplicated published data; (3) were animal experiments, basic research studies, conference abstracts, case reports, or review articles; or (4) had no extractable data.
Data Extraction and Quality Assessment
The following data were extracted: authors; year of publication; country in which the study was performed; number, age, and sex of participants; TP, FP, FN, and TN values; and NLR and/or PLR. We contacted the authors via email when the required information was not readily available.
The Quality Assessment of Diagnostic Accuracy Studies, version 2 (QUADAS-2) tool 8 was used to assess the methodological quality of the studies included in our analysis. QUADAS-2 assesses bias in 4 areas: patient selection, index test, reference standard, and flow and timing.
Statistical Analyses
Using random-effects or fixed-effects models, we calculated pooled estimates of sensitivity, specificity, the diagnostic odds ratio (DOR), and the area under the curve (AUC) of the summary receiver operating characteristic (SROC) curves with 95% confidence intervals (CIs). Model selection was based on the heterogeneity of the included studies.
The AUC was utilized as a comprehensive gauge of diagnostic value, which was categorized as low (AUC < 0.7), moderate (0.7 ≤ AUC < 0.9), or high (AUC ≥ 0.9). Additionally, we calculated the DORs to evaluate the relationship between the diagnostic test results and the presence of DVT. The degree of heterogeneity was assessed using the I2 test, with values < 30%, 30% to 50%, and > 50% indicating low, moderate, and high levels of heterogeneity, respectively. Univariate meta-regression and subgroup analyses were conducted to identify the sources of heterogeneity among the eligible studies. Furthermore, our analysis was subjected to sensitivity analysis to test its robustness, and we employed Deeks’ funnel plot asymmetry test to examine publication bias.
The RevMan 5.3 (The Cochrane Collaboration, Oxford, UK) and Stata 15.3 (StataCorp, College Station, TX, USA) software were used to conduct all statistical analyses.
Results
Study Selection and Characteristics
Figure 1 presents a flow diagram of the study selection. In our primary search, we identified 286 records, of which 49 were identified as duplicates and removed. After screening the titles and abstracts of the remaining 237 studies, 193 were excluded. After assessing the full text of the remaining 44 studies, 33 additional studies were excluded. Eventually, 11 studies9–19 involving a total of 4289 participants were deemed eligible and included in the meta-analysis. Of the 11 studies, 4 focused on NLR, 1 focused on PLR, and 6 evaluated both the NLR and PLR.

Flow diagram of the study selection process. Abbreviations: N, Number of studies; NLR, neutrophil-to-lymphocyte ratio; PLR, platelet-to-lymphocyte ratio.
The characteristics of the 11 included studies are presented in Table 1. They were published between 2012 and 2022 and were conducted in 5 countries: 5 in China, 3 in Turkey, 2 in Switzerland, and 1 in Indonesia. Nine of these studies were retrospective, while 2 were prospective. These studies were conducted in 1 to 2 centers, with participant numbers ranging from 109 to 1179. The study period of included studies varied from 3 months to 13 years. The source of patients in 7 studies was inpatient, 1 was outpatient, and 3 studies did not explicitly specify the source. Additionally, 8 studies included patients with acute DVT, 1 study included both acute and chronic DVT, and 2 studies did not provide explicit information. Regarding follow-up time, 3 studies had follow-up periods of 3 days, 4 weeks, and 1 month, respectively. The remaining 8 studies did not specify the follow-up duration. All of the studies diagnosed DVT using duplex ultrasonography or included both venography and 3-dimensional computed tomography. For the diagnosis of DVT, the majority of studies have solely relied on ultrasound, and several studies have employed venography and 3-dimensional computed tomography in conjunction with ultrasound.
Characteristics of the Included Studies.

Abbreviations: NA, not available; NLR, neutrophil-to-lymphocyte ratio; PLR, platelet-to-lymphocyte ratio.
Abbreviations: DVT, deep venous thrombosis; NLR, neutrophil-to-lymphocyte ratio; PLR, platelet-to-lymphocyte ratio.
The diagnostic data extracted from the 11 studies are shown in Table 2, and Figure 2 presents the outcomes of the methodological quality assessment.

Quality assessment of included studies. Green, yellow, and red indicate low, moderate, and high risk of bias, respectively, in each domain (QUADAS-2 tool).
Diagnostic Value of NLR and PLR for Deep Venous Thrombosis in Individual Studies.

Abbreviations: AUC, area under curve; CI, confidence interval; FN, false-negative; FP, false-positive; NLR, neutrophil-to-lymphocyte ratio; PLR, platelet-to-lymphocyte ratio; TN, true-negative; TP, true-positive.
Diagnostic Value of the NLR
Ten studies totaling 4180 participants assessed the diagnostic value of the NLR for DVT. The sensitivities of the included studies ranged from 49% to 87.3%, whereas the specificities ranged from 41% to 77.8%. For all 10 studies, the pooled sensitivity, specificity, positive-likelihood ratio, and negative-likelihood ratio were 74% (95% CI 65%-80%), 66% (95% CI 60%-71%), 2.16 (95% CI 1.81-2.57), and 0.4 (95% CI 0.30-0.53), respectively. The estimated DOR and SROC-AUC were 5.3 (95% CI 3.15-8.91) and 0.74 (95% CI 0.70-0.78). Figure 3 presents the diagnostic value indicators for the NLR.
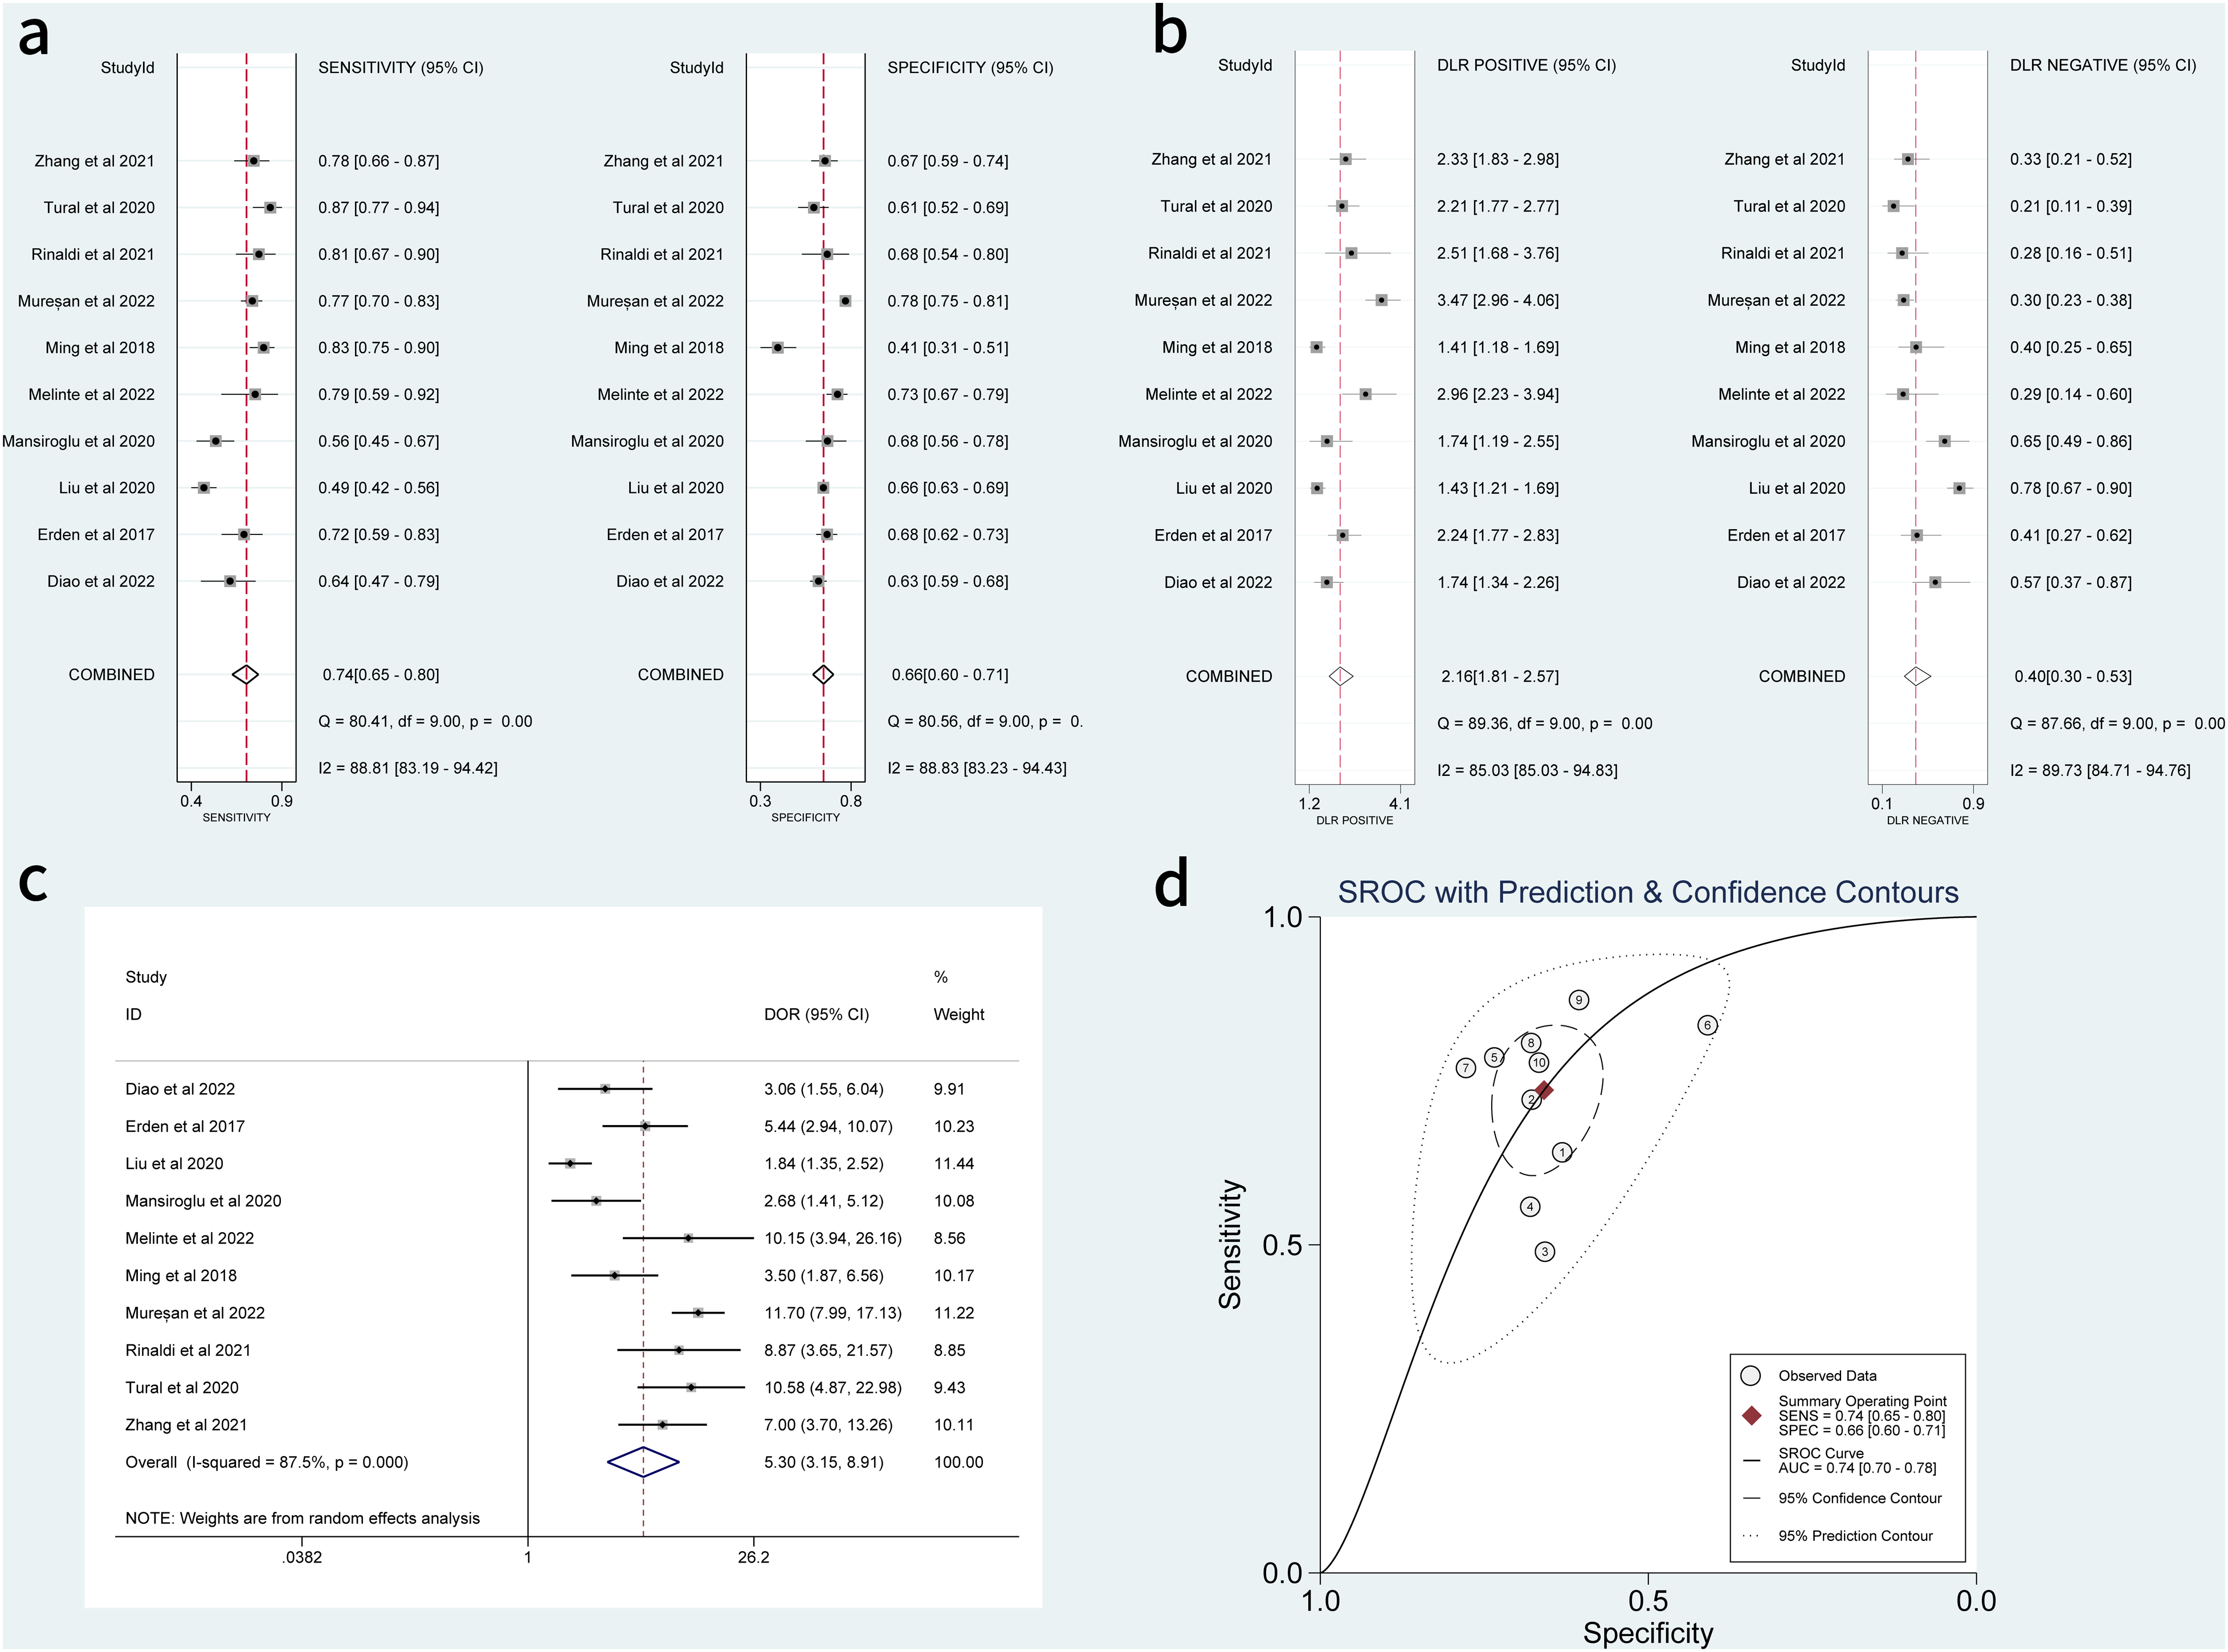
Sensitivity, specificity, positive-likelihood ratio, negative-likelihood ratio, DOR and SROC curves of NLR for diagnosing deep venous thrombosis. (a) Sensitivity and specificity. (b) Positive-likelihood ratio and negative-likelihood ratio. (c) Forest plot of DOR. (d) SROC curve. Abbreviations: AUC, area under the curve; CI, confidence interval; DOR, diagnostic odds ratio; NLR, neutrophil-to-lymphocyte ratio; SROC, summary receiver operating characteristic.
Diagnostic Value of the PLR
Seven studies totaling 3494 participants evaluated the diagnostic value of the PLR. The sensitivities and specificities ranged from 35.2% to 84.8% and 67.9% to 87.3%, respectively. The pooled sensitivity and specificity were 0.65 (95% CI 0.52-0.77) and 0.77 (95% CI 0.73-0.81), respectively. Further, the pooled positive-likelihood and negative-likelihood ratios, DOR, and SROC-AUC were 2.89 (95% CI 2.24-3.72), 0.45 (95% CI 0.31-0.65), 6.64 (95% CI 3.32-13.26) and 0.79 (95% CI 0.76-0.83), respectively. These results are shown in Figure 4.

Sensitivity, specificity, positive-likelihood ratio, negative-likelihood ratio, DOR and SROC curves of PLR for diagnosing deep venous thrombosis. (a) Sensitivity and specificity. (b) Positive-likelihood ratio and negative-likelihood ratio. (c) Forest plot of DOR. (d) SROC curve. Abbreviations: AUC, area under the curve; CI, confidence interval; DOR, diagnostic odds ratio; PLR, platelet-to-lymphocyte ratio; SROC, summary receiver operating characteristic.
Univariate Meta-Regression and Subgroup Analyses
We found substantial heterogeneity in the analyses of the NLR and PLR. In order to investigate possible sources of heterogeneity, we performed univariate meta-regression and subgroup analyses based on the cutoff value, age, sample size, and whether matched healthy individuals were used as controls. No significant sources of heterogeneity were identified. The results of these analyses are shown in Table 3.
Result of Subgroup Analysis of the Sensitivity and Specificity Based on Different Standards.
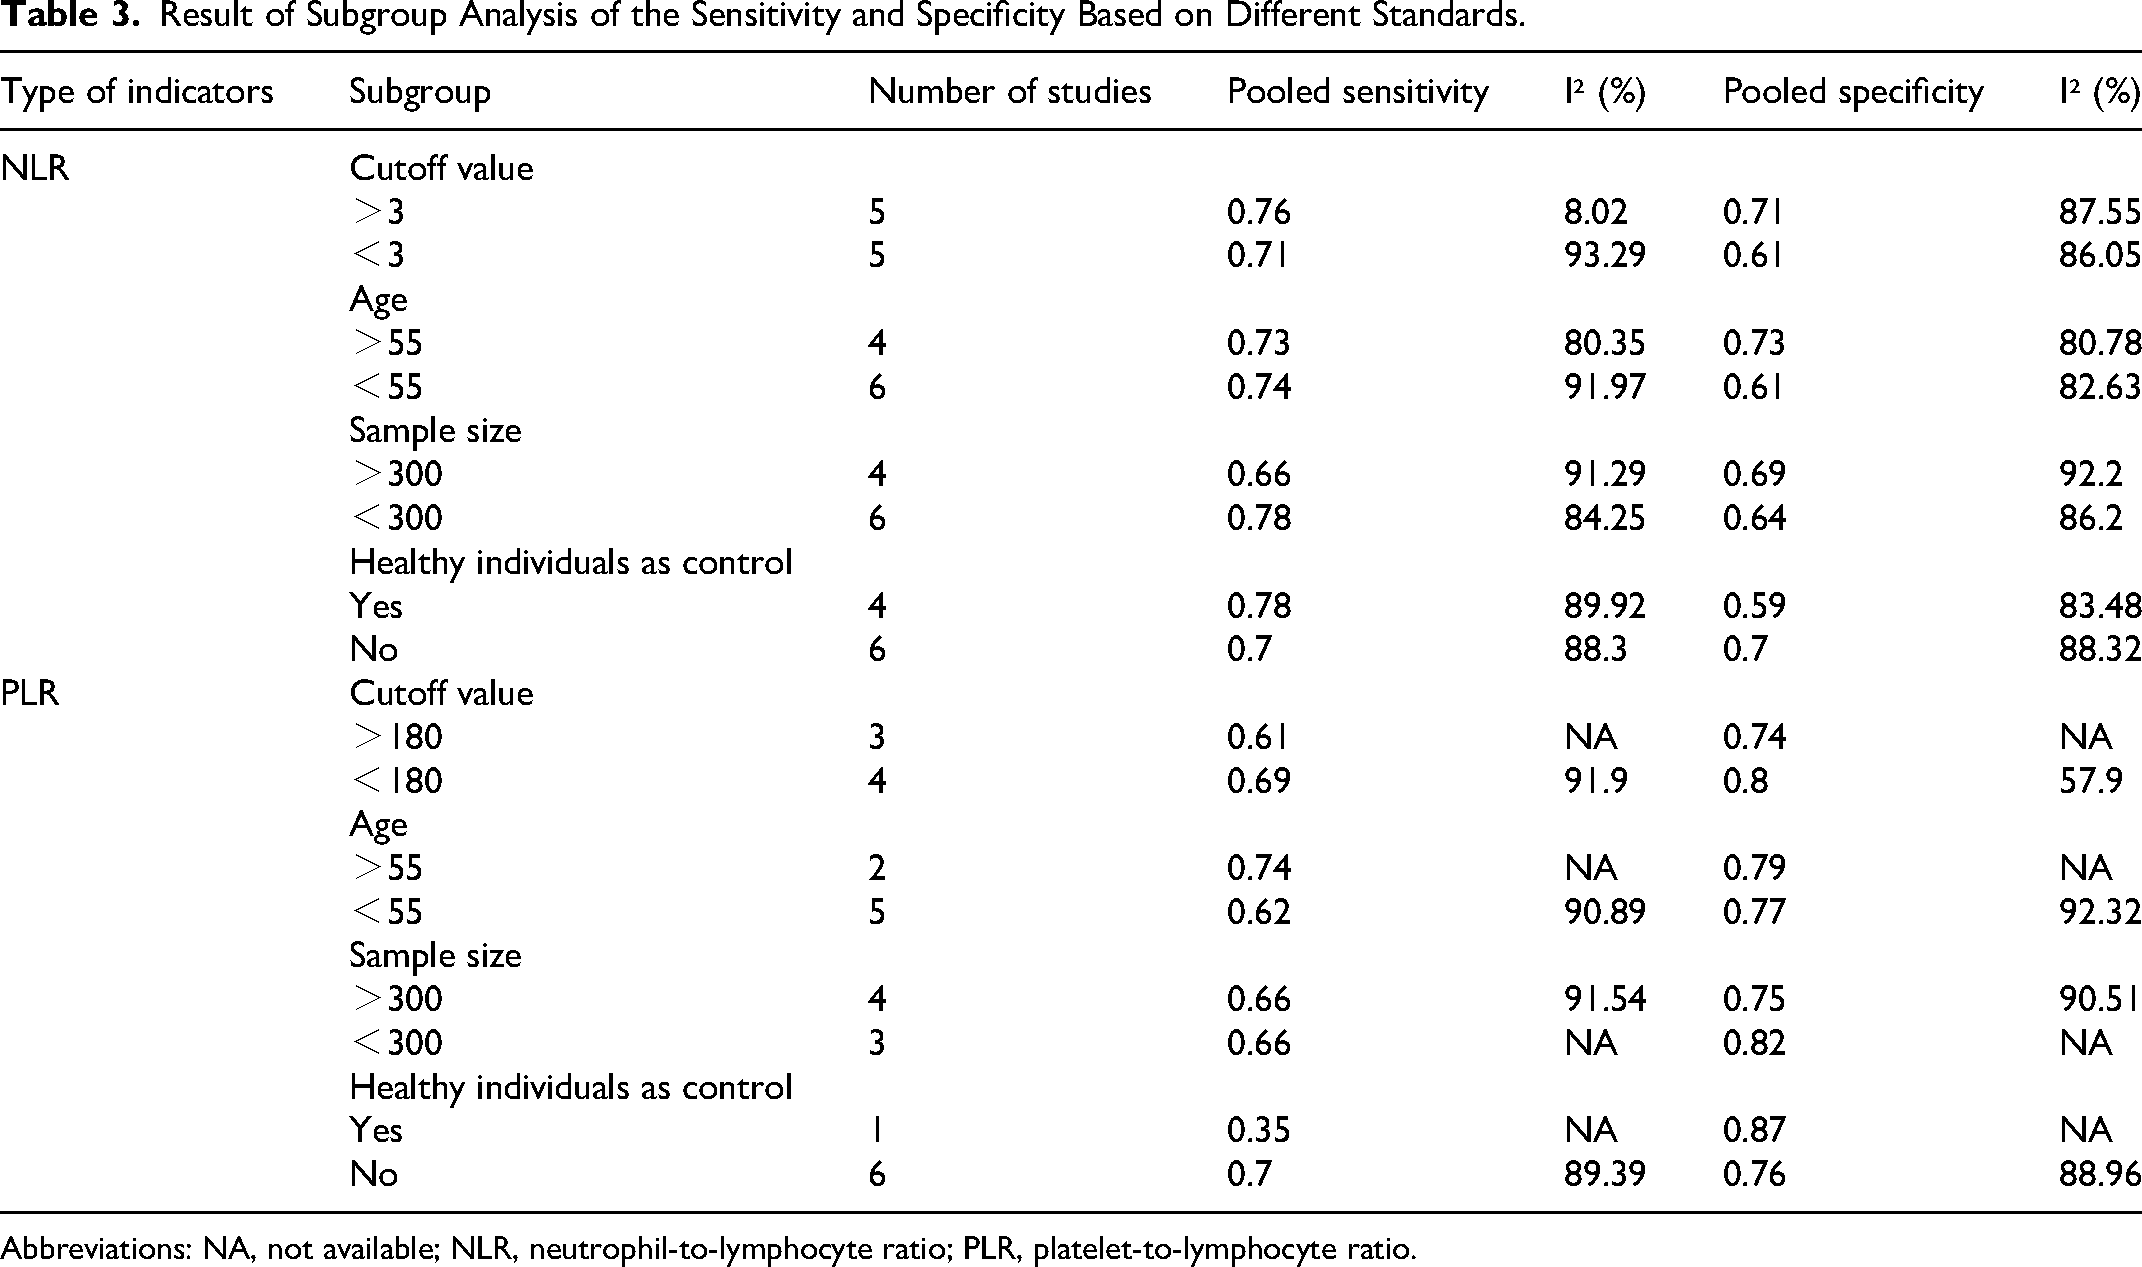
Abbreviations: NA, not available; NLR, neutrophil-to-lymphocyte ratio; PLR, platelet-to-lymphocyte ratio.
Sensitivity Analysis
Sensitivity analysis showed that omitting any studies from the meta-analysis did not affect the results, indicating that our calculations are stable and reliable (Supplemental Figure 2).
Publication Bias
The Deeks’ funnel plots of the NLR (P = .61) and PLR (P = .55) suggest that there was no significant publication bias in our study (Figure 5). However, due to the limited number of articles on the PLR, we cannot exclude the possibility of publication bias among these studies.
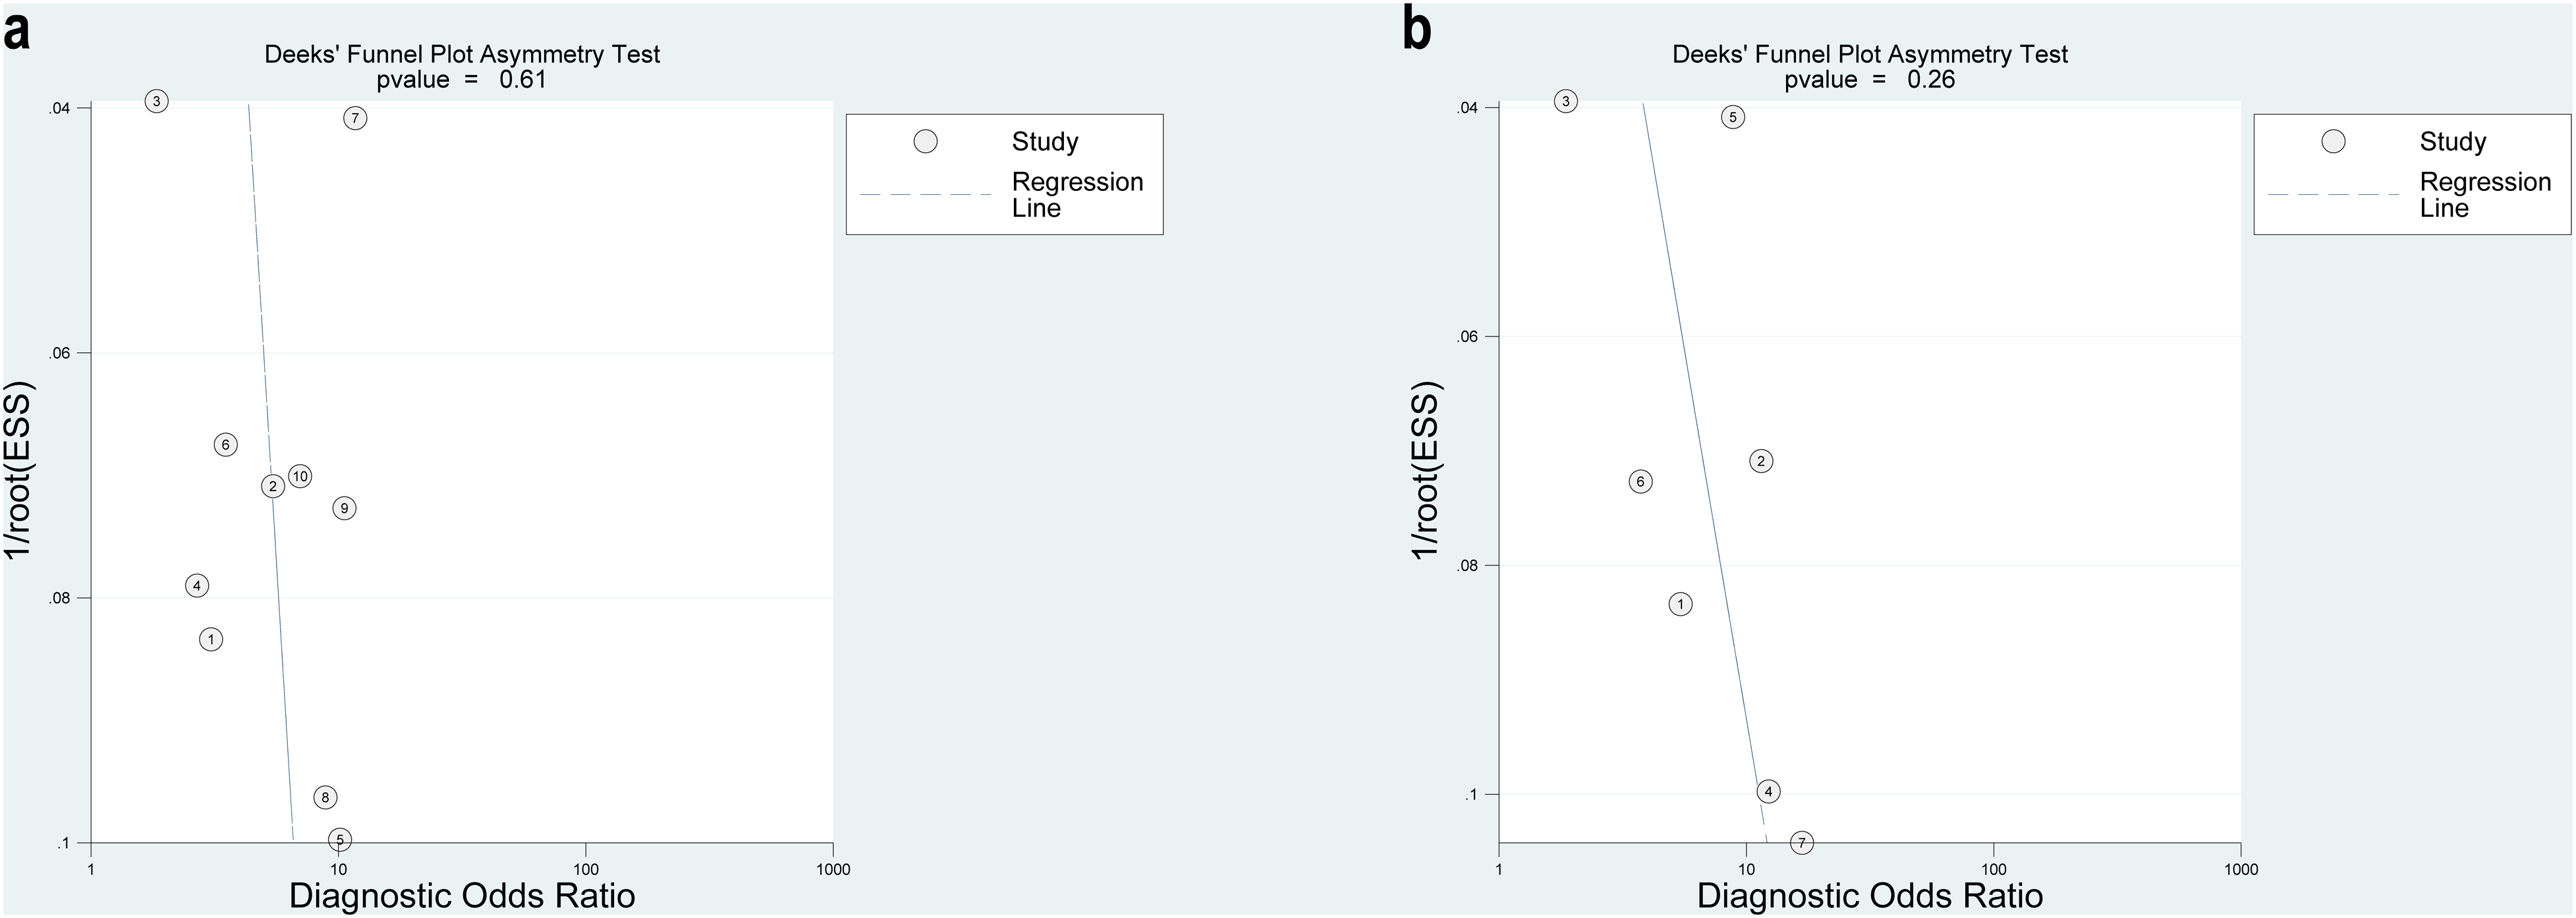
Deek's funnel plot asymmetry text for the identification of potential publication bias in the included studies. A statistical difference at P < .05. (a) Deek's funnel plot for NLR. (b) Deek's funnel plot for PLR. Abbreviations: NLR, neutrophil-to-lymphocyte ratio; PLR, platelet-to-lymphocyte ratio.
Discussion
DVT is severe and associated with high morbidity; however, its diagnosis is challenging and it is often overlooked. The current guidelines recommend the use of the Wells criteria as a tool to assist in the diagnosis of DVT.20,21 However, Silveira et al indicated that the Wells score has a higher failure rate and lower efficiency in inpatients than in outpatients. Therefore, it cannot rule out DVT reliably or inform management decisions accurately. 22 D-dimer is a blood marker commonly used for ruling out DVT in clinical practice. However, because numerous other conditions such as infection, cancer, and pregnancy can result in increased D-dimer levels, the clinical use of D-dimer for DVT diagnosis is hindered.
Hence, we conducted this meta-analysis with the aim to enhance the accuracy of the diagnosis of DVT. As described earlier, the DOR and SROC-AUC revealed that both NLR and PLR show moderate diagnostic value. Furthermore, the positive-likelihood and negative-likelihood ratios as well as the positive and negative post-test probabilities (Supplemental Figure 3) suggest that the NLR and PLR may be valuable diagnostic indicators for DVT. To the best of our knowledge, this is the first meta-analysis to investigate the diagnostic accuracy of PLR and NLR for DVT.
The central role of neutrophils in DVT is becoming understood more clearly. In an in vivo study, von Bruhl et al observed that mice with a genetic deficiency in tissue factor (TF) in either hematopoietic or myeloid cells showed dramatically reduced thrombus formation compared to wild-type animals, confirming the major role of myeloid blood cells in DVT development. 23 Neutrophils enhance intravascular coagulation through several mechanisms, including stimulation of the TF-dependent extrinsic pathway via inactivation of endogenous anticoagulants, enhanced factor XII activation, and reduced plasmin generation. 24
Multiple studies have proposed that neutrophil extracellular traps (NETs) facilitate vessel occlusion by acting as a framework for various substances such as platelets, red blood cells, extracellular vesicles, and pro-coagulant molecules, including von Willebrand factor and TF. Additionally, NETs components promote coagulation by activating the intrinsic pathway and degrading TF pathway inhibitor, an inhibitor of the extrinsic pathway. Furthermore, NETs bind to and activate platelets in DVT.25–27
During DVT development, inflammatory responses and receptor-mediated binding with neutrophils and monocytes lead to platelet accumulation. 23 Endothelial cells may interact directly with platelets, which in turn promotes leucocyte recruitment. Furthermore, platelets and coagulation pathway products play an important role in modulating the effector functions of recruited neutrophils. 28 Platelet-neutrophil interactions at the site of DVT formation reportedly promote NETs formation. 23 Platelets are the major source of pro-coagulant microparticles (MPs) in the blood and represent 70% to 90% of all circulating MPs, which can promote blood coagulation and thrombosis.29,30 These pathophysiological mechanisms may explain the diagnostic significance of the NLR and PLR in DVT.
In recent years, the NLR and PLR have been successfully used as prognostic or diagnostic markers in several diseases, such as cardiovascular disease, 31 ovarian cancer, 32 colorectal cancer, 33 urological cancer, 34 breast cancer, 35 ischemic stroke, 36 rheumatoid arthritis, 37 chronic obstructive pulmonary disease, 38 and coronavirus disease 2019 (COVID-19). 39
The association between these indicators and DVT has also been evaluated in various studies. Grilz et al 40 showed that patients with cancer with elevated PLRs and NLRs had twice the risk of mortality and that the NLR may indicate an increased risk of venous thromboembolic events in these patients. Siddiqui et al found that of 4487 patients, 152 (3.4%) suffered major bleeding and 484 (11%) died, indicating there may be an increased risk of major bleeding or death with higher baseline NLR values among patients with VTE. 41 In addition, a large population-based cohort showed similar associations between mortality and VTE. 42 Higher NLRs and PLRs have also been shown to be associated with poorer short-term and long-term prognosis, increased mortality, and longer hospitalization in patients with PE. 43 Two meta-analyses also support this point and reveal NLR and PLR could be prognostic biomarkers for PE.44,45 A different meta-analysis demonstrated that patients with acute PE with elevated NLR and PLR have higher mortality from all causes. 46 In a study of 639 patients with acute PE, NLR and PLR were shown to act as independent predictors of PE. Moreover, NLR and PLR demonstrated favorable diagnostic value, with an AUC of 0.893 for NLR and 0.877 for NLR. Several studies have shown that combining the NLR with D-dimer levels as well as with the PLR, D-dimer-to-fibrinogen ratio, and Wells score improved the diagnostic accuracy in patients with DVT.17,19 These findings provide potential directions for future research on diagnostic indicators in DVT.
A previous meta-analysis found that the NLR had moderate diagnostic accuracy in patients with VTE. 47 Their multiple meta-regression analysis revealed that the type of embolism was a source of heterogeneity between studies. Although DVT and PE essentially involve the same pathological process, just at different stages and locations, resulting in different clinical manifestations, the overall injury and thrombotic burden of the 2 conditions may not be comparable. Therefore, further separate studies on PE and DVT are warranted.
Our meta-analysis had several limitations. First, despite the meta-analysis showing that higher NLRs and PLRs may be useful for DVT diagnosis, the cutoff values vary across the different studies. The included studies determined their cutoff point based on the best results for diagnostic accuracy in their research; however, their outcomes were not subsequently validated. Variations in cutoff values may stem from differences in patient and control characteristics, clinical environment, laboratory testing, and reference standards. Additional studies using the same population parameters are needed to investigate the optimal cutoff values for these biomarkers.
Second, notable heterogeneity was observed among the included studies, and despite conducting subgroup analyses for various factors such as the NLR and PLR cutoff values, age, sample size, and whether matched healthy individuals were included as controls, the heterogeneity could not be attributed to any of these study characteristics. We included 11 studies totaling 4289 patients in our analysis, 10 of which investigated the NLR and 7 of which assessed the PLR; this may explain the observed heterogeneity. Several of the studies also assessed patients with specific conditions, including adult patellar fractures, tibial plateau fractures, Behçet's disease, cerebral hemorrhage, COVID-19, and patients who had undergone total knee arthroplasty or surgery for spinal degeneration. It is unclear whether different diseases could influence the diagnostic value of these indicators, but this possibility should be considered based on the demonstrated utility of these biomarkers in various conditions, as noted above. The inclusion of different populations may have resulted in distinct cutoff values and the emergence of heterogeneity. Further research should focus on more homogeneous populations to clarify the utility of the relevant indicators in DVT diagnosis.
Third, we cannot determine the onset of DVT, as few clinical signs may be noticed while the developing thrombus is still small. Differences in the time of sampling may have affected the relative levels of these markers.
Last, the majority of the included studies were retrospective, case-control studies with nonrandomized designs. Case-control studies are susceptible to selection bias and may overestimate diagnostic accuracy. We did not detect any significant publication bias related to either of the 2 indicators. However, due to the limited number of studies on the PLR, publication bias may have been missed, which could have led to an overestimation of overall diagnostic accuracy. We performed further searches but could not identify additional studies on the PLR.
Conclusion
In conclusion, NLR and PLR are cheap, simple and practical indices, and our findings show that the NLR and PLR exhibit moderate diagnostic accuracy and may be helpful biomarkers for the diagnosis of DVT. These blood-based indices may complement other tools for DVT diagnosis. Future prospective, well-designed studies with large sample sizes will be required to provide additional evidence to establish cutoff values and clinical value of these indicators.
Supplemental Material
sj-docx-1-cat-10.1177_10760296231187392 - Supplemental material for The Diagnostic Value of the Neutrophil-to-Lymphocyte Ratio and Platelet-to-Lymphocyte Ratio for Deep Venous Thrombosis: A Systematic Review and Meta-Analysis
Supplemental material, sj-docx-1-cat-10.1177_10760296231187392 for The Diagnostic Value of the Neutrophil-to-Lymphocyte Ratio and Platelet-to-Lymphocyte Ratio for Deep Venous Thrombosis: A Systematic Review and Meta-Analysis by Chenming Hu, Bin Zhao, Qianling Ye, Jun Zou, Xiang Li and Huaping Wu in Clinical and Applied Thrombosis/Hemostasis
Supplemental Material
sj-tif-2-cat-10.1177_10760296231187392 - Supplemental material for The Diagnostic Value of the Neutrophil-to-Lymphocyte Ratio and Platelet-to-Lymphocyte Ratio for Deep Venous Thrombosis: A Systematic Review and Meta-Analysis
Supplemental material, sj-tif-2-cat-10.1177_10760296231187392 for The Diagnostic Value of the Neutrophil-to-Lymphocyte Ratio and Platelet-to-Lymphocyte Ratio for Deep Venous Thrombosis: A Systematic Review and Meta-Analysis by Chenming Hu, Bin Zhao, Qianling Ye, Jun Zou, Xiang Li and Huaping Wu in Clinical and Applied Thrombosis/Hemostasis
Supplemental Material
sj-tif-3-cat-10.1177_10760296231187392 - Supplemental material for The Diagnostic Value of the Neutrophil-to-Lymphocyte Ratio and Platelet-to-Lymphocyte Ratio for Deep Venous Thrombosis: A Systematic Review and Meta-Analysis
Supplemental material, sj-tif-3-cat-10.1177_10760296231187392 for The Diagnostic Value of the Neutrophil-to-Lymphocyte Ratio and Platelet-to-Lymphocyte Ratio for Deep Venous Thrombosis: A Systematic Review and Meta-Analysis by Chenming Hu, Bin Zhao, Qianling Ye, Jun Zou, Xiang Li and Huaping Wu in Clinical and Applied Thrombosis/Hemostasis
Supplemental Material
sj-tif-4-cat-10.1177_10760296231187392 - Supplemental material for The Diagnostic Value of the Neutrophil-to-Lymphocyte Ratio and Platelet-to-Lymphocyte Ratio for Deep Venous Thrombosis: A Systematic Review and Meta-Analysis
Supplemental material, sj-tif-4-cat-10.1177_10760296231187392 for The Diagnostic Value of the Neutrophil-to-Lymphocyte Ratio and Platelet-to-Lymphocyte Ratio for Deep Venous Thrombosis: A Systematic Review and Meta-Analysis by Chenming Hu, Bin Zhao, Qianling Ye, Jun Zou, Xiang Li and Huaping Wu in Clinical and Applied Thrombosis/Hemostasis
Footnotes
Authors’ Contributions
CH and HW were involved in concept and design and key revisions to the text; QY and JZ in data collection; CH, BZ, and XL in data analysis and interpretation; and CH and BZ in writing of the manuscript. All authors read and approved the final manuscript.
Declaration of Conflicting Interests
The author(s) declared no potential conflicts of interest with respect to the research, authorship, and/or publication of this article.
Funding
The author(s) disclosed receipt of the following financial support for the research, authorship, and/or publication of this article: This work was supported by the Sichuan Medical Association (grant number 2019HR45).
Supplemental Material
Supplemental material for this article is available online.
References
Supplementary Material
Please find the following supplemental material available below.
For Open Access articles published under a Creative Commons License, all supplemental material carries the same license as the article it is associated with.
For non-Open Access articles published, all supplemental material carries a non-exclusive license, and permission requests for re-use of supplemental material or any part of supplemental material shall be sent directly to the copyright owner as specified in the copyright notice associated with the article.