
Abstract
Objective
Acute pulmonary embolism (PE) is one of the main causes of death and has a course as massive (MPE) or non-massive (NMPE). The study investigates the indicator potential of Glucose to Potassium ratio (GPR) in the differential diagnosis of MPE and NMPE.
Materials and Methods
The study was designed as a retrospective cross-sectional clinical cohort in patients with PE. A total of 111 participants enrolled in the research separating two groups: MPE (n:54) and NMPE (n:67). The GPR was calculated by dividing serum glucose by potassium levels and its results were compared with D-Dimer, Pulmonary Artery Pressure (PAP), and C-Reactive Protein Test (CRP).
Results
D-Dimer was measured as 6.5 ± 5.7 µg/L in the MPE and found higher than the NMPE (3.9 ± 5.2 µg/L) (P = .019). CRP (100 ± 83.5 to 30.9 ± 42.7 mg/L; P = .0001) and PAP (49.5 ± 11.9 to 34.8 ± 7.3 mmHg; P = .0001) were found increased in the MPE. GPR strongly increased in the MPE (30.7 ± 7.5 to 24.9 ± 4.3; P = .0003) in line with CRP, D-Dimer and PAP. GPR showed a stronger diagnostic value (AUC: 0.733; P = .00001; Sensitivity:72%; Spesifity:70%; Cut-off: 26.5). PAP and GPR showed significant efficiency on occurrence of the MPE according to the binary logistic regression.
Conclusion
The GPR, as a novel and cheap marker, can be useful for diagnostic differentiation of MPE from NMPE, but weaker than PAP and better than D-dimer.
Type of Study and Level of Evidence
Level-II, Retrospective clinical cohort study.
Introduction
Acute pulmonary embolism (PE) represents the third most common cause of cardiovascular death after myocardial infarction and stroke and its mortality is still extremely high in the population. Short-term mortality rates in clinically diagnosed PE patients vary between 3.9% and 12%. 1 If sudden death cases are included, mortality rates from PE are very high, such as 20 to 25%. 2 One-third of the affected patients with PE is mostly diagnosed after the fifth day and this delay in the diagnosis results in massive and permanent health problems.
The severity and risk categorization of PE is usually performed by studying blood pressure, signs of increased right ventricular overload on echocardiography, CT pulmonary angiography, and biomarkers that indicate cardiac damage. 3 However, these examinations are time-consuming and costly. Early diagnosis and risk stratification are life-saving in PE. Early risk categorization will also reduce healthcare costs and increase patient satisfaction. 4
A neuroendocrine and inflammatory response occurs after an acutely stressful event. After the hypothalamus-pituitary-adrenal system is activated after stress, the release of counter-regulatory hormones increases. Glucose and potassium metabolism is affected as a result of these hormonal changes. 5 In response to stress hormones, the release of inflammatory mediators and pro-coagulatory factors increases, and the use of glucose in peripheral tissues decreases. Hyperglycemia increases further due to the release of counter-regulatory hormones, and a vicious cycle occurs by increasing pro-inflammatory and pro-coagulatory cytokine secretion, inflammatory response, and oxidative stress. 6 In a recent study, it has been shown that Glucose to Potassium ratio (GPR) can be a good indicator of vasospasm and stress response in patients with subarachnoid hemorrhage. 7 Pulmonary arterial pressure (PAP) was also used as one of the criteria used in the differential diagnosis of massive pulmonary embolism (MPE) and non-massive pulmonary embolism (NMPE). Although many biomarkers were investigated in PE, the parameters used in the differential diagnosis of MPE and NMPE are limited.8,9
Given the increased stress response in the patients with PE, stress hyperglycemia is commonly observed. Extracellular potassium levels will decrease due to the increased release of the counter-regulator hormone in the stress environment in PE. 10 Considering all these physiological responses, we believe that the evaluation of glucose and potassium values together can be very useful in understanding the effects of both endocrine and metabolic effects on the disease and its results. The present study aimed to investigate whether the GPR has an indicator potential and could be useful in the differential diagnosis of MPE and NMPE to use in routine applications.
Materials and Methods
Study Design
The study was designed as a retrospective cross-sectional clinical cohort. All the patients diagnosed with PE in the hospital were included in the present study. They were selected from the patients who were admitted to the emergency department with PE between January 2018–December 2020. All the participants were selected among the patients whose symptoms started within the last 14 days and were confirmed by CT pulmonary angiography. The demographic data of the patients, previous illnesses, drug use history, and previous surgical operations were searched from the hospital data. Standard transthoracic echocardiography procedure was applied to all patients. This research study were performed with the approval of the Ethical Committee of Our Institution (ID:2021-158).
Study Enrollments
The patients without having an image of CT pulmonary angiography or with an uncertain diagnosis of PE on CT pulmonary angiography were excluded from the study. When the data of the patients included in the study were examined, patients with symptoms before the last 14 days were excluded from the study. Patients whose clinical information and drug history were unclear from the patient data were excluded from the study. The followings as given in Figure 1 were excluded from the study; not meeting inclusion (n:22), declined to be a participant (n:8), ischemic heart disease (n:8), congestive heart failure (n:3), chronic obstructive pulmonary (n:2), interstitial lung disease (n:1), acute renal failure (n:3) and diabetic ketoacidosis (n:2). After all inclusion and exclusion criteria were applied, 49 patients were excluded and a total of 111 patients remained (MPE: 54, NMPE: 67).

The Flow Chart for the selection and enrollment of study participants
Definitions
Pulmonary Artery Pressure (PAP) was measured by echocardiography, although the gold standard remains measurements taken directly right heart catheterization. It was calculated by the formula: (PA-Systolic pressure + 2xPA-Diastolic pressure) / 3. The pulmonary arterial systolic pressure (PA-Systolic pressure) is derived (using the simplified Bernoulli equation) from the peak velocity of the tricuspid regurgitant jet, as measured by continuous wave Doppler, and the PA-Diastolic pressure from the end diastolic velocity of the pulmonary regurgitant jet.
The severity of PE was classified as massive (MPE) and non-massive (NMPE). The European Society of Cardiology Guideline (ESC) was used for the differential diagnosis of them. 11 After confirming the diagnosis of PE with CT pulmonary angiography, the differential diagnosis of MPE and NMPE was completed. The MPE was determined as patients with pulmonary embolism confirmed on CT pulmonary angiography, hypotension or shock, right ventricular overload findings on echocardiography, and increased cardiac troponin levels in the blood. Right, ventricular/left ventricle Ratio > 0.6 or systolic PAP measured from the peak tricuspid regurgitant velocity >30 mmHg on echocardiography was accepted as right ventricular overload. Patients who were hemodynamically stable and without signs of right ventricular overload were included in the NMPE group.
Laboratory Data
Before CT angiography, blood samples were taken from the antecubital vein with an atraumatic puncture from all patients with suspected pulmonary embolism and immediately sent to the laboratory. Peripheral venous blood samples were obtained from all patients at admission for glucose, potassium, d-dimer, cardiac troponins, and other routine laboratory parameters. A blood tube containing ethylene-diamine-tetraacetic acid (EDTA) was used for the hematological evaluation. The complete blood test, including the differentials, was calculated using an automated blood cell counter (Mindray BC 6800, China). The biochemical panel was measured with Cobos 6000 (Roche Diagnostics, USA) autoanalyzer device. GPR was obtained by dividing glucose level to potassium level using the MS Excel program.
Statistical Assessments
In this study, which we considered a P < .05 value to be statistically significant, statistical evaluation was performed with the 24th version of the SPSS Statistics for Windows program (IBM Company, USA). The distribution normality was done using Kolmagorov Smirnov, and all the results were shared as mean ± standard deviation since continuous variables were distributed normally. All the categorical variables were analyzed with the chi-square test and given as frequency (%). Data comparisons between the MPE and NMPE were made using the Student's t-test. Correlation anaylsis was done by the Spearman-correlation coefficients. In identifying predictor parameters, we generated binary-logistic regression model that includes significant variables according to univariate assessment and they were presented with odds ratios and a 95% confidence interval (CI) (Table 1). Receiver operating characteristic (ROC) curve analysis was performed and the area under the curve (AUC) was estimated to evaluate the prognostic prediction accuracy of GPR for the MPE against NMPE.
Logistic regression analysis for the MPE
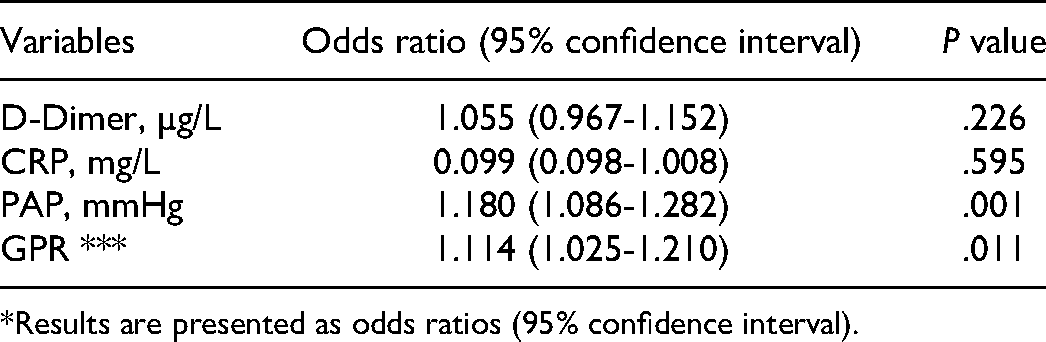
*Results are presented as odds ratios (95% confidence interval).
Results
In the demographic evaluation of the patients, there was no difference in main factors such as age and gender, as shown in Table 2. Similarly, there was no difference in terms of smoking habit and amount smoked. Thus, it was accepted that demographics did not have a bias effect on the study. Sodium, potassium, urea, and creatinine values, which indicate the blood and circulation metabolic values showed no difference in the groups (P > .05).
Laboratory findings of the groups of pulmonary embolism

Abbreviations: WBC, White Blood Cell; CRP, C-Reactive Protein; PAP, Pulmonary Arterial Pressure; GPR, Glucose to Potassium ratio.
Bold values means the significance of P < 0.005.
“Gender” and “smoking” parameters were analyzed by the Chi-Square test, while the others (mean ± standart deviation) were done using the independent Student T-test.
In the comparison of Massive (n:54) and Non-Massive (n:67) groups, D-Dimer levels were measured as 6.5 ± 5.7 µg/L in the MPE and higher than the NMPE (3.9 ± 5.2 µg/L) (P = .019). C-Reactive Protein Test (CRP) (100 ± 83.5 to 30.9 ± 42.7 mg/L; P = .0001) and PAP (49.5 ± 11.9 to 34.8 ± 7.3 mmHg; P = .0001) were also found as increased in the MPE group. GPR increased very strongly in the MPE group (30.7 ± 7.5 to 24.9 ± 4.3; P = .0003) in line with CRP, D-Dimer, and PAP.
In the ROC analyze of the diagnostic value of D-Dimer, CRP, PAP and GPR for the MPE, as shown in Table 3, the PAP parameter showed the strongest potantial (AUC: 0.851; P = .00001; Sensitivity:77%; Spesifity: 84%; cut-off: 39.4). CRP showed 74% sensitivity and 82% spesifity for MPE with the cut-off value of 36.9 mg/L (AUC: 0.795; P = .0001). As it is seen in the Figure 2, the GPR showed a stronger diagnostic value (AUC: 0.733; P = .00001; Sensitivity:72%; Spesifity:70%; Cut-off: 26.5) than D-Dimer (AUC: 0.705; P = .00012; Sensitivity:69%; Spesifity:72%; Cut-off: 3.37 µg/L). According to the analyze of the binary logistic regression analyze, PAP and GPR showed significant efficiency on occurrence of the MPE, as given in Table 1 (Figure 2).
The diagnostic value of D-Dimer, CRP, PAP, and GPR for MPE

Abbreviations: C-Reactive Protein, PAP, Pulmonary Arterial Pressure; GPR, Glucose to Potassium ratio; SN, sensitivity; SP, Specificity; SE, Standart Error.
Under the nonparametric assumption.
Null hypothesis: true area = 0.5.
Discussion
To the best of our knowledge and literature, the present study is the first research investigating the potential of the GPR in PE. We found that the GPR, a novel index, is useful in the diagnostic differentiation of MPE from NMPE, but weaker than PAP and better than D-dimer. The GPR may be used as a diagnostic index for separating the MPE/NMPE and will open new horizons for physicians in this field.
We acknowledged PE that there is a strong relationship between increased glucose levels and its poor prognosis. Altabas et al. found a relationship between stress hyperglycemia and pulmonary embolism location and embolism size. These findings support the thesis that there is deeper stress in MPE compared to NMPE. 10 Many studies have been conducted on the control of hyperglycemia especially in acute coronary syndrome patients during intensive care follow-up. Keeping the glucose level between 1.26 g/L and 1.80 g/L decreased 3-month, 1-year, and 3-year mortality in acute coronary syndrome. Moreover, the results in this study were independent of the insulin protocol given. 12 However, studies on more strict control of glucose levels in acute coronary syndrome than these ranges have shown that the mortality rate increases. All these findings support that a certain level of control of stress hyperglycemia will decrease mortality and morbidity rates. Although the relationship between stress hyperglycemia and the cardiovascular event has been well investigated, the relationship has not been demonstrated in pulmonary embolism. 13
The potassium level is regulated by the ATP-Na/K pump on the cell surface. Increased adrenergic hormones in the case of stress up-regulate this pump and consequently the K+ level decreases.14,15 Hyperglycemia due to increased catecholamine due to stress in pulmonary embolism, insulin secretion, and intracellular K+ uptake will have clinical consequences. Serum GPR index is a very novel parameter that was analyzed in circulatory diseases such as stroke and hemoraggia. Matano et al. reported the GPR for the first time in their study. Matano et al. found a strong relationship between vasospasm and GPR in cerebral infarction. 7 The results of Wu et al. in 2021, a very recent study, reported that GPR was independently correlated with adverse outcomes in patients with hemorrhagic manifestations and noticed that the predictive value of hematoma volume was significant. According to their results, it can be used as a prognostic index for the prognosis of patients in long follow-ups. 16 Shibata et al. reported an efficient correlation between GPR and injury. In cases with a GPR of ≥50, the odds ratio was 4.079. Therefore, they suggested GPR as a potential index for injury. In the study of Fujiki et al. they analyzed the GPR index in the patients with subarachnoid hemorrhage. They reported that calculating glucose and potassium values together as GPR rather than alone is beneficial for evaluating this disease. 17
In our study, we focused to differentiate between MPE and NMPE using GPR concerning PAP, D-dimer, and CRP, which have diagnostic value in PE. The similarity of demographic data greatly reduced bias. In the group comparison, D-Dimer levels were higher in MPE than NMPE. As waited, CRP and PAP were found as increased in the MPE group. GPR increased very strongly in the MPE group in line with CRP, D-Dimer, and PAP. In the diagnostic value analysis of the MPE against NMPE, the PAP showed the strongest potential. The GPR showed a stronger diagnostic value than D-Dimer. According to the binary logistic regression, PAP and GPR showed efficiency in the occurrence of the MPE.
This study had several limitations. Initially, the study was designed as a retrospective cohort study. We could not obtain data on hormones such as insulin, corticosteroid,glucagon and catecholamine, in addition to HbA1C levels to compare the diabetic outcomes with the index. The analysis was conducted at a single-center, resulting in a limited sample size. Despite all the limitations, it is the first study investigating the relationship between GPR and the severity of PE and will shed light on prospective studies. GPR effectiveness can be evaluated more clearly with prospective and multi-center studies by adding the control group.
Conclusion
The GPR increased strongly in the MPE in line with CRP, D-Dimer, and PAP. Besides, the GPR showed a stronger diagnostic value than D-Dimer. PAP and GPR showed efficiency in the occurrence of the MPE. The GPR, as a novel and cheap marker, can be useful for diagnostic differentiation of MPE/NMPE, but weaker than PAP and better than D-dimer.
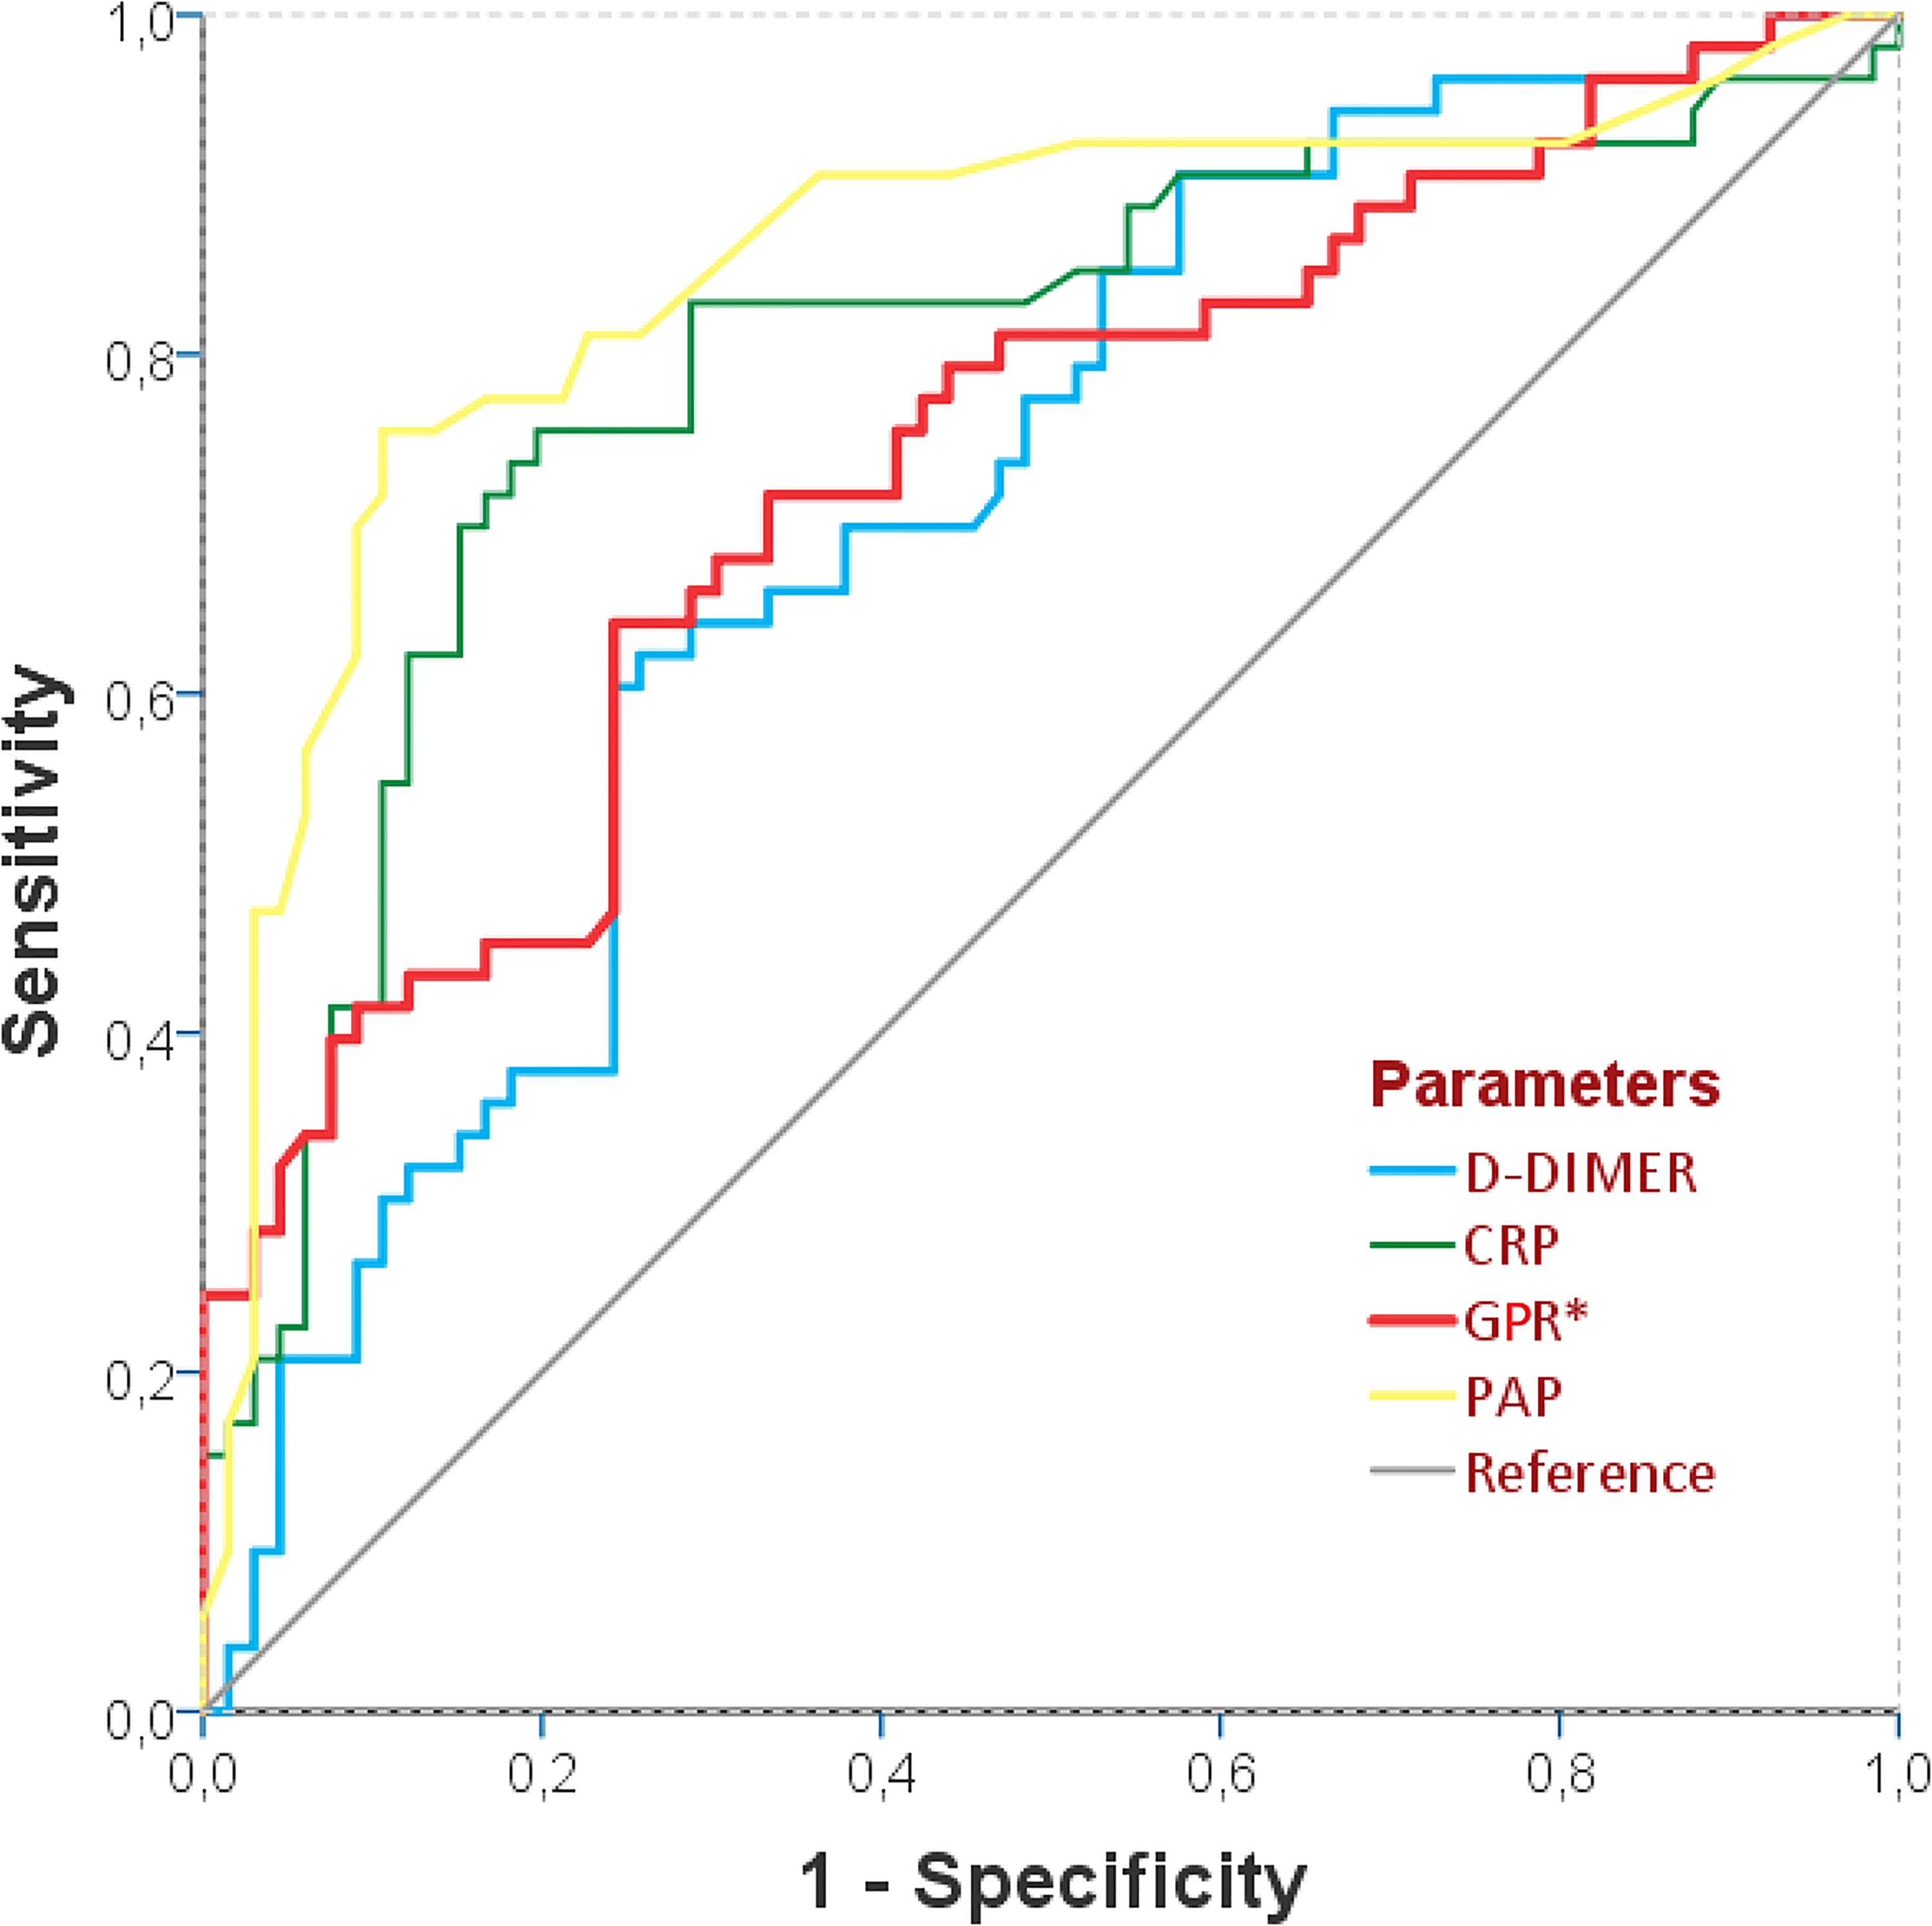
The ROC Curve showing the diagnostic efficiency of D-Dimer, CRP, PAP, and GPR for massive pulmonary embolism.
Footnotes
Declaration of Conflicting Interests
The author(s) declared no potential conflicts of interest with respect to the research, authorship, and/or publication of this article.
Funding
The author(s) received no financial support for the research, authorship and/or publication of this article.
Presentation at a National or International Medical Society
None.