
Abstract
Venous thromboembolism (VTE) is a fatal disease and has become a burden on the global health system. Recent studies have suggested that artificial intelligence (AI) could be used to make a diagnosis and predict venous thrombosis more accurately. Thus, we performed a meta-analysis to better evaluate the performance of AI in the prediction and diagnosis of venous thrombosis. PubMed, Web of Science, and EMBASE were used to identify relevant studies. Of the 741 studies, 12 met the inclusion criteria and were included in the meta-analysis. Among them, 5 studies included a training set and test set, and 7 studies included only a training set. In the training set, the pooled sensitivity was 0.87 (95% CI 0.79-0.92), the pooled specificity was 0.95 (95% CI 0.89-0.97), and the area under the summary receiver operating characteristic (SROC) curve was 0.97 (95% CI 0.95-0.98). In the test set, the pooled sensitivity was 0.87 (95% CI 0.74-0.93), the pooled specificity was 0.96 (95% CI 0.79-0.99), and the area under the SROC curve was 0.98 (95% CI 0.97-0.99). The combined results remained significant in the subgroup analyzes, which included venous thrombosis type, AI type, model type (diagnosis/prediction), and whether the period was perioperative. In conclusion, AI may aid in the diagnosis and prediction of venous thrombosis, demonstrating high sensitivity, specificity and area under the SROC curve values. Thus, AI has important clinical value.
Introduction
Venous thromboembolism (VTE) is a disease that seriously threatens the lives of patients. VTE is the third most frequently occurring acute cardiovascular syndrome in the world and is 1 of the main causes of sudden death. 1 VTE is also the second leading cause of death in cancer patients. 2 The common types of VTE include deep vein thrombosis (DVT) and pulmonary embolism (PE). In the United States, approximately 300000 people die of PE every year. 3 In Europe, with a total population of 454.4 million in 6 countries, more than 370000 deaths were related to VTE in 1 year. 4 The incidence rate of VTE in hospitalized children is 53-57 per 100000 cases per year. 5,6 VTE has become a burden on the global health system. 7
Although the incidence of VTE is not low, its diagnostic accuracy is not high. Some studies have shown that 34% of patients who died of VTE had sudden fatal PE, 59% had undiagnosed PE, and only 7% of VTE patients were accurately diagnosed before death. 4 Therefore, the accurate prediction and diagnosis of VTE is very important. If we could predict VTE in advance or diagnose it in a timely and accurate manner, we could intervene in advance, treat patients in time and avoid catastrophic events.
In recent years, artificial intelligence (AI) has become increasingly widely used in the field of medicine and has played an increasingly important role in disease prediction, diagnosis and treatment. 8 –13 AI in the prediction and diagnosis of venous thrombosis has also been performed, and some achievements have been reported. The AI research methods used in the prediction and diagnosis of venous thrombosis include natural language processing (NLP), 14,15 artificial neural networks (ANNs), 16 and support vector machines (SVMs). 17,18
However, there is still a lack of systematic analyzes and research on AI in the prediction and diagnosis of venous thrombosis. The influencing factors of AI in the prediction and diagnosis of venous thrombosis should be identified to better serve the clinic in the future. Therefore, the purpose of this study was to integrate previous research in this field and conduct a large sample evaluation to confirm the value of AI in the prediction and diagnosis of venous thrombosis.
Materials and Methods
This meta-analysis of AI diagnostic accuracy was performed in accordance with the Preferred Reporting Items for Systematic Reviews and Meta-Analyzes (PRISMA) guidelines 19 and the Cochrane Handbook.
Literature Search
Using PubMed, Web of Science, and EMBASE, we searched for literature on AI in the diagnosis of venous thrombosis. The retrieval time was from the establishment of the database to April 12, 2020. The following retrieval strategy was employed: “Artificial Intelligence (MeSH word or text word) or Machine Learning (MeSH word or text word) or Algorithms (MeSH word or text word) or Deep Learning (MeSH word or text word)” and “Venous Thrombosis (MeSH word or text word)” and “Diagnosis” (provided by the McMaster Evidence-based Medicine Center, https://hiru.mcmaster.ca/hiru/HIRU_Hedges_MEDLINE_Strategies.aspx). No language or date restrictions were set when retrieving articles. The detailed search strategy is provided in the supplementary files. The retrieval of the articles was conducted by 2 experienced researchers (QW and LY). Any differences in the retrieval results were resolved through discussion or by a third researcher.
Study Selection
The article inclusion criteria were as follows: (1) the study focused on DVT, PE or portal vein thrombosis (PVT); (2) the study explored the use of AI to predict and diagnose venous thrombosis; and (3) the study was an original research article.
The exclusion criteria were as follows: (1) review articles; (2) duplicate publications; (3) nonhuman studies; and (4) studies without usable data.
Data Extraction
General information and relevant clinical information, including title, year of publication, author, type of venous thrombosis, and specific methods of AI, were extracted from the studies.
Reconstructed 2 × 2 tables of the parameters of DVT diagnosis were collected, including true positive (TP), false positive (FP), true negative (TN), and false negative (FN) findings. The sensitivity, specificity, positive likelihood ratio, negative likelihood ratio, area under the summary receiver operating characteristic (SROC) curve and other parameters were calculated from the diagnostic reconstructed 2 × 2 tables.
Literature Quality Evaluation
In the meta-analysis, the revised Quality Assessment of Diagnostic Accuracy Studies 2 (QUADAS-2) tool was used to evaluate the quality of the literature. This scale includes 4 aspects: patient selection, index test, reference standard, and flow and timing. Risk of bias and applicability concerns were evaluated.
Statistical Analysis
RevMan 5.3 and Stata 15 software were used for data analysis. The reconstructed 2 × 2 tables were used to calculate the sensitivity, specificity and other indicators. The pooled sensitivity, specificity, and 95% confidence intervals (95% CIs) were calculated using a bivariate random effects model, and a coupled forest plot was obtained. In addition, forest plots were drawn to show the heterogeneity in sensitivity and specificity, and SROC curves were plotted to show the diagnostic accuracy. Heterogeneity was assessed using Cochran’s Q test and Higgins inconsistency index (I2) test. P < 0.05 in Cochran’s Q test indicated the existence of heterogeneity; Higgins I2 test value > 50% indicated substantial heterogeneity. In addition, subgroup analyzes of studies with a training set were performed to explain the effects of heterogeneity. The following 4 covariates were considered: (a) venous thrombosis type; (b) AI type; (c) model type (prediction or diagnosis); and (d) whether the period was perioperative.
Results
Study Selection
As shown in Figure 1, a total of 741 studies were initially retrieved, and 538 remained after duplicates were removed. In total, 28 studies were assessed for eligibility with full-text review, and 12 original articles 14 –18,20 –26 met the inclusion criteria and were included in the meta-analysis.

Flow diagram of the study selection for the meta-analysis of venous thromboembolism prediction and diagnosis using artificial intelligence.
Characteristics of the Included Studies
Among the 12 studies, 5 studies 14,20 –22,25 included a training set and test set, whereas 7 studies 15 –18,23,24,26 only had a training set with no test set. A total of 51383 cases were included, including 33704 cases in the training sets and 17679 cases in the test sets. There were 2443 cases of DVT in the training sets and 679 cases of DVT in the test sets. Four studies 15,18,20,25 analyzed DVT and PE separately. In terms of the types of venous thrombosis, 3 studies 16,17,26 focused on PVT, 5 studies 14,15,18,20,25 focused on DVT, 4 studies 15,18,20,25 focused on PE, and 3 studies 21 –23 did not clearly distinguish between PE and DVT. In terms of the AI methods, 1 study 16 used ANN, 6 studies 14,15,20,22,23,25 used NLP for 9 analyzes, 1 study 21 used a Bayesian network, 2 studies 17,26 used SVM, and 1 article 18 used NLP and SVM for DVT and PE analyzes. Regarding the perioperative period, 8 articles 14,16 –18,21,22,24,25 were nonperioperative studies, and 4 articles 15,20,23,26 were perioperative studies. In terms of the study focus regarding diagnosis/prediction, 4 studies 16,20,22,23 focused on prediction, and 8 studies 14,15,17,18,21,24 –26 focused on diagnosis. The patient and study characteristics of the included studies are shown in Table 1.
Characteristics of the Included Studies.

Abbreviations: NR, not reported; NLP, natural language processing; RBF ANN, model, radial basis function (RBF) artificial neural network (ANN) model; PVT, portal vein thrombosis; VTE, venous thromboembolism; CV, cross-validation; RFA-PVST, risk factor analysis for PVST; Hct, red blood cell-specific volume; PT, prothrombin time; FBG, fasting blood glucose; [Ca2+], serum calcium concentration; TG, triglyceride; AMY, serum amylase (Somogyi method); APACHE II, Acute Physiology and Chronic Health Evaluation II.
*25 input variables: age, pulse rate, systolic blood pressure, respiratory rate, pulse oximetry reading, temperature, sex, sudden onset of symptoms, cough, pleuritic chest pain, substernal chest pain, syncope, dyspnea, hemoptysis, unilateral leg swelling, asthma, COPD, active wheezing, current smoking status, recent surgery or trauma, immobility, cardiac disease, previous DVT or PE, malignancy, estrogen use, pregnancy or postpartum status.
#11 indicators: liver cirrhosis, D-dimer, splenomegaly, splenectomy, inherited thrombophilia, ascetic fluid, history of abdominal surgery, bloating, C-reactive protein (CRP), albumin, and abdominal tenderness.
**: Indicates DVT.
##: Indicates PE.
Quality of Evidence, Heterogeneity and Risk of Bias
As shown in Figure 2 and Supplementary Figure S1, a high-risk bias was identified in 2 studies regarding flow and timing 23,25 and in 1 study regarding patient selection. 15 The results of the QUADAS-2 literature quality evaluation suggest that most studies had a moderate risk of bias and low applicability concerns.

Summary of the risk of bias and applicability concerns. High, unclear and low risk of bias and applicability concerns are presented in red, yellow, and green colors, respectively.
The Cochran’s Q test and Higgins’s inconsistency index (I2) test statistic results revealed significant heterogeneity between the overall training and test sets. The combined sensitivity I2 of the overall training set was 93.6 (P < 0.001), and the combined specificity I2 of the overall training set was 99.4 (P < 0.001). The combined sensitivity and the combined specificity I2 of the test set were 91.1 (P < 0.001) and 99.8 (P < 0.001), respectively. The results reveal heterogeneity among the studies. Therefore, random effects quantity models were used for the meta-analysis.
The sensitivity analysis of the training set and test set are shown in Supplementary Figure S2 and Supplementary Figure S3, respectively.
The P-value of Deeks’ funnel plot asymmetry test was 0.17 in the training set (Supplementary Figure S4) and 0.99 in the test set (Supplementary Figure S5). This result suggested no significant publication biases in the training and test sets.
Meta-Analysis of Combined Effects
Meta-analysis was performed on the 12 studies using the random effects model, and 4 of the studies 15,18,20,25 that analyzed DVT and PE separately were listed separately. The results are shown in Table 2. In the training set, the pooled sensitivity was 0.87 (95% CI 0.79-0.92), the pooled specificity was 0.95 (95% CI 0.89-0.97) (Figure 3), and the area under the SROC curve was 0.97 (95% CI 0.95-0.98) (Figure 4 and Supplementary Figure S6). In the test set, the pooled sensitivity was 0.87 (95% CI 0.74-0.93), the pooled specificity was 0.96 (95% CI 0.79-0.99) (Supplementary Figure S7), and the area under the SROC curve was 0.98 (95% CI 0.97-0.99) (Supplementary Figure S8).
Analysis Results of Artificial Intelligence for the Prediction and Diagnosis of Venous Thromboembolism in the Training Group and Test Group.
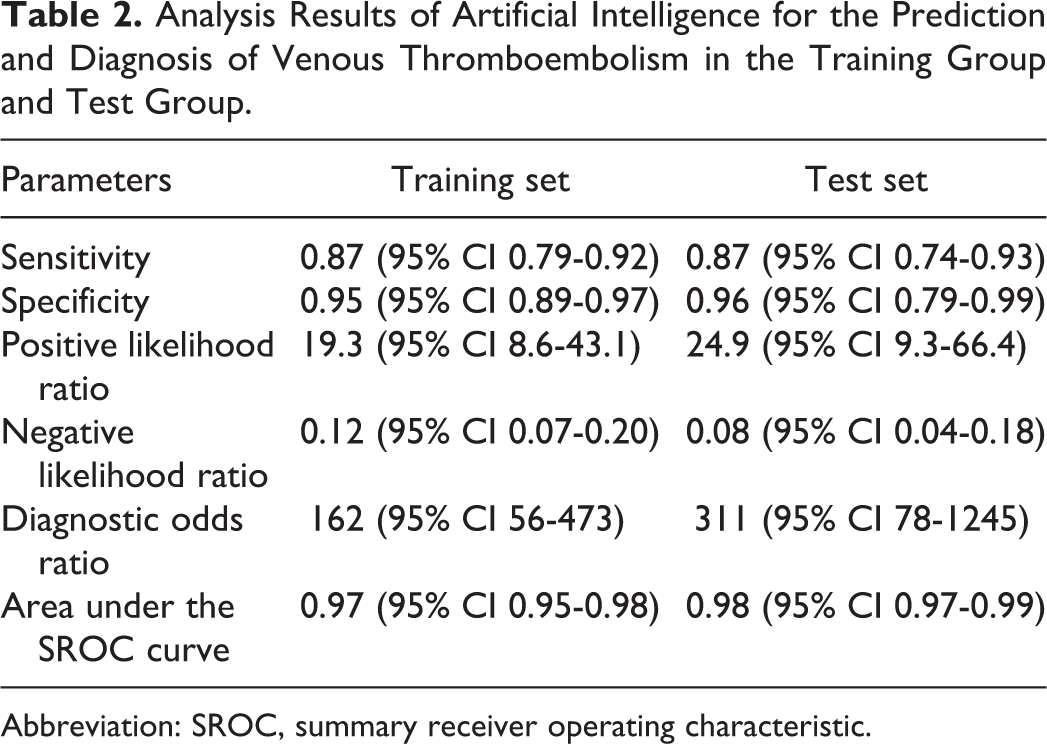
Abbreviation: SROC, summary receiver operating characteristic.

Forest plots of the pooled sensitivity and specificity for the diagnostic performance of artificial intelligence in the prediction and diagnosis of venous thromboembolism in the training set. The values and horizontal lines indicate pooled estimates with 95% confidence intervals (95% CIs). Weight values are obtained from random effects analysis.

SROC for the diagnostic performance of artificial intelligence in the prediction and diagnosis of venous thromboembolism in the training set. SROC indicates summary receiver operating characteristic.
Subgroup Analysis
We performed subgroup analyzes on studies with training sets only because there were few studies that included a test set. Subgroup analyzes included venous thrombosis type, AI type, whether AI was used for prediction or diagnosis, and whether the period was perioperative.
In the sensitivity subgroup analysis of venous thrombosis type, the significance test showed that all PVT subgroups (z = 2.79, P = 0.005), DVT subgroups (z = 3.39, P = 0.001), PE subgroups (z = 2.63, P = 0.008), and PE/DVT subgroups (z = 6.62, P < 0.001) were meaningful. The sensitivity was 0.81 (95% CI 0.61-0.92) in the PVT subgroup, 0.88 (95% CI 0.70-0.96) in the DVT subgroup, 0.87 (95% CI 0.76-0.94) in the PE subgroup, and 0.89 (95% CI 0.63-0.98) in the PE/DVT subgroup. In the specificity subgroup analysis, the significance test showed that the DVT subgroup (z = 14.34, P < 0.001), PE subgroup (z = 6.27, P < 0.001), and PE/DVT subgroup (z = 2.88, P = 0.004) were meaningful, whereas the PVT subgroup (z = 0.84, P = 0.399) was not. The specificity was 0.74 (95% CI 0.20-0.97) in the PVT subgroup, 0.96 (95% CI 0.93-0.97) in the DVT subgroup, 0.97 (95% CI 0.91-0.99) in the PE subgroup, and 0.94 (95% CI 0.71-0.99) in the PE/DVT subgroup (Figure 5).
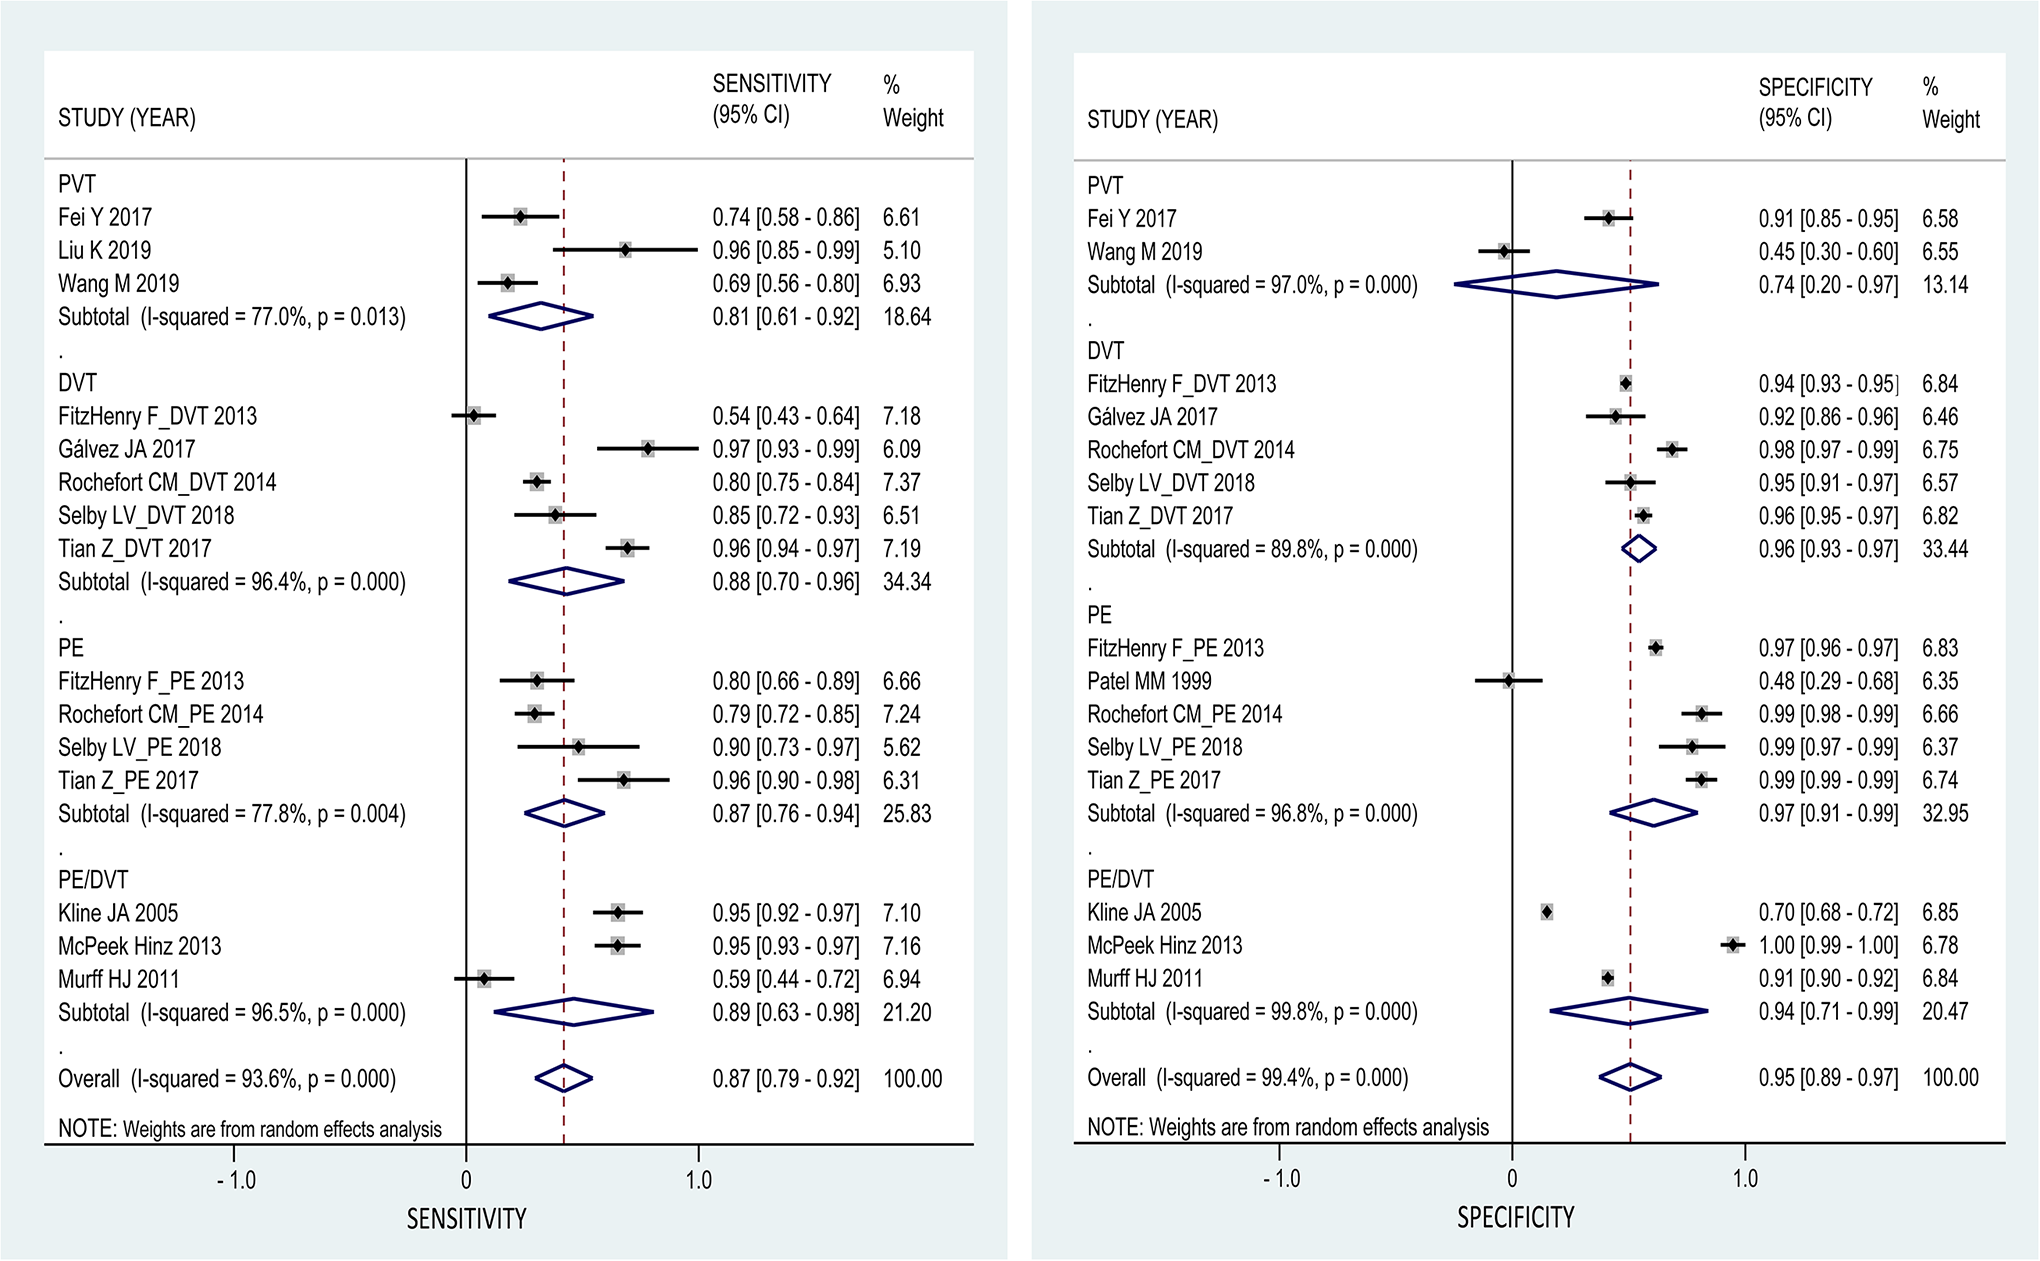
Venous thromboembolism subgroup forest plots of the pooled sensitivity and specificity for the diagnostic performance of artificial intelligence in the training set. The values and horizontal lines indicate pooled estimates with 95% confidence intervals (95% CIs). Weight values are obtained from random effects analysis.
In the sensitivity subgroup analysis of AI type, the significance test showed that the ANN subgroup (z = 2.74, P = 0.006), NLP subgroup (z = 4.26, P < 0.001), Bayesian network subgroup (z = 11.94, P < 0.001), and NLP and SVM subgroup (z = 12.03, P < 0.001) were meaningful, whereas the SVM subgroup (z = 1.63, P = 0.103) was not. The sensitivity was 0.74 (95% CI 0.58-0.86) in the ANN subgroup, 0.89 (95% CI 0.75-0.95) in the NLP subgroup, 0.95 (95% CI 0.92-0.97) in the Bayesian network subgroup, 0.87 (95% CI 0.41-0.98) in the SVM subgroup, and 0.80 (95% CI 0.76-0.83) in the NLP and SVM subgroup. In the specificity subgroup analysis, the significance test showed that the NLP subgroup (z = 11.41, P < 0.001), Bayesian network subgroup (z = 20.37, P < 0.001), and NLP and SVM subgroup (z = 11.76, P < 0.001) were meaningful, whereas the ANN subgroup (z = 0.94, P = 0.346) and SVM subgroup (z = 0.63, P = 0.528) were not. The specificity was 0.76 (95% CI 0.29-0.68) in the ANN subgroup, 0.97 (95% CI 0.95-0.98) in the NLP subgroup, 0.70 (95% CI 0.68-0.72) in the Bayesian network subgroup, 0.45 (95% CI 0.30-0.60) in the SVM subgroup, and 0.99 (95% CI 0.97-0.99) in the NLP and SVM subgroup (Figure 6).

Artificial intelligence model subgroup forest plots of the pooled sensitivity and specificity for the diagnostic performance for venous thromboembolism in the training set. The values and horizontal lines indicate pooled estimates with 95% confidence intervals (95% CIs). Weight values are obtained from random effects analysis.
In the sensitivity subgroup analysis of prediction or diagnosis, the significance test showed that the diagnosis subgroup (z = 7.18, P < 0.001) was meaningful, whereas the prediction subgroup (z = 1.95, P = 0.052) was not. The sensitivity in the prediction subgroup was 0.77 (95% CI 0.50-0.92) and that in the diagnosis subgroup was 0.91 (95% CI 0.84-0.95). In the specificity subgroup analysis, the significance test showed that the prediction subgroup (z = 7.62, P < 0.001) and diagnosis subgroup (z = 4.42, P < 0.001) were meaningful. The specificity in the prediction subgroup was 0.96 (95% CI 0.92-0.98) and that in the diagnosis subgroup was 0.93 (95% CI 0.81-0.98) (Supplementary Figure S9).
In the sensitivity subgroup analysis of whether the period was perioperative, the significance test showed that the nonperioperative subgroup (z = 7.39, P < 0.001) and perioperative subgroup (z = 3.32, P = 0.001) were meaningful. The sensitivity in the nonperioperative subgroup was 0.92 (95% CI 0.86-0.96) and that in the perioperative subgroup was 0.73 (95% CI 0.60-0.83). In the specificity subgroup analysis, the significance test showed that the nonperioperative subgroup (z = 4.22, P < 0.001) and perioperative subgroup (z = 8.38, P < 0.001) were significant. The specificity in the nonperioperative subgroup was 0.95 (95% CI 0.84-0.99), and that in the perioperative subgroup was 0.93 (95% CI 0.88-0.96) (Supplementary Figure S10).
Discussion
AI is characterized by speed, accuracy and reliability; thus, this technology has been widely applied in clinical practice, 8,9 including the prediction and diagnosis of venous thrombosis, 14,15 and the results have been inspiring. In this study, we performed a meta-analysis to assess the predictive and diagnostic role of AI in VTE across different studies for the first time, and our results showed that AI may be used for the diagnosis and prediction of venous thrombosis, illustrating the robust predictive and diagnostic role of AI in this clinical setting.
According to our inclusion and exclusion criteria, 12 studies were included with various types of AI models used and types of VTE explored across the included studies. Despite this variation, all the included studies focused on the predictive and diagnostic value of AI in VTE, so we combined the different AI models to better evaluate the role of AI in this setting. Our results showed that the performance of AI in the training set and test set was consistent. In the training set, the pooled sensitivity, specificity and area under the SROC curve were 0.87 (95% CI 0.79-0.92), 0.95 (95% CI 0.89-0.97) and 0.97 (95% CI 0.95-0.98), respectively. In the test set, the pooled sensitivity, specificity, and area under the SROC curve were 0.87 (95% CI 0.74-0.93), 0.96 (95% CI 0.79-0.99) and 0.98 (95% CI 0.97-0.99), respectively. This finding indicates that the repeatability of the results is excellent; however, the results of the test set were based on 5 studies. Thus, these findings need to be validated further in an extensive external validation study with new data before the widespread application of the AI model.
In the subgroup analysis, the AI model showed excellent performance in the prediction and diagnosis subgroups as well as the perioperative and nonperioperative period subgroups, suggesting that AI models are stable tools that can handle a variety of clinical needs. However, the AI model showed poorer performance in predicting or diagnosing in the SVM 17,26 subgroup (AI model type), PVT 16,26 subgroup (VTE type) and the ANN 16,24 subgroup (AI model type). It is notable that only 2 studies were included for these subgroups, and the sample size ranged from 224 to 263. This small sample size may have affected the reliability of the results. The poorer performance may also be due to the different operating mechanisms of different AI models 14 –16 and the differences between different types of venous thrombosis. 14 –18 Thus, the results of these subgroups need to be interpreted with caution.
Significant heterogeneity was noted in our study, the causes of which may be as follows: (1) The AI models used in these included studies were different. The operation mechanisms of the AI models differed across studies. For example, NLP mainly extracts text information from patients’ ultrasound and radiation reports for automatic learning to achieve the purpose of disease diagnosis and prediction from medical records, 14,15,23 whereas neural networks 16,24 and SVMs 26 perform machine learning based on patient characteristics, biochemical detection parameters, and ultrasound and imaging examinations to predict and diagnose venous thrombosis. (2) The research objectives also differed. Some studies focused on intraoperative or postoperative complications, 20,23 whereas others focused on different types of surgery and disease. (3) Three types of venous thrombosis, PE, DVT and PVT, were included in this study. The heterogeneity in our study may affect our results; however, our study included 51383 patients—a relatively large sample size—enabling us to quantitatively assess the role of AI in disease diagnosis and prediction and making it the most powerful and comprehensive synthesis of the evidence on this issue to date.
Given the limited number of studies on the diagnosis and prediction of venous thrombosis by AI, we cannot make this meta-analysis more precise. Nevertheless, different AI methods have achieved good results in different design schemes for different thrombus types in different situations. This information is enough to indicate the value of AI in the prediction and diagnosis of venous thrombosis. The prediction and accurate diagnosis of venous thrombosis is of great significance. It can reduce the death rate of patients, especially accidental death. 27 –33 Therefore, we could prevent, discover and treat venous thrombosis as early as possible with AI models.
Nonetheless, several commercial software programs have been developed. 14,21 In this analysis, the AI model differed across the included studies, and few studies compared the efficacy of different models. 16
Thus, it is difficult to judge which model is better. In addition, the number of inputs and the type of input variables are very important for developing a reliable AI model. However, unfortunately, different studies used different input indexes. Thus, even though each study included optimal indexes based on their own population, we could not extract a group of consistent inputs from the published data. These limitations weaken the applicability of the developed AI model. Future studies should address these issues properly and are encouraged to develop a highly applicable and convenient AI model for widespread use in clinical practice.
Conclusion
This is the first meta-analysis to assess the role of AI in VTE diagnosis and prediction, and our results showed that AI has a good ability to diagnose and predict venous thrombosis with high sensitivity, specificity and area under the SROC curve values. AI models perform well regardless of the different thrombus types, the different AI methods used, and whether the period is perioperative. With the development and application of AI in the field of venous thrombosis research, more in-depth and accurate analyzes can be performed in the future, which should allow for a highly applicable and convenient AI model to be developed for widespread use in clinical practice.
Supplemental Material
Supplemental Material, sj-docx-1-cat-10.1177_10760296211021162 - Prediction and Diagnosis of Venous Thromboembolism Using Artificial Intelligence Approaches: A Systematic Review and Meta-Analysis
Supplemental Material, sj-docx-1-cat-10.1177_10760296211021162 for Prediction and Diagnosis of Venous Thromboembolism Using Artificial Intelligence Approaches: A Systematic Review and Meta-Analysis by Qi Wang, Lili Yuan, Xianhui Ding and Zhiming Zhou in Clinical and Applied Thrombosis/Hemostasis
Supplemental Material
Supplemental Material, sj-docx-2-cat-10.1177_10760296211021162 - Prediction and Diagnosis of Venous Thromboembolism Using Artificial Intelligence Approaches: A Systematic Review and Meta-Analysis
Supplemental Material, sj-docx-2-cat-10.1177_10760296211021162 for Prediction and Diagnosis of Venous Thromboembolism Using Artificial Intelligence Approaches: A Systematic Review and Meta-Analysis by Qi Wang, Lili Yuan, Xianhui Ding and Zhiming Zhou in Clinical and Applied Thrombosis/Hemostasis
Supplemental Material
Supplemental Material, sj-tif-1-cat-10.1177_10760296211021162 - Prediction and Diagnosis of Venous Thromboembolism Using Artificial Intelligence Approaches: A Systematic Review and Meta-Analysis
Supplemental Material, sj-tif-1-cat-10.1177_10760296211021162 for Prediction and Diagnosis of Venous Thromboembolism Using Artificial Intelligence Approaches: A Systematic Review and Meta-Analysis by Qi Wang, Lili Yuan, Xianhui Ding and Zhiming Zhou in Clinical and Applied Thrombosis/Hemostasis
Supplemental Material
Supplemental Material, sj-tif-10-cat-10.1177_10760296211021162 - Prediction and Diagnosis of Venous Thromboembolism Using Artificial Intelligence Approaches: A Systematic Review and Meta-Analysis
Supplemental Material, sj-tif-10-cat-10.1177_10760296211021162 for Prediction and Diagnosis of Venous Thromboembolism Using Artificial Intelligence Approaches: A Systematic Review and Meta-Analysis by Qi Wang, Lili Yuan, Xianhui Ding and Zhiming Zhou in Clinical and Applied Thrombosis/Hemostasis
Supplemental Material
Supplemental Material, sj-tif-2-cat-10.1177_10760296211021162 - Prediction and Diagnosis of Venous Thromboembolism Using Artificial Intelligence Approaches: A Systematic Review and Meta-Analysis
Supplemental Material, sj-tif-2-cat-10.1177_10760296211021162 for Prediction and Diagnosis of Venous Thromboembolism Using Artificial Intelligence Approaches: A Systematic Review and Meta-Analysis by Qi Wang, Lili Yuan, Xianhui Ding and Zhiming Zhou in Clinical and Applied Thrombosis/Hemostasis
Supplemental Material
Supplemental Material, sj-tif-3-cat-10.1177_10760296211021162 - Prediction and Diagnosis of Venous Thromboembolism Using Artificial Intelligence Approaches: A Systematic Review and Meta-Analysis
Supplemental Material, sj-tif-3-cat-10.1177_10760296211021162 for Prediction and Diagnosis of Venous Thromboembolism Using Artificial Intelligence Approaches: A Systematic Review and Meta-Analysis by Qi Wang, Lili Yuan, Xianhui Ding and Zhiming Zhou in Clinical and Applied Thrombosis/Hemostasis
Supplemental Material
Supplemental Material, sj-tif-4-cat-10.1177_10760296211021162 - Prediction and Diagnosis of Venous Thromboembolism Using Artificial Intelligence Approaches: A Systematic Review and Meta-Analysis
Supplemental Material, sj-tif-4-cat-10.1177_10760296211021162 for Prediction and Diagnosis of Venous Thromboembolism Using Artificial Intelligence Approaches: A Systematic Review and Meta-Analysis by Qi Wang, Lili Yuan, Xianhui Ding and Zhiming Zhou in Clinical and Applied Thrombosis/Hemostasis
Supplemental Material
Supplemental Material, sj-tif-5-cat-10.1177_10760296211021162 - Prediction and Diagnosis of Venous Thromboembolism Using Artificial Intelligence Approaches: A Systematic Review and Meta-Analysis
Supplemental Material, sj-tif-5-cat-10.1177_10760296211021162 for Prediction and Diagnosis of Venous Thromboembolism Using Artificial Intelligence Approaches: A Systematic Review and Meta-Analysis by Qi Wang, Lili Yuan, Xianhui Ding and Zhiming Zhou in Clinical and Applied Thrombosis/Hemostasis
Supplemental Material
Supplemental Material, sj-tif-6-cat-10.1177_10760296211021162 - Prediction and Diagnosis of Venous Thromboembolism Using Artificial Intelligence Approaches: A Systematic Review and Meta-Analysis
Supplemental Material, sj-tif-6-cat-10.1177_10760296211021162 for Prediction and Diagnosis of Venous Thromboembolism Using Artificial Intelligence Approaches: A Systematic Review and Meta-Analysis by Qi Wang, Lili Yuan, Xianhui Ding and Zhiming Zhou in Clinical and Applied Thrombosis/Hemostasis
Supplemental Material
Supplemental Material, sj-tif-7-cat-10.1177_10760296211021162 - Prediction and Diagnosis of Venous Thromboembolism Using Artificial Intelligence Approaches: A Systematic Review and Meta-Analysis
Supplemental Material, sj-tif-7-cat-10.1177_10760296211021162 for Prediction and Diagnosis of Venous Thromboembolism Using Artificial Intelligence Approaches: A Systematic Review and Meta-Analysis by Qi Wang, Lili Yuan, Xianhui Ding and Zhiming Zhou in Clinical and Applied Thrombosis/Hemostasis
Supplemental Material
Supplemental Material, sj-tif-8-cat-10.1177_10760296211021162 - Prediction and Diagnosis of Venous Thromboembolism Using Artificial Intelligence Approaches: A Systematic Review and Meta-Analysis
Supplemental Material, sj-tif-8-cat-10.1177_10760296211021162 for Prediction and Diagnosis of Venous Thromboembolism Using Artificial Intelligence Approaches: A Systematic Review and Meta-Analysis by Qi Wang, Lili Yuan, Xianhui Ding and Zhiming Zhou in Clinical and Applied Thrombosis/Hemostasis
Supplemental Material
Supplemental Material, sj-tif-9-cat-10.1177_10760296211021162 - Prediction and Diagnosis of Venous Thromboembolism Using Artificial Intelligence Approaches: A Systematic Review and Meta-Analysis
Supplemental Material, sj-tif-9-cat-10.1177_10760296211021162 for Prediction and Diagnosis of Venous Thromboembolism Using Artificial Intelligence Approaches: A Systematic Review and Meta-Analysis by Qi Wang, Lili Yuan, Xianhui Ding and Zhiming Zhou in Clinical and Applied Thrombosis/Hemostasis
Footnotes
Authors’ Note
Idea generation: Qi Wang, Zhiming Zhou. Data collection, statistical analysis, manuscript writing: Qi Wang, Lili Yuan, Xianhui Ding, Zhiming Zhou. Data curation, manuscript editing: Qi Wang, Zhiming Zhou. Institutional review board approval was not required because this study was a systematic review and meta-analysis.
Acknowledgments
We thank the authors who provided the original article that motivated this study.
Declaration of Conflicting Interests
The author(s) declared no potential conflicts of interest with respect to the research, authorship, and/or publication of this article.
Funding
The author(s) received no financial support for the research, authorship, and/or publication of this article.
Supplemental Material
Supplemental material for this article is available online.
References
Supplementary Material
Please find the following supplemental material available below.
For Open Access articles published under a Creative Commons License, all supplemental material carries the same license as the article it is associated with.
For non-Open Access articles published, all supplemental material carries a non-exclusive license, and permission requests for re-use of supplemental material or any part of supplemental material shall be sent directly to the copyright owner as specified in the copyright notice associated with the article.