
Abstract
Sepsis is a systemic response to infection with a high rate of mortality and complex pathophysiology involving inflammation, infection response, hemostasis, endothelium, and platelets. The purpose of this study was to develop an equation incorporating biomarker levels at intensive care unit (ICU) admission to predict mortality in patients with sepsis, based on the hypothesis that a combination of biomarkers representative of multiple physiological systems would provide improved predictive value. Plasma samples and clinical data were collected from 103 adult patients with sepsis at the time of ICU admission. Biomarker levels were measured using commercially available methods. A 28-day mortality was used as the primary end point. Stepwise linear regression modeling was performed to generate a predictive equation for mortality. Differences in biomarker levels between survivors were quantified using the Mann-Whitney test and the area under the receiver operating curve (AUC) was used to describe predictive ability. Significant differences (P < .05) were observed between survivors and nonsurvivors for plasminogen activator inhibitor 1 (AUC = 0.70), procalcitonin (AUC = 0.77), high mobility group box 1 (AUC = 0.67), interleukin (IL) 6 (AUC = 0.70), IL-8 (AUC = 0.70), protein C (AUC = 0.71), angiopoietin-2 (AUC = 0.76), endocan (AUC = 0.58), and platelet factor 4 (AUC = 0.70). A predictive equation for mortality was generated using stepwise linear regression modeling, which incorporated procalcitonin, vascular endothelial growth factor, the IL-6:IL-10 ratio, endocan, and platelet factor 4, and demonstrated a better predictive value for patient outcome than any individual biomarker (AUC = 0.87). The use of mathematical modeling resulted in the development of a predictive equation for sepsis-associated mortality with performance than any individual biomarker or clinical scoring system which incorporated biomarkers representative of multiple systems.
Introduction
Sepsis is a systemic response to infection characterized by a dysregulated inflammatory response. Sepsis and associated illnesses are major causes of death in the United States and around the world. In 2010, “septicemia” was listed by the Centers for Disease Control as the 11th most common cause of death. 1 In that same year, more than 132 000 hospitalized patients in the United States died with a first-listed diagnosis of sepsis, 2 and between 1999 and 2016, 2 470 666 deaths (6% of total deaths in the United States) listed sepsis among the causes of death, 3 with estimates of short-term rates (ie, 28 days) of mortality in sepsis at between 14% and 30%. 4 –9
The defining pathophysiologic feature of sepsis is the overwhelming host inflammatory response to infection; although a robust immune response is necessary to overcome infection, the immune response in sepsis occurs to excess and may result in hemodynamic instability and multi-organ failure. In addition to this hyperinflammatory response, patients with septic may experience qualitative defects in the function of neutrophils and other immune cells. Patients may also progress into a state of “immune paralysis” in which the resources of the immune system are exhausted and a patient can no longer mount an effective defense against infection. However, numerous other processes, such as coagulation dysfunction, endothelial dysfunction, and platelet activation are involved in the development and progression of sepsis and may contribute greatly to patient outcome.
Currently, the ability to predict mortality in septic patients at early disease stages is limited. Improved identification of patients with elevated risk of mortality, particularly at early disease stages, may help to guide clinical decision-making by promoting the earlier initiation of potentially life-saving supportive interventions. Many studies have attempted to identify individual biomarkers as predictive of outcome in sepsis. 10 –14 Other studies have investigated the ability of various clinical scoring systems, such as the Sequential Organ Failure Assessment (SOFA) score, 15 quick SOFA, 9 Systemic Inflammatory Response Syndrome (SIRS) criteria, 9 or the Acute Physiology and Chronic Health Evaluation (APACHE II) score. 16 These scores have demonstrated predictive values for outcome similar to several individual biomarkers, with area under receiver operating curve (AUC) values in the range of 0.65 to 0.80. 9,15,16 While these clinical scores are descriptive of the hemodynamics and clinical status of patients, they do not account for the underlying molecular pathophysiology of sepsis; rather, they are descriptors of the symptoms of the disruption of homeostasis occurring in this disease.
Another approach to the prediction of outcome is the development of a predictive algorithm incorporating a panel of biomarkers. Attempts to do this in septic patients have largely used panels of related markers such as the inflammatory cytokines, 17 –20 endogenous anticoagulants, 21 endothelial markers, 22 microparticles (MPs), 23 metabolic markers, 24 clinical data, 25 or cardiac biomarkers. 26 Each of these types of factor contributes to the pathophysiology of sepsis; however, these approaches have not yielded remarkable results. In contrast, a combination of biomarkers representing not just one process, such as inflammation, but rather an array of processes representing multiple aspects of the molecular pathophysiology of sepsis may provide improved predictive ability compared to individual biomarkers or biomarkers of a single system.
Stepwise linear regression modeling is a statistical approach to the construction of a predictive model that mathematically selects the most optimal parameters for inclusion in a predictive equation from among a larger pool of possibilities. This approach has been used successfully in other complex patient populations, including kidney transplant recipients, 27 patients receiving extended deep vein thrombosis (DVT) prophylaxis following hip fracture surgery, 28 and pediatric intensive care unit (ICU) patients. 29
Based on the hypothesis that biomarkers of multiple physiological systems will provide improved diagnostic and prognostic relevance over individual biomarkers or biomarkers of a single system, levels of biomarkers representative of multiple physiological systems were measured in plasma from a cohort of 103 adult ICU patients with sepsis. Biomarkers were selected to represent several different physiological categories, namely hemostasis, inflammation, infection, endothelial function, and platelet function. Hemostatic biomarkers analyzed include D-dimer, prothrombin fragment 1.2 (F1.2), and plasminogen activator inhibitor 1 (PAI-1). Inflammatory and infection biomarkers analyzed include nucleosomes, high mobility group box 1 (HMGB-1), procalcitonin (PCT), the interleukins (ILs): IL-1α, IL-1β, IL-2, IL-4, IL-6, IL-8, and IL-10, tumor necrosis factor α (TNFα), interferon γ (IFNγ), monocyte chemoattractant protein 1 (MCP-1), epidermal growth factor (EGF), and vascular endothelial growth factor (VEGF). Endothelial biomarkers analyzed include tissue factor pathway inhibitor (TFPI), Protein C, endocan, angiopoietin 2 (Ang-2), and von Willebrand factor (vWF). Platelet biomarkers analyzed include CD40L, platelet factor 4 (PF4), MPs, and microparticle-derived tissue factor (MP-TF). Stepwise linear regression modeling was used to generate a predictive equation for mortality outcome based on levels of these biomarkers at the time of ICU admission
Materials and Methods
Patient Samples
Plasma samples from adult patients with sepsis and suspected disseminated intravascular coagulation (DIC) were collected under an institutional review board–approved protocol as described previously. 30 –32 Samples were collected from adult patients in the ICU at ICU admission, and all patients enrolled in the study (or a legally authorized representative) provided informed consent. Baseline (day 0) samples and accompanying data were available from 103 patients.
In order to qualify for enrollment in this study, patients were required to meet the criteria for SIRS and have an identified or suspected focus of infection. Systemic Inflammatory Response Syndrome was defined as the presence of 2 or more of the following: (1) temperature <36°C or >38°C, (2) heart rate >90 beats per minute, (3) respiratory rate >20 beats per minute or PaCO2 < 32 mm Hg, (4) white blood cell (WBC) count ≥12 000 or ≤4000 cells/mm3 or >10% bands. Patients were excluded from the study if they had received a blood transfusion within the past 4 months, platelet transfusion within the past 14 days, or platelet count of less than 20 K/μL. Patients were also excluded from this study if they had a preexisting disorder affecting platelet number or function, including idiopathic thrombocytopenic purpura, thrombotic thrombocytopenic purpura, hemolytic uremic syndrome, end-stage liver disease, myeloproliferative disorders, multiple myeloma, Waldenstrom macroglobulinemia, end-stage renal disease requiring hemodialysis, or inherited platelet disorders such as Bernard-Soulier syndrome, gray platelet syndrome, May-Hegglin anomaly, Wiskott-Aldrich syndrome, Glanzmann thrombasthenia, Chediak-Higashi syndrome, Hermansky-Pudlak syndrome, or thrombocytopenia-absent radius syndrome.
Blood was collected into 3.2% sodium citrate and centrifuged to prepare platelet poor plasma. Plasma was collected, aliquoted, and stored at −80ºC prior to analysis.
Clotting Assays: PT and Fibrinogen
Prothrombin time (PT)/international normalized ratio (INR) and fibrinogen were measured using standard operating procedures on an ACL-ELITE automated coagulation analyzer (Instrumentation Laboratory, Bedford, Massachusetts). This instrument uses an optical method to detect clot formation in a plasma sample. Recombiplastin (Instrumentation Laboratory) was used as the PT reagent.
Biomarker Levels
Commercially available enzyme-linked immunosorbent assays were performed according to the manufacturer’s instructions. The biomarkers measured and assays used were as follows: D-dimer, MP-TF, MP, PF4, and vWF (Hyphen BioMed, Neuville-Sur-Oise, France); PAI-1 and TFPI (Stago Asserachrom, Asnieres-Sur-Seine, France); CD40L and Ang-2 (R&D Systems, Minneapolis, Minnesota); endocan (Lunginnov, Lille, France); HMGB-1 protein (LifeSpan BioSciences, Seattle, Washington); nucleosomes (Cell Death Assay; Roche Diagnostics, Indianapolis, Indiana); procalcitonin (Abcam, Cambridge, United Kingdom); prothrombin fragment F1.2 (Dade Behring-Siemens, Erlangen, Germany).
A Randox Cytokine and Growth Factors High-Sensitivity Array assay kit was used to quantify IL-2, IL-4, IL-6, IL-8, IL-10, VEGF, IFNγ, TNFα IL-α, IL-1β MCP-1, and EGF (Randox, London, United Kingdom). This allowed quantification of all factors in a single patient sample simultaneously using a sandwich chemiluminescent immunoassay.
Each biochip provided in the kit contained 12 test regions, each with a different immobilized antibody specific to a different cytokine. The chip was incubated with 100 μL of plasma sample. After washing, conjugate consisting of horse radish peroxidase-labeled, analyte-specific antibody was incubated with the chip. Increased level of a bound cytokine caused increased binding of conjugate and thus increased chemiluminescent signal emitted upon activation of the signal reagent. The luminescent signal generated in each region of the biochip was translated into analyte concentration by the Randox Evidence Investigator using a calibration curve generated based on controls of known concentration.
Functional levels of protein C were measured using a clot-based assay performed using an ST4 coagulation analyzer (STACLOT, Diagnostica Stago, Parsippany, New Jersey). Patient and control plasmas were diluted 1:10 in Owren Koller Buffer. A 50 μL of diluted sample, 50 μL of protein C-deficient plasma (Diagnostica Stago), and 50 μL of Protein C activator (Diagnostica Stago) were incubated in a sample cuvette with a metal mixing ball for 180 seconds at 37°C; 50 μL of 0.2 M CaCl2 was added to each sample, initiating the clotting reaction. Time to clot formation was recorded as the time at which the metal ball was prevented from moving.
Protein C level, measured as percentage of normal value, was calculated from the time to clot for each sample based on a standard curve. The standard curve consisted of dilutions of normal human pooled plasma at 100%, 75%, 50%, 25%, 12.5%, and 0%, diluted 1:10 in Owren Koller buffer. Clotting time had an inverse relationship with protein C activity level.
Stepwise Linear Regression Modeling
Stepwise linear regression modeling was performed using MATLAB software (Mathworks, Natick, Massachusetts). Stepwise linear regression is a mathematical modeling approach in which a linear equation incorporating relevant predictor variables (ie, biomarker levels) to predict the value of an output variable is developed using an iterative process to predict the value of a response variable (ie, mortality) incorporating only data that significantly alter the model fit. This approach is shown in graphic form in Figure 1. In this technique, the initial model incorporates no predictor variables. In each iteration of the model, the variable that yields the greatest statistically significant improvement in model fit by its addition is added to the model. This process is repeated until no variable remains that improves model fit when added.

Schematic of stepwise linear regression modeling approach.
Data tables including mortality as the response variable and biomarker levels as the predictor values were imported into MATLAB from Microsoft Excel. Models were developed using the “stepwiselm” function. Both linear and constant model starting assumptions were used, as specified in the results. Model coefficients were recorded and model output value for each patient was calculated from the appropriate biomarker levels using Microsoft Excel. Model fit was evaluated using receiver operator curve (ROC) analysis in GraphPad Prism using the AUC as the descriptor of model quality.
Statistical Analysis
Data are presented as mean ± standard deviation (SD) or mean ± standard error of the mean (SEM) as specified. P < .05 was used as the cutoff for statistical significance, and computed P values are present throughout this document. Results were tabulated and stored using Microsoft Excel (Microsoft Corporation, Redmond, Washington). Statistical analysis was performed and graphs were generated using GraphPad Prism (GraphPad Inc, La Jolla, California).
Biomarker levels in patient populations are presented as mean ± SEM. Nonparametric statistical tests were used throughout as these tests are more appropriate for analysis of data sets with high variability than traditional parametric tests. Differences in biomarker levels between 2 patient groups (ie, survivors and nonsurvivors) were analyzed using the Mann-Whitney test. Predictive values were analyzed using ROC analysis, with the main output for this being the AUC.
Results
Patient Cohort Baseline Characteristics
Plasma samples were collected according to the protocols detailed in the Materials and Methods section. Patient treatment was not altered as a result of participation in this study, and all patients provided informed consent. Plasma samples were collected from 103 patients with sepsis within 48 hours of ICU admission. Basic demographic information for this cohort is shown in Table 1.
Patient Cohort Baseline Characteristics.

Abbreviation: BMI, body mass index.
The mean age of 57.1 ± 18.6 years describes a predominantly middle-aged population and is typical of sepsis cohorts in the literature. 10,15,33 –35 The mean body mass index (BMI = 31.2) describes an obese patient, and 76% of patients are classified as either overweight or obese (BMI ≥ 25). The cohort is split fairly evenly between males and females (53.4% male vs 46.6% female), and racial and ethnic makeup of this cohort (84.5% white) is typical of the geographic area in which these samples were collected. The most prevalent recorded comorbidity in this patient cohort was hypertension, reported in 45.6% of patients. Diabetes was documented in 25.2% of patients. Diabetes is well known to be associated with inflammation, vascular dysfunction, and thrombosis and to be a risk factor for death due to these processes. This may contribute to the course of disease in diabetic patients with sepsis. In this cohort, diagnosis of diabetes was not significantly associated with mortality (χ2 test, P = .15). Of the biomarkers measured in this study, only IL-1α and TFPI were significantly different between diabetic and nondiabetic patients.
Disease Severity and Patient Outcomes
Outcome and disease severity information for the septic patient cohort is shown in Table 2. The primary measure of outcome in this patient population was 28-day mortality. This cohort was comprised of 88 survivors and 15 nonsurvivors, resulting in an overall 28-day mortality rate of 14.6%. While this rate of mortality is relatively low for septic patient cohorts described in the literature, numerous studies have described cohorts of septic patients with mortality of less than 20%. 32,36 –40
Outcome and Disease Severity Information.

Abbreviations: APACHE II, Acute Physiology and Chronic Health Evaluation; DIC, disseminated intravascular coagulation; SD, standard deviation; SOFA, Sequential Organ Failure Assessment.
Three clinical scoring systems were applied in this patient cohort to provide distinct measures of severity of illness. Both the SOFA and APACHE-II were calculated as common measures of severity of organ failure and illness in critically ill patients. In this patient cohort, the SOFA score was 5.9 ± 3.7 (mean ± SD) and the APACHE II score was 17.4 ± 7.3 (mean ± SD). These SOFA and APACHE II scores are at the low end of the range typically reported in the literature. 13,15,18,37,40 –44
Additionally, the International Society of Thrombosis and Hemostasis (ISTH) DIC score was also computed in all patients. The development of coagulopathy in septic patients is associated with increased mortality. 42,45 –49 The ISTH scoring algorithm for DIC assigns points for abnormal values of platelet count, INR, D-dimer, and fibrinogen. The presence of a predisposing condition for DIC, such as sepsis, cancer, trauma, or toxin exposure, is a prerequisite for the use of this scoring algorithm. In this cohort, all patients were diagnosed with sepsis, fulfilling this requirement. Using this scoring system, a score of 5 or greater was classified as sepsis + overt DIC, a score of 3 to 4 was categorized as sepsis + nonovert DIC, and a score of 2 or lower was categorized as sepsis + no DIC. At baseline, 20 patients had sepsis + no DIC, 59 patients had sepsis + nonovert DIC, and 24 patients had sepsis + overt DIC.
Association of Biomarker Levels With Survival
Biomarkers were measured in patient plasma as described in the Materials and Methods section. As sepsis is a disease involving significant function of numerous physiological processes, biomarkers representative of inflammation (IL-2, IL-4, IL-6, IL-8, IL-10, VEGF, IFNγ, TNFα, IL-1α, IL-1β, MCP-1, EGF, and IL-6: IL-10 ratio), infection (PCT, nucleosomes, and HMGB-1), endothelial function (Protein C, TFPI, endocan, Ang-2, and vWF), platelet function (platelet count, CD40L, PF-4, MP, and MP-TF), and hemostatic function (INR, D-Dimer, F1.2, PAI-1, and fibrinogen) were measured in all patient samples. These categories of markers were chosen as all of these systems are known to play a significant role in sepsis at the molecular level. Markers within each category were selected to represent multiple facets of each system, which may exhibit different responses in the disease state.
Differences in baseline biomarker levels between survivors and nonsurvivors were evaluated using the Mann-Whitney t test, with P < .05 as the cutoff for significance. The predictive power of each biomarker for mortality was evaluated using ROC analysis; the AUC is reported as the quantification of this analysis.
As shown in Figure 2 and Table 3, significant differences in biomarker levels between survivors and nonsurvivors were particularly prevalent among biomarkers of infection, namely PCT (P = .0005, AUC = 0.77) and HMGB-1 (P = .031, AUC = 0.67) and endothelial function. The elevation of HMGB-1 and PCT in nonsurvivors demonstrates that infection and infection response are major determinants of patient outcome. Furthermore, PCT, a biomarker currently available in the clinical setting with utility in distinguishing bacterial infection from noninfectious processes, had the highest AUC for the prediction of mortality of any biomarker measured in this study. The endogenous anticoagulant protein C was significantly reduced in nonsurvivors compared to survivors (P = .0093, AUC = 0.71). Both endocan (P = .025, AUC = 0.58) and Ang-2 (P = .001, AUC = 0.76) were significantly elevated in nonsurvivors compared to survivors.
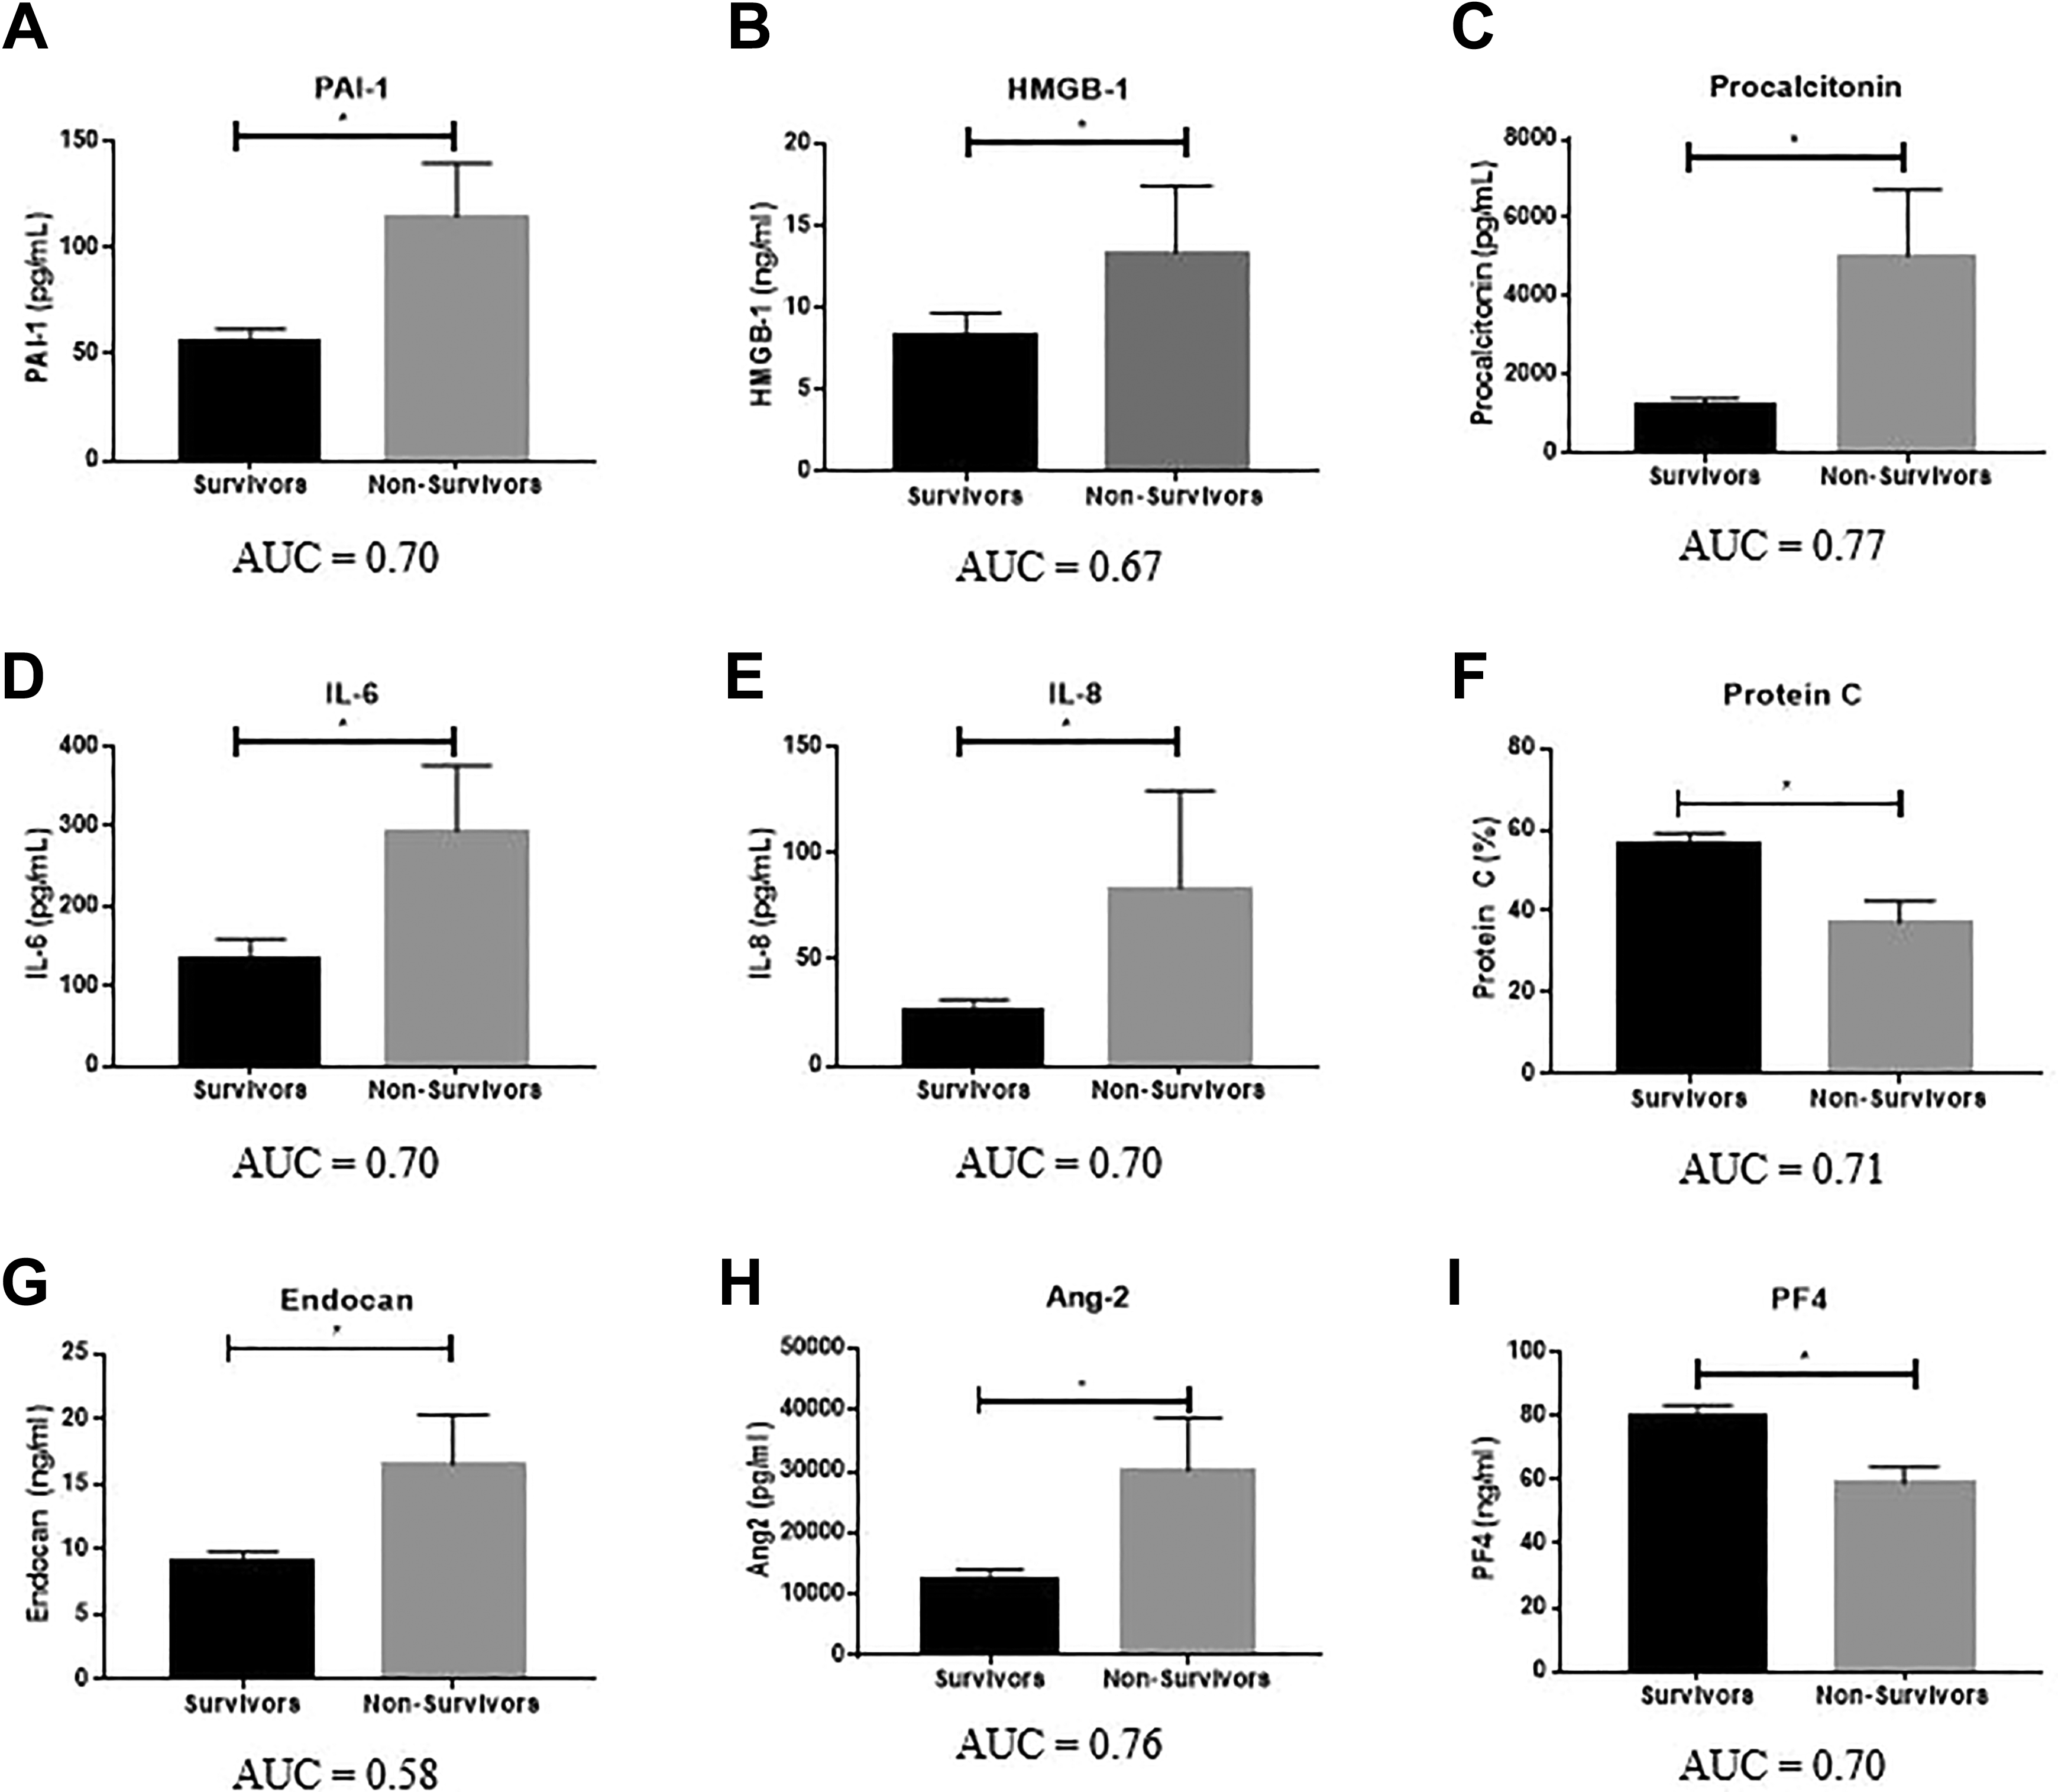
Association of biomarker levels with survival. Significance calculated between groups using the Mann-Whitney test, with P < .05 as the cutoff for significance (indicated by *). Data are shown as mean ± SEM. Area under the receiver operating curve (AUC) is reported below each graph. SEM indicates standard error of the mean.
Comparison of Biomarkers With Significant Differences Between Survivors and Nonsurvivors.

Abbreviation: Ang-2, angiopoietin 2; AUC, area under receiver operating curve; HMGB-1, high mobility group box 1; IL, interleukin; PAI-1, plasminogen activator inhibitor 1; PF4, platelet factor 4; SEM, standard error of the mean.
Of the measured inflammatory markers, IL-6 (P = .02, AUC = 0.70) and IL-8 (P = .015, AUC = 0.70) were significantly elevated in nonsurvivors compared to survivors. In general, baseline levels of hemostatic and platelet biomarkers were poor predictors of mortality in septic patients. Of the hemostatic markers, only PAI-1 showed a significant difference between survivors and nonsurvivors (AUC = 0.70; P = .015). Of note, none of the markers typically used to assess coagulopathy in septic patients (INR, platelet count, D-dimer, or fibrinogen) showed significant differences between survivors and nonsurvivors. Of the platelet markers, only PF4 showed a significant association with mortality (P = .016, AUC = 0.70), with significantly lower levels observed in nonsurvivors compared to survivors.
Stepwise Linear Regression Modeling
Stepwise linear regression modeling was performed in order to create an equation to predict mortality in septic patients. Stepwise linear regression is a computational technique in which an iterative algorithm is employed to construct an equation to predict the value of a “response variable” based on a subset of “predictor variable” selected by the algorithm from among all input “predictor values.” Two starting assumptions are possible for this model; a “constant” starting assumption in which all predictor variables are assumed to be included in the model or a “linear” starting assumption in which no predictor variables are assumed to be included in the model. With a constant starting assumption, variables are added to the model if inclusion yields a statistically significant improvement to model fit. This process continues until no variables remain which improve the fit of the model when added. This starting assumption yielded models with 3 to 5 variables and was accordingly the approach of choice for this study.
The output of this process is an equation composed of a constant term and coefficients for each included predictor variable. This equation is used to predict the value of the response variable for a given patient. Model performance was assessed using ROC analysis.
Data tables defining mortality as the response variable and baseline biomarker levels as the predictor values were imported into MATLAB from Microsoft Excel. Models were developed using the “stepwiselm” function.
Two different approaches were used for the prediction of mortality in this patient cohort. In the first approach, only measured biomarkers (levels of D-dimer, F1.2, PAI-1, INR, platelets, fibrinogen, nucleosomes, HMGB-1, PCT, IL-2, IL-4, IL-6, IL-8, IL-10, VEGF, IFNγ, TNFα, IL-1α, IL-1β, MCP-1, EGF, IL-6:IL-10 ratio, TFPI, Protein C, endocan, Ang-2, vWF, CD40 L, MP, MP-TF, and PF4) were included. In the second approach, the additional clinical parameters of DIC score, hemoglobin, WBC count, BMI, age, SOFA score, and APACHE-II score were included in the analysis.
The models generated for the prediction of mortality in this patient cohort are described in Table 4. The ROC for each model are shown in Figure 3. Both models generated using this approach had greater predictive value (AUC of 0.84-0.87) than any individual biomarker in this patient cohort (maximum individual AUC = 0.77 for PCT). Furthermore, the models generated using this approach incorporated biomarkers representative of multiple physiological systems and processes.
Stepwise Linear Regression Modeling for Prediction of Mortality.

Abbreviations: APACHE II, Acute Physiology and Chronic Health Evaluation; AUC, area under receiver operating curve; IL, interleukin; PF4, platelet factor 4; VEGF, vascular endothelial growth factor; WBC, white blood cell.

Receiver operating curves for predictive models. Predictive models were created with coefficients as described in Table 4.
The best model was generated using a constant starting assumption and biomarkers alone. This model included 5 variables: PCT, representative of infection; VEGF and the IL-6: IL-10 ratio, representative of inflammation; endocan, representative of endothelial function; and PF4, representative of platelet activation. The overall AUC for prediction of mortality using this model was 0.87. The inclusion of clinical variables did not improve AUC; the model generated using the constant starting assumption and biomarkers plus clinical data had an AUC value of 0.84. This model supported previous results on the importance of infection response to the disease progression and outcome of sepsis and DIC; both PCT and WBC count, markers of infection response, were included in this model.
The results of this modeling analysis support the hypothesis that while a single biomarker cannot accurately predict outcome in this complex patient population, a combination of biomarkers representative of multiple physiological systems will have improved predictive value. The model generated using the biomarker data alone provides a superior predictive value for outcome than any single measured biomarker and accounts for the activity of multiple physiological systems and should be further validated in additional patient cohorts.
Discussion
Sepsis is a complex syndrome involving dysfunction of multiple physiological systems and processes. Infection response, inflammation, endothelial function, platelet function, and coagulation are all involved in the molecular pathophysiology of sepsis and can result in systemic manifestations such as organ failure. The clinical outcomes of patients with sepsis are somewhat difficult to predict on admission due both to the complexity of the pathophysiology and the heterogeneity of the evolving disease process. However, accurate prediction of outcome in septic patients may be desirable in order to guide treatment decisions and provide accurate information to patients and their families. Additionally, as the markers measured in this study reflect aspects of the pathophysiology of sepsis that may not be readily assessed through current clinical tools, such as the balance between pro- and anti-inflammatory factors and endothelial function, this type of predictive algorithm may allow for the identification of patients at risk of mortality who are not identified using current approaches.
Several clinical scoring systems are often reported for description of severity of illness in patients with sepsis, particularly the SOFA and APACHE II scores. While these scoring systems have moderate predictive ability for mortality in sepsis, they were not designed for this purpose and are not specific for use in patients with sepsis. Numerous biomarkers have also been evaluated as predictors of outcome in sepsis patients. Typically, the best individual biomarkers have an AUC of between 0.70 and 0.75 for outcome prediction in this patient population. 10 –12,18 Biomarkers that have been identified individually in this manner include endothelial markers (Ang-2 10 ), inflammatory cytokines (IL-8, 12,18 MCP-1, 18 G-CSF, 18 IL-1β 18 ), and other novel markers such as plasma DNA or platelet-leukocyte conjugate MPs. 23
In this study, several individual biomarkers were identified as having AUC for the prediction of mortality within this range: the fibrinolytic regulator PAI-1 (AUC = 0.70), the biomarker of infection PCT (AUC = 0.77), the inflammatory cytokines IL-6 (AUC = 0.70) and IL-8 (AUC = 0.70), the endogenous anticoagulant protein C (AUC = 0.71), the endothelial marker Ang-2 (AUC = 0.76), and the PF4 (AUC = 0.70). Sepsis is commonly described as a disease of excessive inflammation with potential associated coagulation dysfunction. However, in this study, biomarkers of infection and endothelial function demonstrated a greater degree of association with mortality than inflammatory or hemostatic markers and therefore must be considered in the diagnosis, evaluation, and treatment of these patients.
The biomarkers with the greatest predictive value for outcome represent not only a single system such as inflammation but rather a variety of different pathophysiological aspects of sepsis. Therefore, it was logical to hypothesize that a combination of biomarkers representative of multiple aspects of the molecular pathophysiology of sepsis and DIC would have greater predictive ability than any single biomarker. This is distinct from many past studies that have tested combinations of biomarkers representing single aspects of the pathophysiology such as inflammatory cytokines 17 –20 or other approaches involving multiple biomarkers of a single category. 21 –26
The aim of this study was to develop an algorithm based on a combination of biomarkers to predict clinical outcome in patients with sepsis-associated DIC. This aim was based on the hypothesis that a combination of biomarkers representative of multiple physiological processes would provide better predictive ability for outcome in sepsis patients than a single biomarker. A predictive equation for outcome was developed, incorporating PCT, VEGF, IL-6: IL-10 ratio, endocan, and PF-4. As hypothesized, biomarkers representative of multiple physiological systems were incorporated into this algorithm, which exhibited a predictive value for mortality superior to that of any individual biomarker.
The stepwise linear regression modeling approach used in this aim was valuable because it provided an unbiased method to select the optimal biomarkers for the prediction of outcome and did not rely on preconceived ideas about the potential utility of each biomarker. Biomarkers were selected for inclusion in this study based on their potential physiologic relevance to the disease process. The included biomarkers do not represent only markers currently available in clinical laboratories but rather a wider array of markers that may ultimately be appropriate for incorporation into routine clinical practice. This unbiased approach is valuable in a complex pathophysiological scenario such as sepsis-associated DIC, as the model is developed to be mathematically optimal rather than to conform to current knowledge about the utility of each parameter. This approach has been used successfully to predict outcome in other complex disease processes such as pediatric ICU patients, 29 kidney transplant patients, 27 and in patients following the hip fracture repair. 28
The most successful and robust model generated using this approach is that incorporating biomarkers only (excluding clinical data). This model incorporated 5 variables representative of 6 biomarkers (PCT, VEGF, the IL-6: IL-10 ratio, endocan, and PF-4) and had an overall AUC for prediction of mortality of 0.87, greater than the value of any individual biomarker.
The incorporation of clinical data into the predictive model weakened the predictive ability compared to models incorporating biomarkers alone (AUC 0.84 vs 0.87). Additionally, the APACHE-II score incorporated in this model is itself a complex parameter representing the measurement of numerous laboratory values.
In summary, a computational approach was used in order to generate an algorithm to predict mortality outcome in sepsis patients. This algorithm incorporated PCT, VEGF, IL-6:IL-10 ratio, endocan, and PF-4, thereby representing infection, inflammation (including both endogenous pro- and anti-inflammatory processes), endothelial function, and platelet activation, and had better predictive ability for outcome than any individual biomarker. Stepwise linear regression modeling was used to generate models for outcome prediction in sepsis patients using an unbiased approach to biomarker selection. These models supported the hypothesis that sepsis is a complex disease best described not by a single biomarker but rather by a combination of biomarkers representative of multiple physiological systems.
Footnotes
Authors’ Note
Written informed consent was obtained from the patients or their legally authorized representative for anonymized patient information to be published in this article. This material is the result of work supported with resources and use of facilities at the George E. Wahlen VA Medical Center, Salt Lake City, Utah. The contents do not represent the views of the US Department of Veterans Affairs or the US Government.
Acknowledgments
The authors would like to acknowledge the skillful assistance of the staff of the Hemostasis Research Laboratories of the Department of Pathology and the Loyola University Medical Center. The authors are thankful to Dr Scott Nauert for his assistance with MATLAB. The authors are thankful to Dr Eva Wojick, Chair of the Department of Pathology, for her support in facilitating this study.
Declaration of Conflicting Interests
The author(s) declared no potential conflicts of interest with respect to the research, authorship, and/or publication of this article.
Funding
The author(s) disclosed receipt of the following financial support for the research, authorship, and/or publication of this article: This work was supported by the NHLBI and NIA (HL112311 and HL126547 to M.T.R. and A.S.W and AG048022 to M.T.R.).