
Abstract
Disseminated intravascular coagulation (DIC) often complicates sepsis, and its early treatment is crucial for improving patient outcomes. Coagulation markers may enable earlier diagnosis of DIC. The purpose of this study was to evaluate whether the risk of DIC onset can be predicted using coagulation markers. Patients who showed symptoms of systemic inflammatory response syndrome ≥2 and the quick Sequential Organ Failure Assessment score ≥2 points were investigated. All blood samples collected from the time of hospital admission to 7 days postadmission were investigated. Patients were classified according to time of DIC onset (1) no DIC group (not DIC developed), (2) pre-DIC group (DIC onset >24 hours after admission), (3) DIC group (DIC onset at time of the admission) and according to cutoff values of coagulation markers, High group and Low group. Statistical differences were analyzed by log-rank test, Kruskal-Wallis rank test, and Friedman test. A total of 107 patients were enrolled in the study. Soluble fibrin (SF), plasminogen activator inhibitor (PAI)-1, and
Introduction
Disseminated intravascular coagulation (DIC) is characterized by intravascular activation of coagulation, which results in simultaneous widespread microvascular thrombosis and severe bleeding from various sites. 1 –3 Approximately 35% of septic patients met DIC criteria. 2 Sepsis is defined as an infection that fulfills 2 or more of the criteria for systemic inflammatory response syndrome (SIRS; body temperature >38°C or <35°C, respiratory rate >20/minute, heart rate >90 beats/minute, white blood cell >12 000/µL or <4000/µL). 4 A new definition of sepsis was published in 2016, which defines sepsis as an infection resulting in life-threating organ dysfunction, which is represented by an increase in the Sequential Organ Failure Assessment (SOFA) score 5 of 2 points or more. 6 Moreover, the quick SOFA (qSOFA) score (respiratory rate of ≥22/min, altered mentation, and systolic blood pressure of ≤100 mm Hg) was published as a new clinical bedside score to rapidly identify sepsis. 6 Internationally, the DIC scoring system established by the Scientific and Standardization Committee of the International Society of Thrombosis and Hemostasis (ISTH) is frequently used to define overt DIC. 7 In addition, a DIC scoring system proposed by the Japanese Association for Acute Medicine (JAAM) in 2005. 8 All of the DIC patients who could be diagnosed by ISTH DIC criteria could be also diagnosed by JAAM DIC criteria. 9 The JAAM DIC criteria allow for earlier diagnosis of DIC compared to the ISTH overt DIC criteria. 8
Currently, several types of drugs have been proposed for the treatment of DIC, such as antithrombin (AT). 3,10 However, DIC is difficult to treat and the mortality rate for DIC remains high (approximately 40%). 10,11 Commencing treatment before DIC development may contribute to reduction of patient mortality. 12,13 On the other hand, anticoagulant therapy for the patients with sepsis excluding the patients complicated with DIC may not contribute to reduction of mortality. 14 It was difficult to determine target patients to commence anticoagulant therapy for DIC. However, cutoff values of coagulation markers for diagnosis of sepsis-induced coagulopathy in the meta-analysis 14 were not calculated statistically and were not accurate.
Several markers associated with the coagulation pathway have been utilized for diagnosing the sepsis-induced DIC, including fibrin-related markers (fibrin–fibrinogen degradation product [FDP] and
However, they were not investigated about prospective observation of the DIC score when coagulation markers showed the abnormal values. We hypothesized that coagulation markers may enable to detect the earlier DIC phase than the exiting DIC criteria. Accurate cutoff values and prospective observation were necessary to prove the hypothesis. The purpose of this study was to propose the cutoff values of coagulation markers for evaluating DIC and to investigate the possibility of coagulation markers for prediction of DIC.
Materials and Methods
Patient Registration
Participants were patients admitted to the Emergency and Critical Care Center of Tokyo Women’s Medical University Medical Center East between April 2014 and March 2017. Those patients with infection or suspected infection who showed 2 or more symptoms of SIRS were included. Patients who fulfilled a qSOFA score of 2 points or more were retrospectively reenrolled from the patients who fulfilled SIRS criteria because sepsis-3 was published in 2016. Patients <20 years old, or with a history of solid cancer, hematopoietic malignancy, or liver cirrhosis classified as Child-Pugh grade C were excluded. The study was conducted in accordance with the Declaration of Helsinki. The protocols of this study were evaluated and approved by the ethics committee of Tokyo Women’s Medical University. Informed consent for study participation was obtained from the patients or their families.
Patients Treatment
All patients were treated according to Surviving Sepsis Campaign Guidelines. 19
Patients who were diagnosed with DIC were treated as the same of standard AT supplementation which Iba reported when plasma ATIII level was less than 70%. 20
Laboratory Data Sources and Measurement
Plasma levels of FDP, DD, PAI-1, and SF were measured by latex immunoassay using LIASAUTO P-FDP, LIASAUTO DD (Sysmex Corporation, Hyogo, Japan), LPIA·tPAI test, and Iatro SFII (LSI Medience Corporation, Tokyo, Japan), respectively. Plasma ATIII levels were measured using the synthetic chromogenic substrate method with an L System ATIII kit (Sysmex Corporation). Plasma thrombin–international normalized ratio (PT-INR) was measured by the 1-stage method using Thromborel S (Sysmex Corporation). Soluble fibrin, FDP, DD, PT-INR, and ATIII were measured using a CS5100 auto-analyzer (Sysmex Corporation). Platelet count (PLT) was measured using an XN3000 auto-analyzer (Sysmex Corporation). Measurements of PAI-1 were entrusted to BML Corporation (http://www.bml.co.jp/; Tokyo, Japan).
Study Design and Diagnosis of DIC
This study was a prospective, single-center observational study. Blood samples were collected from patients at the time of admission (day 0) and on days 1, 3, 5, and 7 after admission. Patients from whom blood samples could not be obtained within 24 hours after hospital admission, or in whom the blood samples were collected only once or twice during the observation period were excluded, as were patients who died within the 7-day period, because chronological data were needed in the present study. Patients’ outcomes were observed from their admissions after 28 days.
The JAAM DIC criteria were used for the diagnosis of DIC. These criteria comprise 4 parameters: SIRS score (0-2 SIRS symptoms, 0 points; ≥3 SIRS symptoms, 1 point), PLT (≥120 × 103/µL, 0 points; ≥80 × 103/µL but <120 × 103/µL or ≥30% decrease in PLT within 24 hours, 1 point; <80 × 103/µL or ≥50% decrease in PLT within 24 hours, 3 points), PT-INR (<1.2, 0 points; ≥1.2, 1 point), and FDP (<10 mg/L, 0 points; ≥10 mg/L but <25 mg/L, 1 point; ≥25 mg/L, 3 points). Patients were diagnosed with DIC when JAAM DIC scores were ≥4.
For analyses, patients were classified into 3 groups: (1) “no-DIC group,” including those who did not develop DIC during the entire study period; (2) “pre-DIC group,” in whom DIC onset occurred >24 hours but <1 week after admission; and (3) “DIC group,” including those who were diagnosed with DIC at admission (day 0). Global coagulation tests included in the JAAM DIC criteria were conducted in all patients. Values of global coagulation tests, SOFA score, 5 and Acute Physiology and Chronic Health Evaluation (APACHE) II 21 score on day 0 and 28-day mortality rate were compared between the groups. Values of coagulation markers on day 0 were compared between groups because they were retrospectively confirmed which coagulation markers increased before DIC development. Receiver operating characteristic (ROC) curve analysis was performed to examine the diagnostic ability of coagulation markers in JAAM DIC criteria for DIC. The cutoff value for each marker was considered to be the point on the ROC curve farthest from the line connecting the point with abscissa and ordinate values of 0.0 to the point with abscissa and ordinate values of 1.0. Patients were then classified into 2 subgroups, the “High group,” with marker values on day 0 equal to or above the cutoff values of the coagulation markers, and the “Low group,” with marker values on day 0 lower than the cutoff values. Chronological changes in JAAM DIC scores between High and Low groups for each marker were observed, excluding patients diagnosed with DIC on day 0, that is, only including pre-DIC and no-DIC groups, because patients with DIC were already diagnosed using existing DIC scoring systems. The SOFA score and APACHE II score on day 0 and 28-day mortality rate were compared between high and low groups of each coagulation marker.
Study Size
The target number of blood samples was more than 400 by setting both trust rate as 95% and allowable error rate as within 5% when the diagnosis abilities of coagulation markers were assumed as 50%. Hence, the target number of patients was more than 80 because we collected blood sample 5 times from a patient.
Statistical Analysis
Unless otherwise indicated, data are expressed as the median value and 95% confidence interval (95% CI). Differences between groups were examined for significance using the log-rank test, Mann-Whitney U test, Kruskal-Wallis rank test, and Friedman test, as appropriate, with values of P < .05 considered significant. Statistical analysis was performed using BellCurve for Excel software (Social Survey Research Information Corporation, Tokyo, Japan). Missing data of coagulation markers were excluded with JAAM DIC score when ROC analysis was conducted.
Results
A total of 107 patients were enrolled in this study. The characteristics of patients classified into the no-DIC (n = 25), pre-DIC (n = 40), and DIC (n = 42) groups are shown in Table 1. Both pre-DIC and DIC groups had more severe clinical conditions than no-DIC group patients, as indicated by JAAM DIC score, plasma lactate level, SOFA score, APACHE II score, and 28-day mortality rate assessed using the Kruskal-Wallis rank test and log-rank test. The 28-day mortality rate was relatively higher in DIC group compared to the past reports because we guessed that a lot of patients in the DIC group had high levels of lactate and they were in septic shock condition according to the sepsis-3 criteria. 6
Baseline Characteristics of the Study Characteristics.
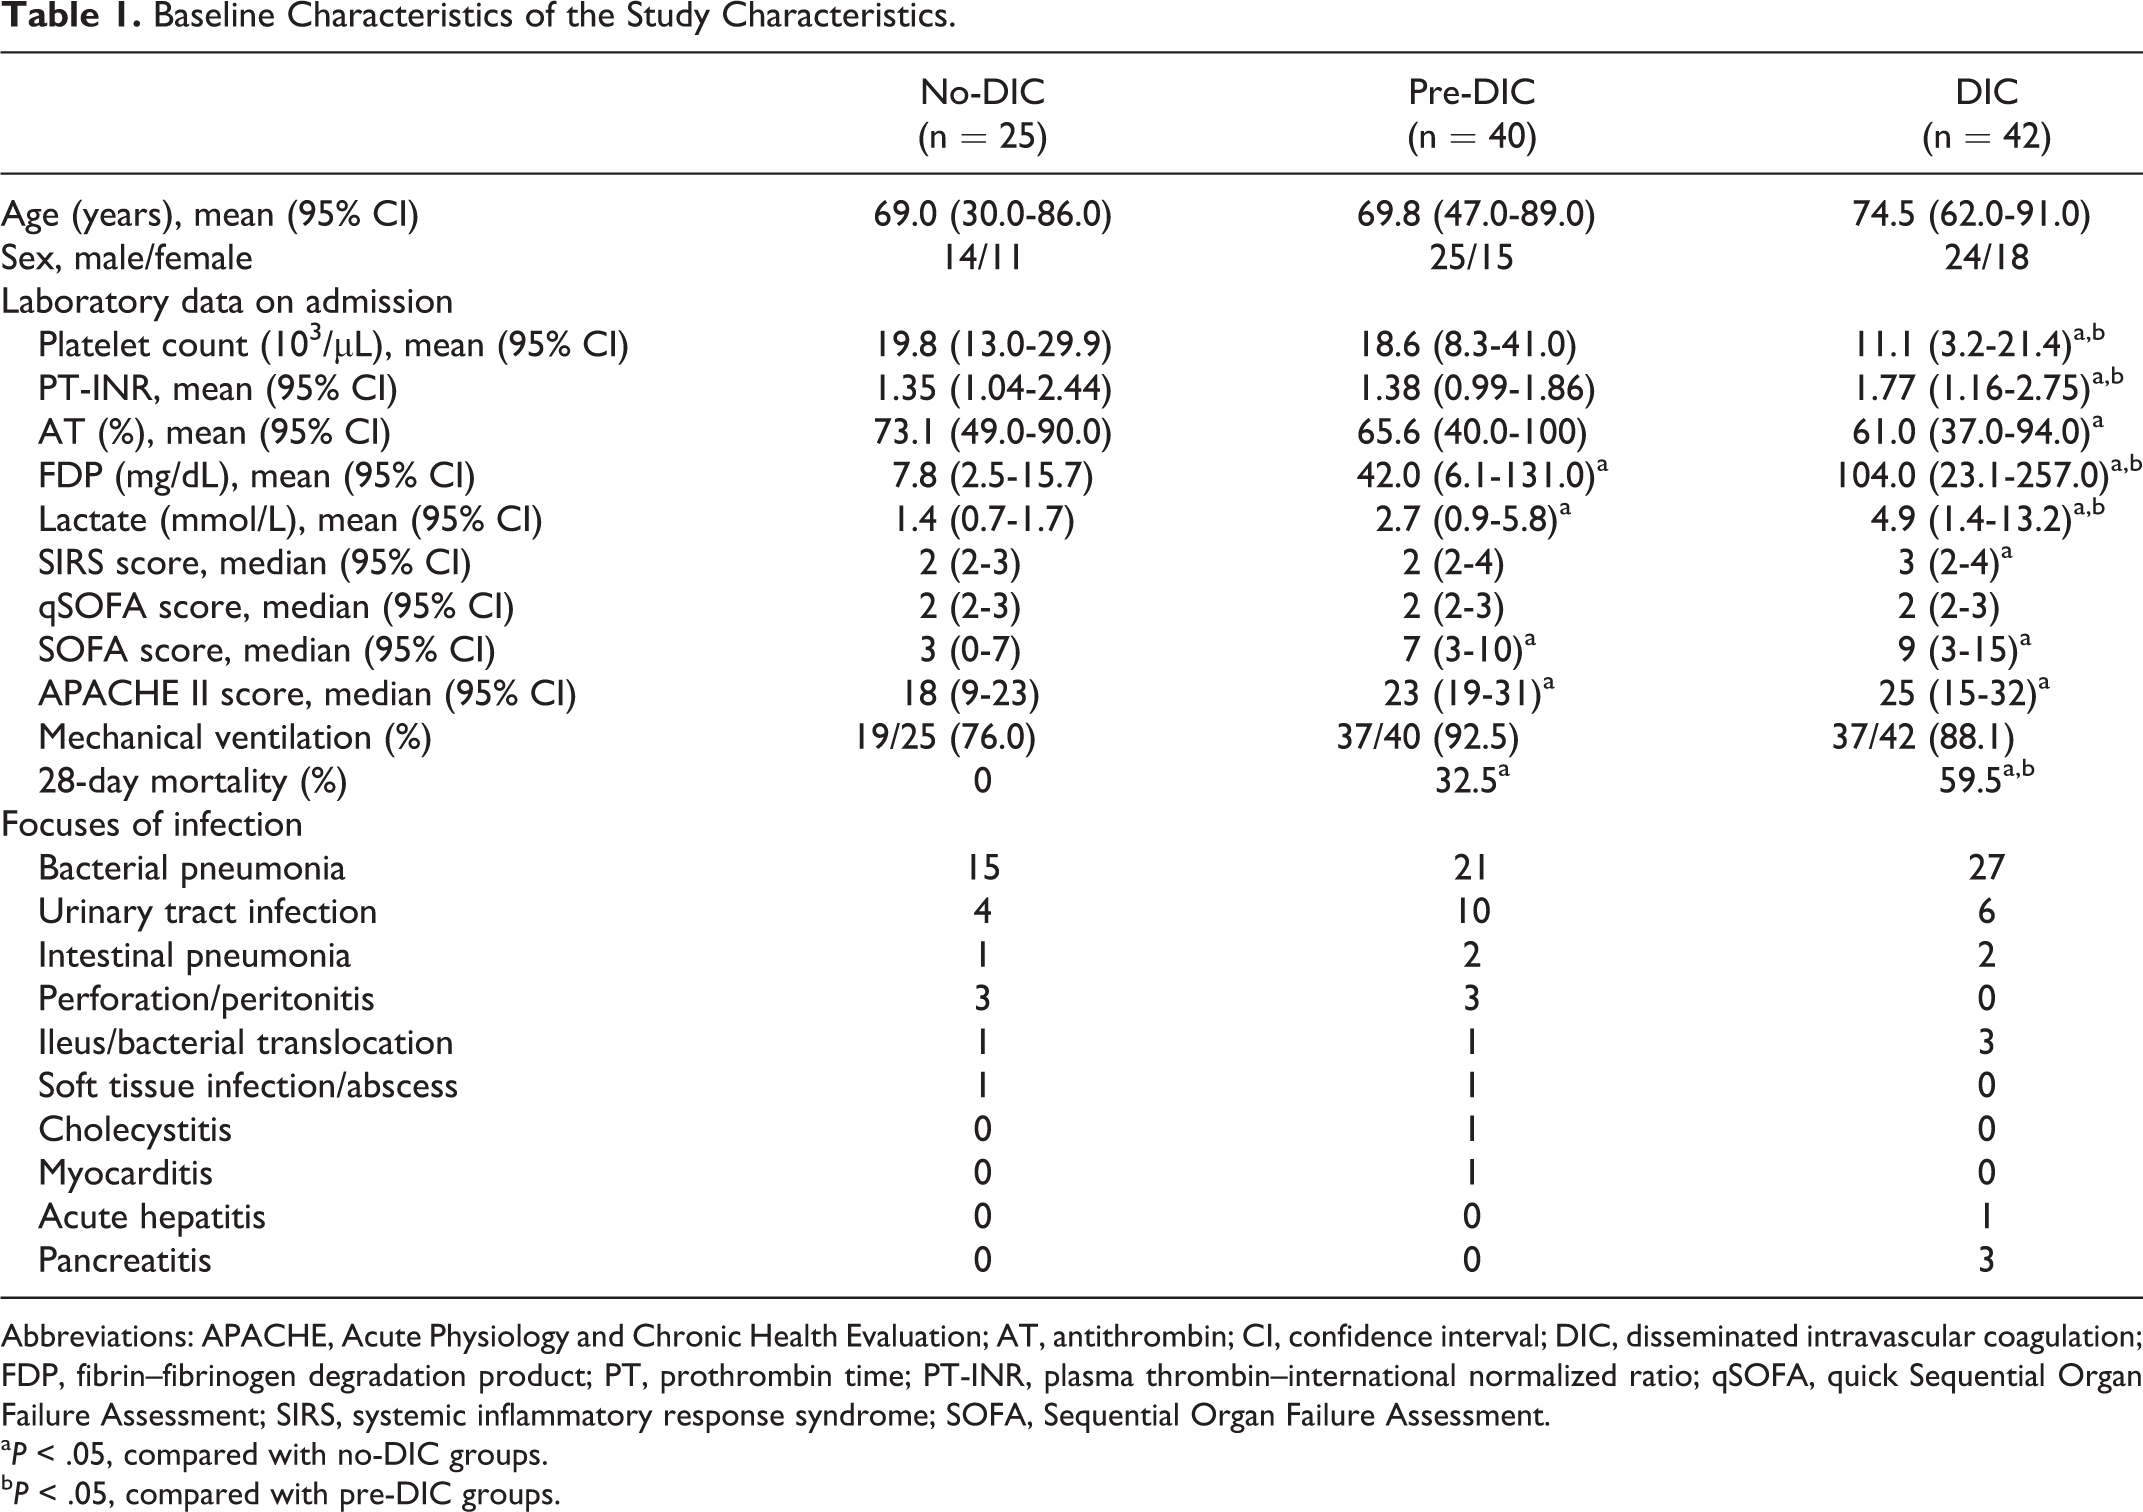
Abbreviations: APACHE, Acute Physiology and Chronic Health Evaluation; AT, antithrombin; CI, confidence interval; DIC, disseminated intravascular coagulation; FDP, fibrin–fibrinogen degradation product; PT, prothrombin time; PT-INR, plasma thrombin–international normalized ratio; qSOFA, quick Sequential Organ Failure Assessment; SIRS, systemic inflammatory response syndrome; SOFA, Sequential Organ Failure Assessment.
a P < .05, compared with no-DIC groups.
b P < .05, compared with pre-DIC groups.
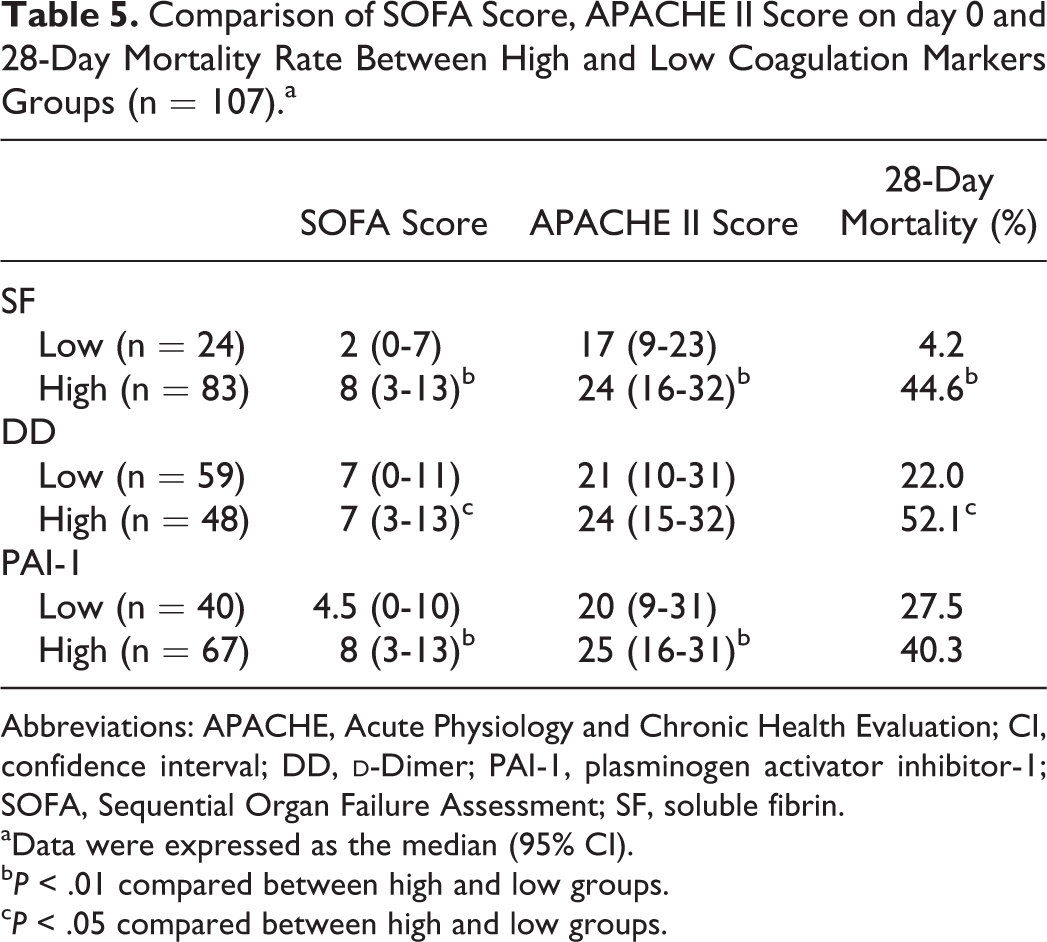
Comparison of plasma levels of coagulation markers on day 0 between the 3 groups indicated that all markers differed significantly between the DIC and no-DIC groups. Soluble fibrin, DD, and PAI-1 were significantly increased in the pre-DIC group compared with the no-DIC group (Table 2), as assessed using the Kruskal-Wallis rank test. Receiver operating characteristic analysis was conducted with 452 blood samples. Receiver operating characteristic analysis identified cutoff values for SF, DD, and PAI-1 of 31.0, 13.9, and 49.0 ng/mL, respectively. The most sensitive biomarker of DIC was SF, while the most specific biomarker was DD. The coagulation markers SF and DD showed an area under the curve of ≥0.70, which is considered to reflect moderate accuracy of a JAAM DIC diagnosis (Table 3). For each coagulation marker, time-course changes in the JAAM DIC score between High and Low groups among pre-DIC (n = 40) and no-DIC (n = 25) groups were observed, excluding the DIC group (Table 4). For assessing time-course data using Friedman test, we only analyzed patients who survived beyond 1 week. In the High SF and PAI-1 groups, JAAM DIC scores on days 1 and 3 were significantly higher than those on day 0. Conversely, in the High DD group, JAAM DIC scores did not differ significantly over time. Further, JAAM DIC scores in the Low group of each coagulation marker were not significantly different from 0 to 7 days. In particular, median and 95% CIs of JAAM DIC scores in the Low SF group were never more than 3 throughout the observation period. There were only 3 patients who died within 7 days from admission, all of who were excluded from statistical analysis. All of them belonged to the pre-DIC group. They were included in the High SF, High PAI-1, and Low DD groups. The comparison between High and Low groups about SOFA score and APACHE II score on day 0 and 28-day mortality rate is shown in Table 5. The SOFA scores were significantly higher compared between High and Low groups in all coagulation markers examined in this study, and APACHE II scores were significantly higher in High SF and PAI-1 groups than Low those groups, using Mann-Whitney U test. The 28-day mortality rate was significantly higher in High SF and DD groups than those Low groups using log-rank test.
Comparison of Coagulation Markers on Day 0 Between No-DIC, Pre-DIC, and DIC Groups.a
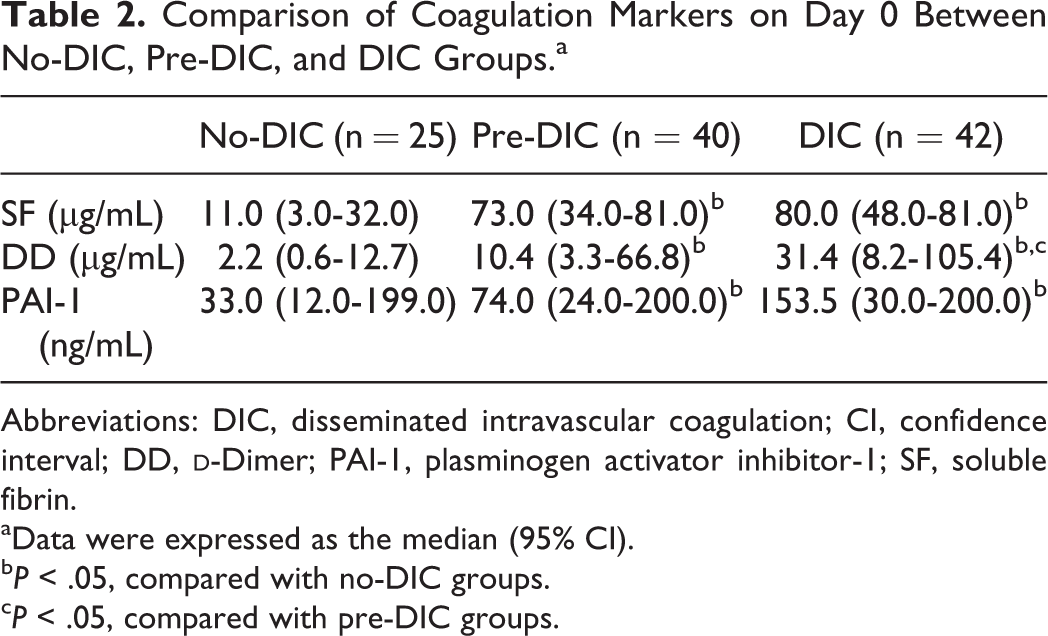
Abbreviations: DIC, disseminated intravascular coagulation; CI, confidence interval; DD,
aData were expressed as the median (95% CI).
b P < .05, compared with no-DIC groups.
c P < .05, compared with pre-DIC groups.
ROC Analysis of Coagulation Markers for JAAM DIC Criteria (n = 452).
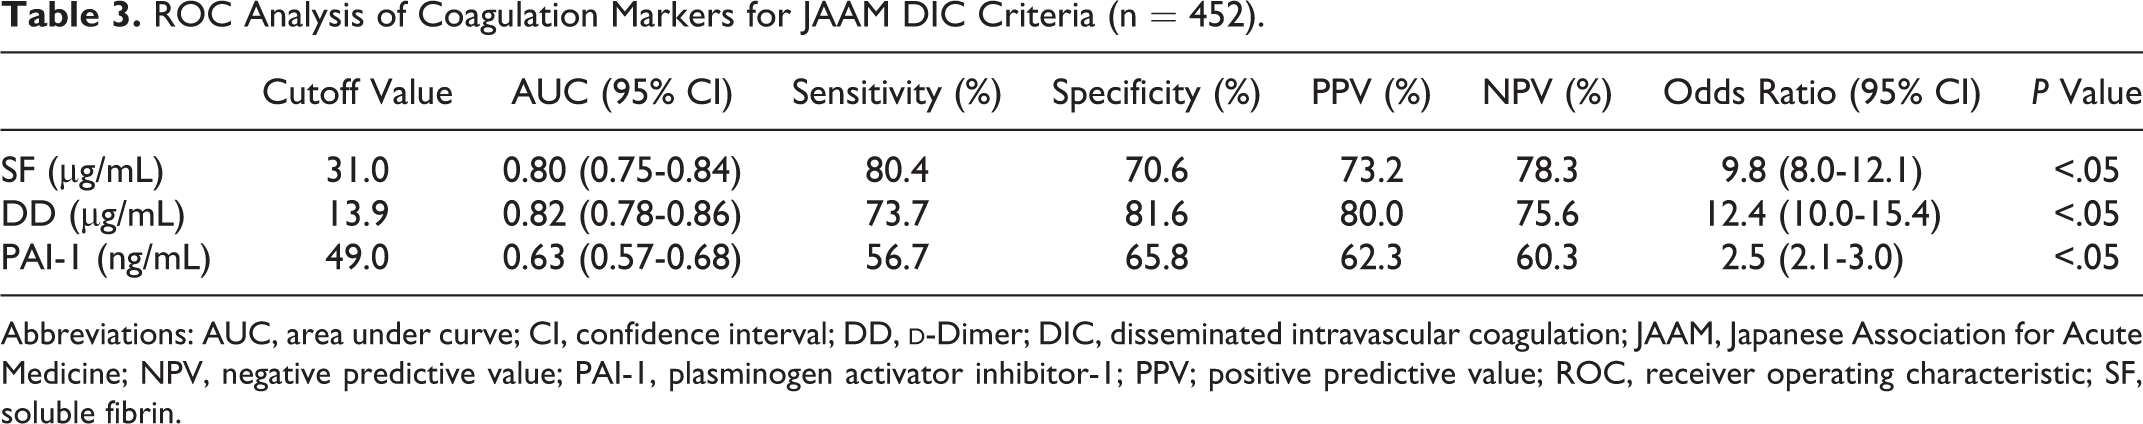
Abbreviations: AUC, area under curve; CI, confidence interval; DD,
Comparison of Coagulation Markers Between High and Low Groups in the Time-Course Change of JAAM DIC Score Excluding Patients (n = 62).a
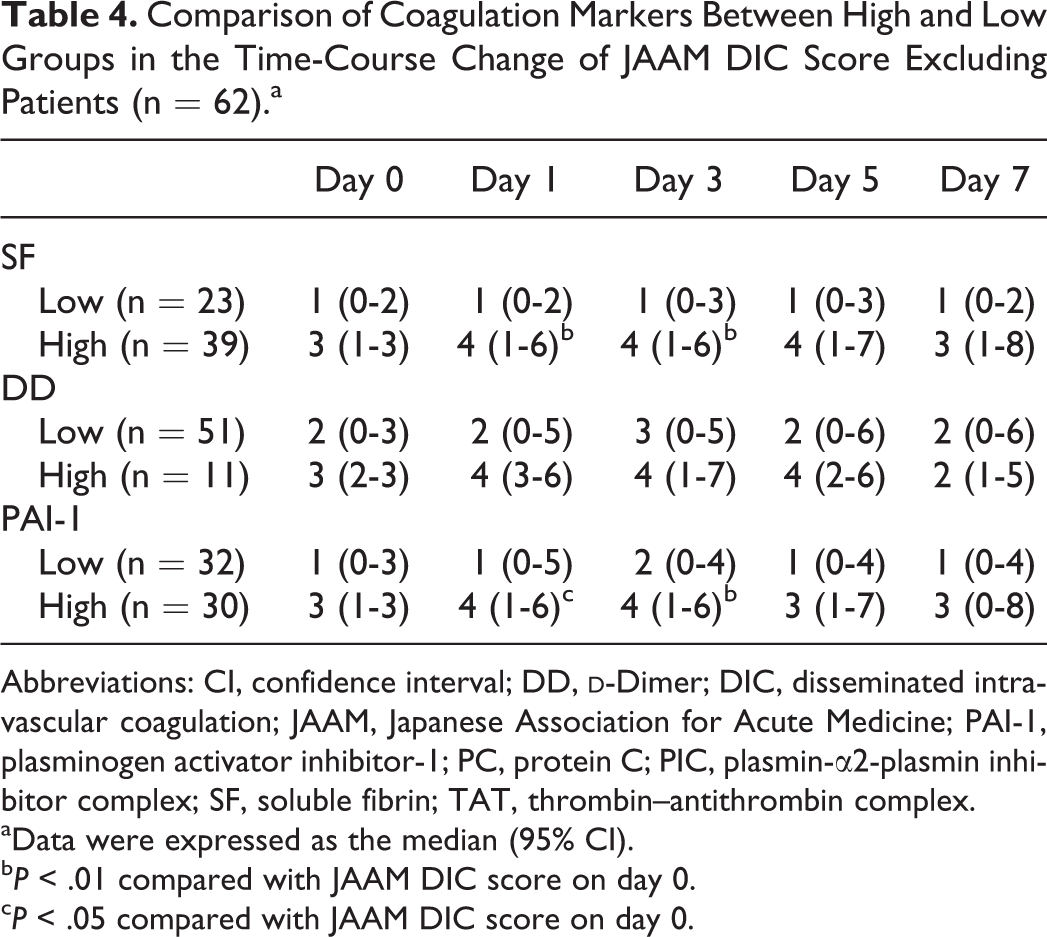
Abbreviations: CI, confidence interval; DD,
aData were expressed as the median (95% CI).
b P < .01 compared with JAAM DIC score on day 0.
c P < .05 compared with JAAM DIC score on day 0.
Comparison of SOFA Score, APACHE II Score on day 0 and 28-Day Mortality Rate Between High and Low Coagulation Markers Groups (n = 107).a
Abbreviations: APACHE, Acute Physiology and Chronic Health Evaluation; CI, confidence interval; DD,
aData were expressed as the median (95% CI).
b P < .01 compared between high and low groups.
c P < .05 compared between high and low groups.
Discussion
The purpose of this study was to propose the cutoff values of coagulation markers for evaluating DIC and to investigate the possibility of coagulation markers for prediction of DIC. The patients who were enrolled in this study were classified into 3 groups. We confirmed that plasma levels of SF, DD, and PAI-1 significantly increased even under the pre-DIC condition. Although the patients in both pre- and no-DIC groups were diagnosed as without DIC using the existing DIC criteria at the time of admissions, patient outcomes between no- and pre-DIC groups were significantly different.
The cutoff values of SF, DD, and PAI-1 for evaluating DIC were calculated as 31, 13.9, and 49 ng/mL using 452 blood samples, respectively. In order to apply in a clinical situation for predicting DIC, a prospective observation of septic patients without DIC was necessary. As a result of our prospective observations, a high plasma level of both SF (>31 µg/mL) and PAI-1 (>49 ng/mL) could indicate DIC development earlier than JAAM DIC criteria, and the patients with low plasma levels of SF (<31 µg/mL) did not develop DIC. Hence, patients with sepsis without DIC who had the high plasma levels of SF or PAI-1 may be considered as high-risk patients of DIC development and the patients who had the low plasma SF levels were considered as low risk of DIC development. Those results may help physicians to detect the early phase of DIC when SF or PAI-1 values are above these levels and to rule out a diagnosis of DIC when SF values are less than 31 µg/mL. Moreover, high values of coagulation markers indicated the physiological severity of patients. In particular, SOFA score and APACHE II score on day 0 and 28-day mortality rate were significantly higher in High SF group than Low SF group. Soluble fibrin might enable to identify accurate severity of patients and to predict patient outcomes. Cutoff values of PC and presepsin for evaluating sepsis-induced DIC were proposed in 2014 analyzing 82 patients according to JAAM DIC criteria. 18 This result showed the plasma PC level which indicated DIC development. However, prospective observation of JAAM DIC score was not conducted.
There were 3 major pathogenic pathways associated with sepsis-induced DIC, such as tissue factor (TF)-mediated thrombin generation, dysfunctional anticoagulant, and impaired fibrinolysis. 2 The appearance of SF in plasma was stimulated by thrombin generation in the TF-mediated thrombin generation pathway, while PAI-1 inactivated plasmin in impaired fibrinolysis pathway. 2–3 D-dimer was cross-linked fibrin which was distinguished from FDP by a reagent which reacted with an epitope related to plasmin-degraded cross-linked γ-chain. 2 Soluble fibrin and PAI-1 increased before fibrin formation, while DD was increased after fibrin formation when coagulopathy aggravated. Hence, SF and PAI-1 were sensitive markers which detected the phase of the coagulopathy just before DIC development and DD was a specific marker which detected DIC development.
This study included some limitations. First, this study was conducted at single center. Second, the number of participants was small. Sixty-five patients without DIC whose JAAM DIC scores were observed chronologically were not enough statistically. Third, cutoff values for coagulation markers calculated in this study are not universal because cutoff values differ between specific reagents used for measuring coagulation markers.
With regard to coagulation markers examined in this study, SF had a high ability of evaluating DIC according to ROC analysis. We could propose the cutoff value of SF for indicating DIC development. Soluble fibrin ≥31 µg/mL might have the possibility of indicating the appropriate stage of sepsis-induced coagulopathy for anticoagulant therapy. Large scale of study was needed to prove that.
Conclusion
This study suggests that high plasma levels of SF and PAI-1 may be useful as harbingers of DIC development. High plasma level of SF indicated DIC development within a few days, and low plasma level of SF indicated low-risk of DIC development. Observation of SF values of ≥31 µg/mL should be considered as a predictor of the early phase of DIC.
Footnotes
Authors’ Note
YD participated in the design of study and helped diagnose DIC in the clinical situation. ST conceived of the study and participated in its design and helped draft the manuscript.
Acknowledgments
The authors thank FORTE Science Communications for editorial assistance with the manuscript.
Declaration of Conflicting Interests
The author(s) declared no potential conflict of interest with respect to the research, authorship, and/or publication of this article.
Funding
The author(s) received no financial support for the research, authorship, and/or publication of this article.