
Abstract
Pulmonary embolism (PE) is associated with mortality. There are many clinical prediction tools to predict early mortality in acute PE but little consensus on which is best. Our study aims to validate existing prediction tools and derive a predictive model that can be applied to all patients with acute PE in both inpatient and outpatient settings. This is a retrospective cohort study of patients with acute PE. For each patient, the Pulmonary Embolism Severity Index (PESI), simplified PESI (sPESI), European Society of Cardiology (ESC), and Angriman scores were calculated. Scores were assessed by the area under the receive-operating curve (AUC) for 30-day, all-cause mortality. To develop a new prognostic model, elastic logistic regression was used on the derivation cohort to estimate β-coefficients of 8 different variables; these were normalized to weigh them. A total of 321 patients (mean age 60±17 years) were included. Overall 30-day mortality was 10.3%. None of the scores performed well; the AUCs for the PESI, sPESI, ESC, and Angriman scores were 0.67 (95% confidence interval [CI], 0.57-0.77), 0.58 (0.48-0.69), 0.65 (0.55-0.75), and 0.67 (0.57-0.76), respectively. Our new prediction model outperformed PESI, with an AUC of 0.82 (95% CI, 0.76-0.88). At a cutoff score of 100, 195 (60.1%) patients were classified as low risk. Thirty-day mortality was 2.1% (95% CI, 0.8%-5.2%) and 23.0% (16.5%-31.1%) for low- and high-risk groups, respectively (P < .001). In conclusion, we have developed a new model that outperforms existing prediction tools in all comers with PE. However, further validation on external cohorts is required before application.
Introduction
Pulmonary embolism (PE) is common and associated with substantial morbidity and mortality. In Europe, the estimated incidence of community-acquired PE is 28 per 100 000 person-years, rising to 67 per 100 000 person-years for hospital-acquired PE; the approximate mortality rate is 7%. 1 The spectrum of acute PE severity and mortality varies widely. In the Management Strategy and Prognosis of Pulmonary Embolism Registry (MAPPET), the mortality from acute PE ranged from 8.1% in stable patients to 65% in those requiring cardiopulmonary resuscitation. 2
Given the heterogeneous presentation of acute PE, several risk stratification tools to predict early mortality 3 –7 (Table 1) have been developed to aid clinicians in selecting appropriate management of these patients. Data suggest that between 30% and 50% of low-risk patients with acute PE may be safely managed in the outpatient setting, without increasing mortality, recurrent venous thromboembolism (VTE), or bleeding complications. 8 –10 Outpatient management or early inpatient discharge saves health-care costs and resources and may be associated with better outcomes. 11
Clinical Prediction Rules for Acute PE.
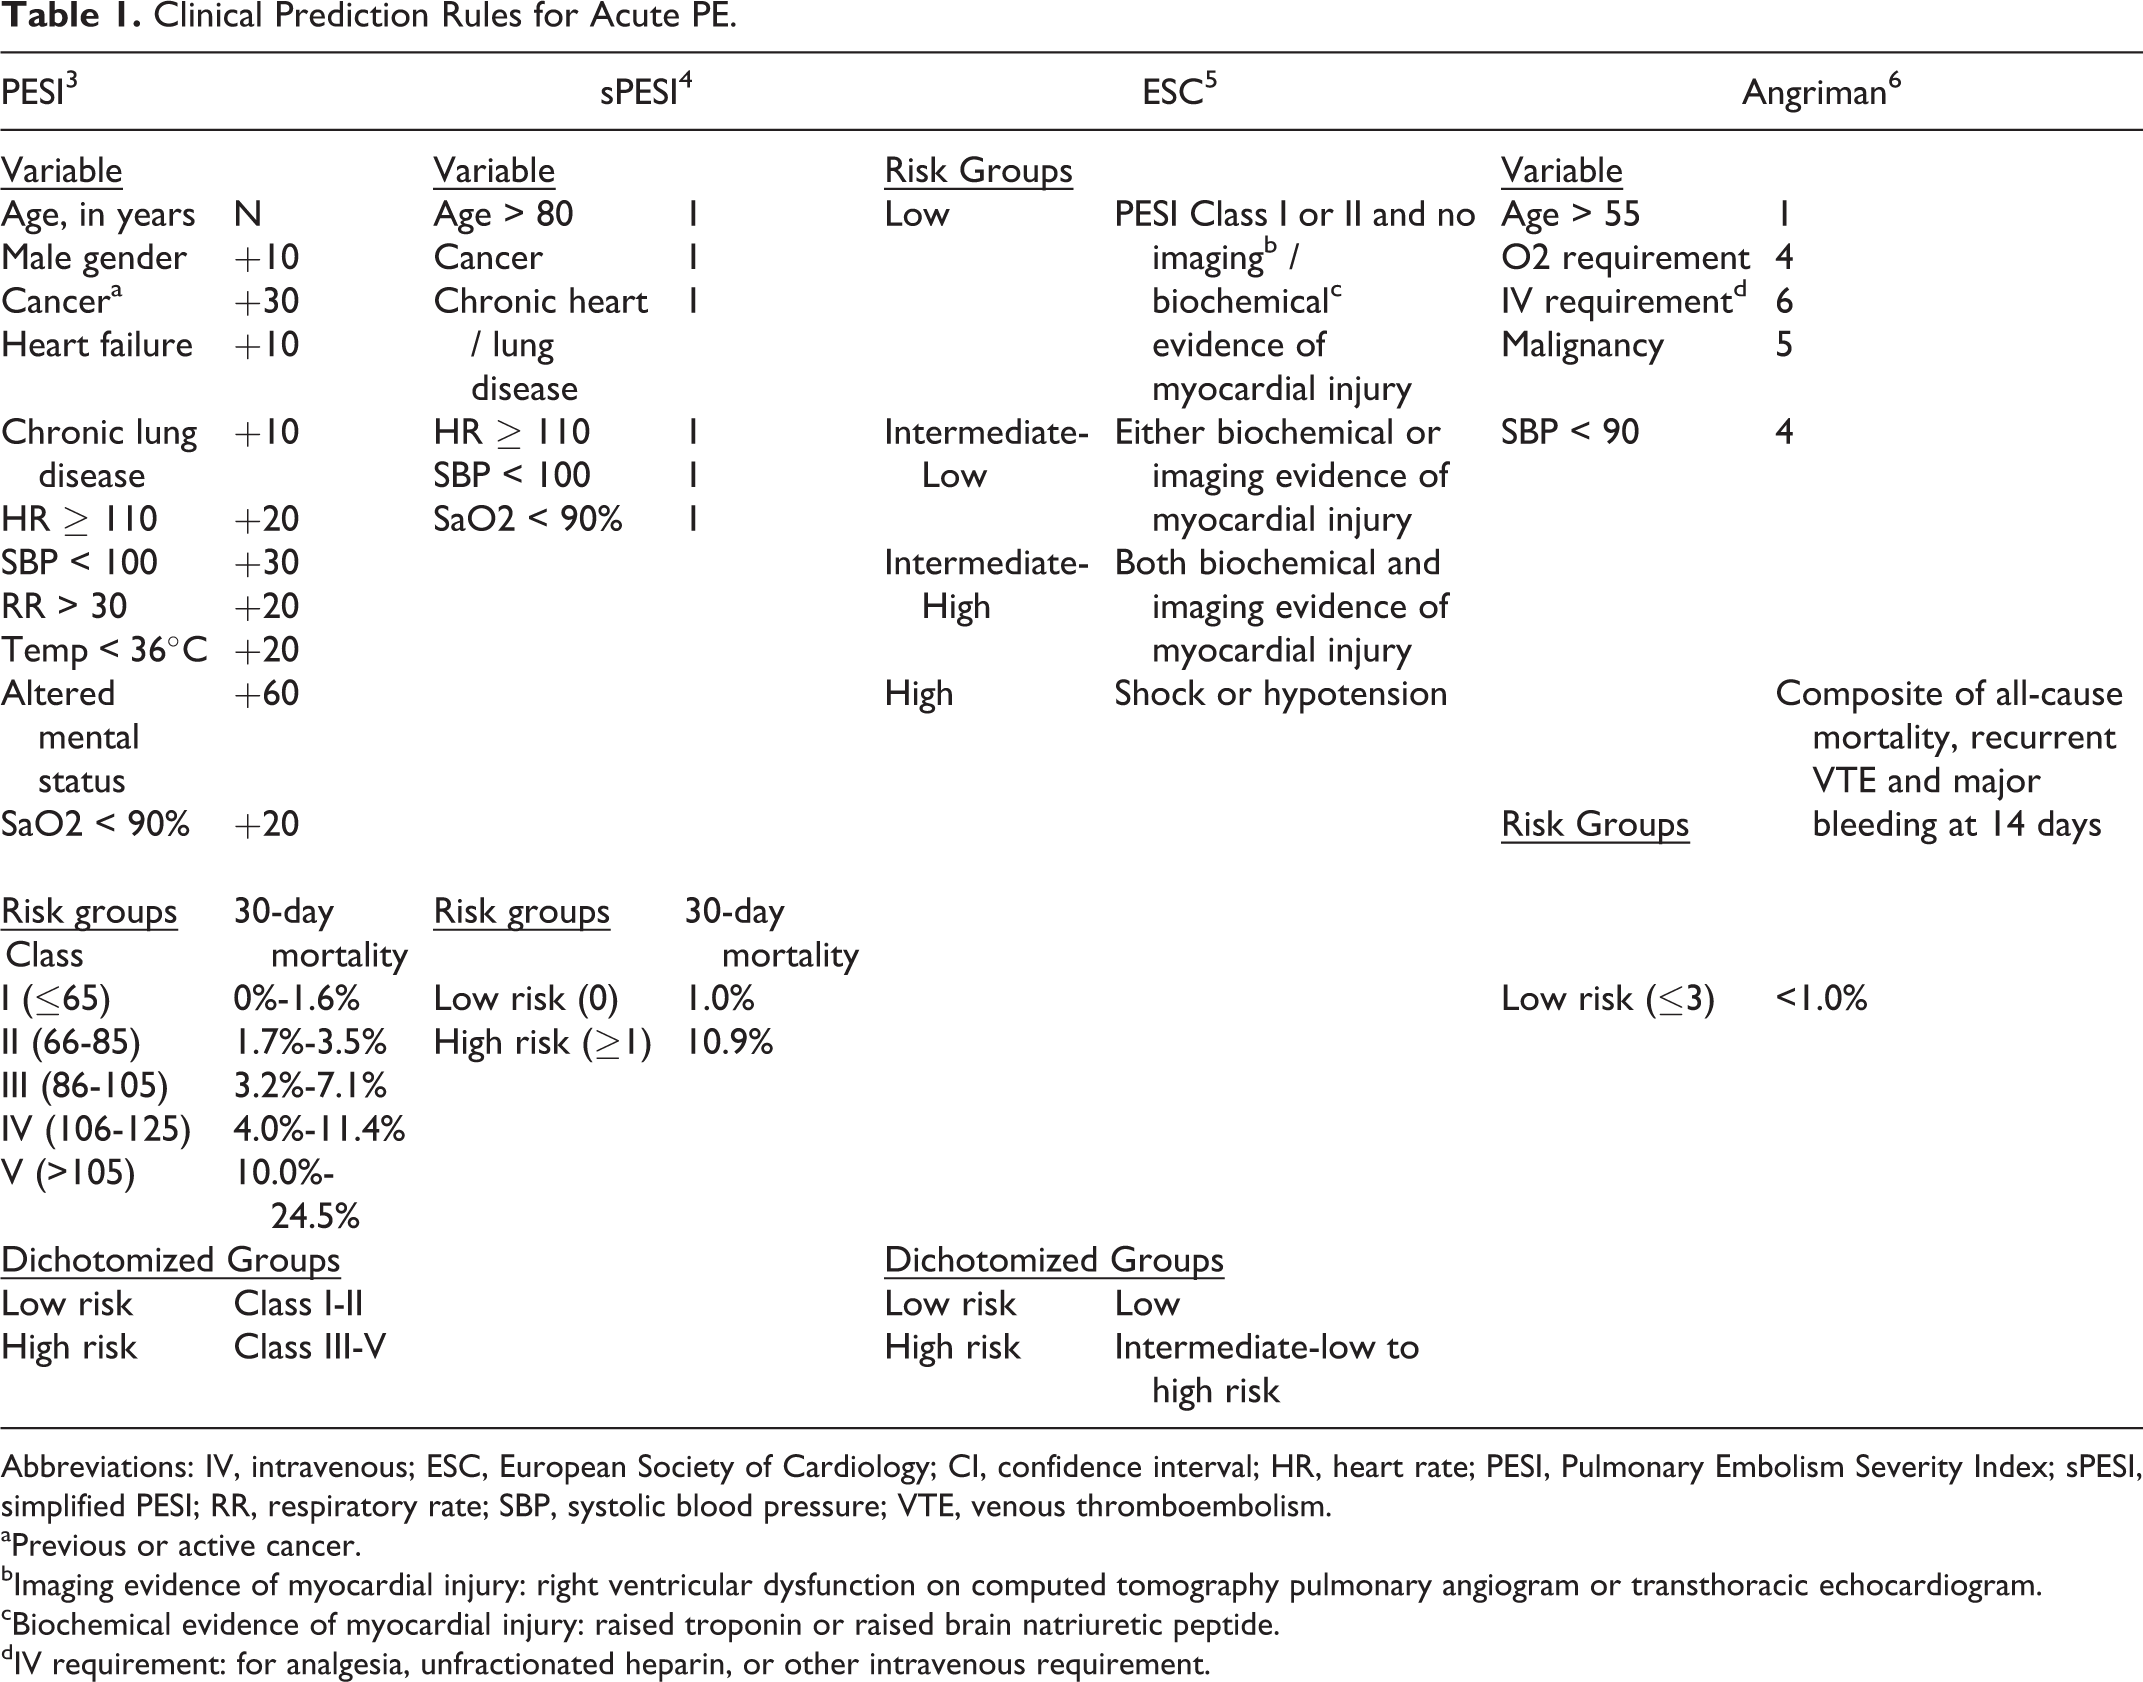
Abbreviations: IV, intravenous; ESC, European Society of Cardiology; CI, confidence interval; HR, heart rate; PESI, Pulmonary Embolism Severity Index; sPESI, simplified PESI; RR, respiratory rate; SBP, systolic blood pressure; VTE, venous thromboembolism.
aPrevious or active cancer.
bImaging evidence of myocardial injury: right ventricular dysfunction on computed tomography pulmonary angiogram or transthoracic echocardiogram.
cBiochemical evidence of myocardial injury: raised troponin or raised brain natriuretic peptide.
dIV requirement: for analgesia, unfractionated heparin, or other intravenous requirement.
Despite the breadth of clinical prediction tools available, there is no consensus on which is the best. The most widely validated are the Pulmonary Embolism Severity Index (PESI) 3 and simplified PESI (sPESI) 4 ; the PESI formed the basis of the European Society of Cardiology (ESC) clinical prediction tool. 5 In addition, none of these models factor adverse outcomes, such as bleeding rates, into the prediction model. Angriman et al sought to address this by building a model using a composite end point for recurrent VTE, major bleeding, and all-cause mortality. 6
A number of these tools were derived and validated in outpatients (including the emergency department setting), and extrapolation of their use to inpatients is questionable. Our study aims to validate existing prediction tools in both inpatients and outpatients with acute PE and to determine whether we can derive a better predictive model for this group of patients.
Methods
Study Population
We identified 321 consecutive patients with acute PE diagnosed via computed tomography pulmonary angiography (CTPA) at the National University Hospital, Singapore, between January 1, 2013, and December 31, 2016. Patients aged older than 18 with an objectively diagnosed first episode of acute PE were included. Patients who were not treated, had chronic PE, or lost to follow-up were excluded. This study received institutional ethics approval (National Healthcare Group Domain Specific Review Board, Singapore; Approval number: 2016/00750).
Baseline Data Collection
Data were extracted from a comprehensive electronic medical record system. We retrospectively extracted baseline characteristics as well as predictors of the PESI, sPESI (age, gender, history of cancer, heart failure, chronic lung disease, pulse, systolic blood pressure, respiratory rate, temperature, mental status, and arterial oxygen saturation), ESC (echocardiographic or radiologic evidence of right heart strain, troponin, and brain natriuretic peptide levels), and Angriman (age, oxygen requirement, intravenous drug requirement, malignancy, and systolic blood pressure) scores (Table 1). Right ventricular (RV) dysfunction, on echocardiogram and CTPA, was defined according to ESC guidelines. 12
The PESI, sPESI, ESC, and Angriman risk scores were calculated for all patients using the variables gathered. Patients were then stratified into low-risk or high-risk groups defined by the respective scores. As the PESI and ESC scores had multiple categories, they were dichotomized into low-risk and high-risk groups (Table 1) to allow for calculation of sensitivity, specificity, negative predictive values (NPVs), and positive predictive values (PPVs).
Data on bleeding complications while on therapeutic anticoagulation were also gathered. For each bleeding episode, site of bleed, transfusion requirement, and use of anticoagulation reversal agents were recorded. Bleeding events were classified as major bleeds according to the International Society on Thrombosis and Haemostasis (ISTH) guideline. 13 Bleeds not fulfilling the criteria for major bleeding were classified as non-major bleeds.
Outcome Measures
The primary outcome measure was all-cause mortality at 30 days following acute PE diagnosis. For patients who died, the cause of death on the issued death certificate was recorded. Secondary outcomes were major bleeding at 30 days and subsequent admissions related to PE (for recurrent thrombosis, symptoms, or bleeding).
Data Preprocessing
Missing values in the data were filled using K-Nearest Neighbour (KNN) imputation. 14 The KNN imputation algorithm works by searching for K number of patients who share the most similar baseline characteristics with a patient having missing values. The missing values are imputed by taking the weighted average of the corresponding characteristic of the K most similar patients. K was set to 3 in our study. All continuous baseline variables except the age variable were converted into binary forms. Cutoff points set in PESI were adopted for variables that were also included in our score. Cutoff points of variables that were not found in PESI were set using an optimal thresholding method. 15 Optimal thresholding computes the best threshold point of a continuous variable by searching for a value that gives the least classification error rate.
Derivation of a New Model
All 321 patients with PE were randomly divided into derivation (n = 225) and validation (n = 96) samples in a 7:3 ratio. Class imbalance in the derivation cohorts was treated by oversampling patients who died and matching its number with living samples.
The new score was derived using elastic logistic regression, 16 with a regularization value, λ, of 0.01. The λ was determined by performing 10-fold cross validation on subsamples of the derivation set; the λ which gave the least mean square error was selected. Positive constraints on β-coefficients were set during its optimization phase to avoid negative coefficient values. β-coefficients of all selected covariates were normalized to weights by dividing each coefficient with the coefficient of the age variable.
Like the original PESI, the risk score of a patient was calculated by summing up the patient’s age in years and the weights associated with the other variables. The optimal cutoff point to define high-risk and low-risk groups was determined using Youden index, 17 the point that gives the greatest sum of sensitivity and specificity. The performance of our model was evaluated against other established prediction rules.
Statistical Analysis
Baseline characteristics are expressed as mean (standard deviation [SD]) for continuous variables and counts and proportions for categorical variables. Comparison of groups was done using the 2-sample t test or Mann-Whitney U test. Categorical data were analyzed with χ2 test.
To assess the discriminatory power of the various clinical prediction tools, including our new model, we measured the area under the receiver–operating characteristic (ROC) curves (AUC) for 30-day mortality. To explore the applicability of these tools to specific groups of patients, we performed a subgroup analysis on patients presenting with symptoms as outpatients (ie, symptomatic PE being the reason for presentation to hospital).
For each clinical prediction tool, the sensitivity, specificity, PPVs, and NPVs for low- and high-risk patients were calculated.
All analyses were carried out using SPSS 22.0 (SPSS Inc., Chicago, Illinois) and R environment. The source codes can be found at https://github.com/nus-mornin-lab/risk_stratification_of_acute_pe.
Results
Baseline Characteristics
A total of 383 cases of PE diagnosed via CTPA were identified, of which 26 were excluded because they were chronic PEs, 9 because they were lost to follow-up, and 27 because they were not treated. This left 321 patients with a first episode of acute PE for analysis. In all, 305 (95.0%) were treated in hospital; 119 (37.1%) patients presented as outpatients with symptoms of PE, while 202 (62.9%) had acute PE diagnosed during a hospital admission for another reason.
Baseline characteristics according to risk groups are shown in Table 2. The mean age was 60.7 (17.5) years; 155 (48.3%) patients were male, and 94 (29.3%) patients had a malignancy or a history of cancer; and 197 (61.4%) patients had a clear provoking factor for PE.
Baseline Characteristics.
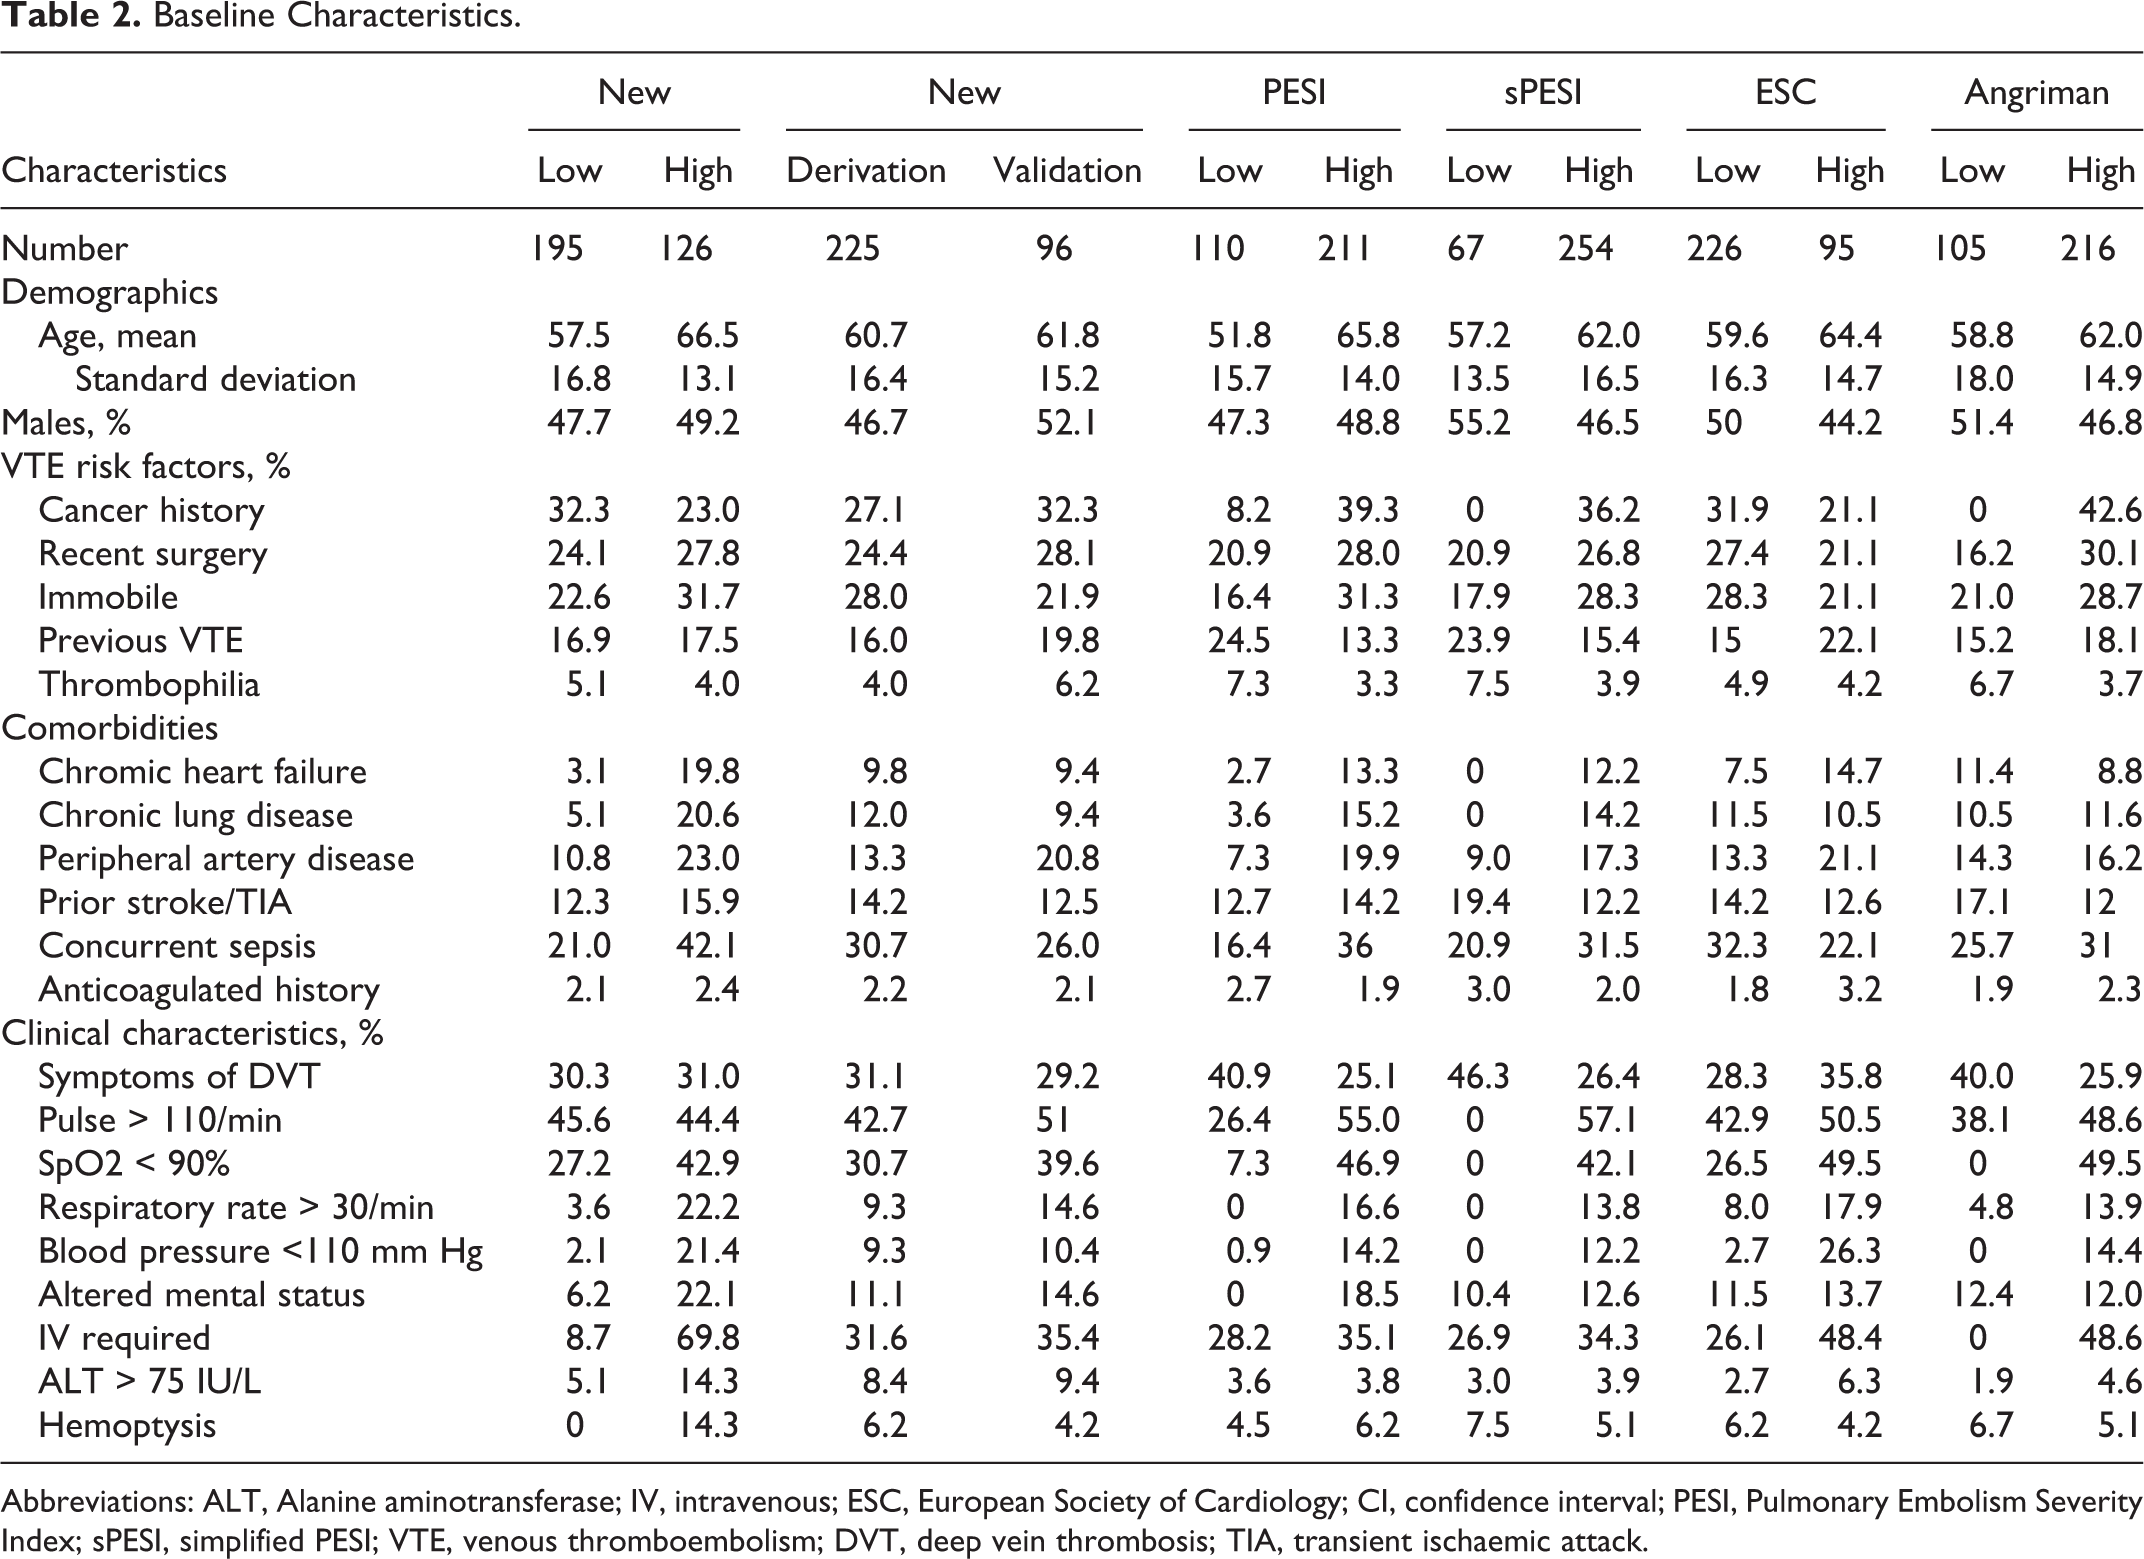
Abbreviations: ALT, Alanine aminotransferase; IV, intravenous; ESC, European Society of Cardiology; CI, confidence interval; PESI, Pulmonary Embolism Severity Index; sPESI, simplified PESI; VTE, venous thromboembolism; DVT, deep vein thrombosis; TIA, transient ischaemic attack.
Thirty-Day Mortality
Outcome data for the 5 clinical prediction rules are shown in Table 3. The overall 30-day, all-cause mortality was 10.3% (95% confidence interval [CI], 7.4%-14.1%); for the outpatient subgroup, it was 6.7% (95% CI, 3.4%-12.7%). PE was the most common cause of death, accounting for 27.3% of deaths at 30 days. This was followed by cancer (21.2%) and pneumonia (21.2%). There were 3 (9.1%) deaths from gastrointestinal bleeding and intracranial hemorrhage.
Prognostic Tool Characteristics for 30-Day All-Cause Mortality.
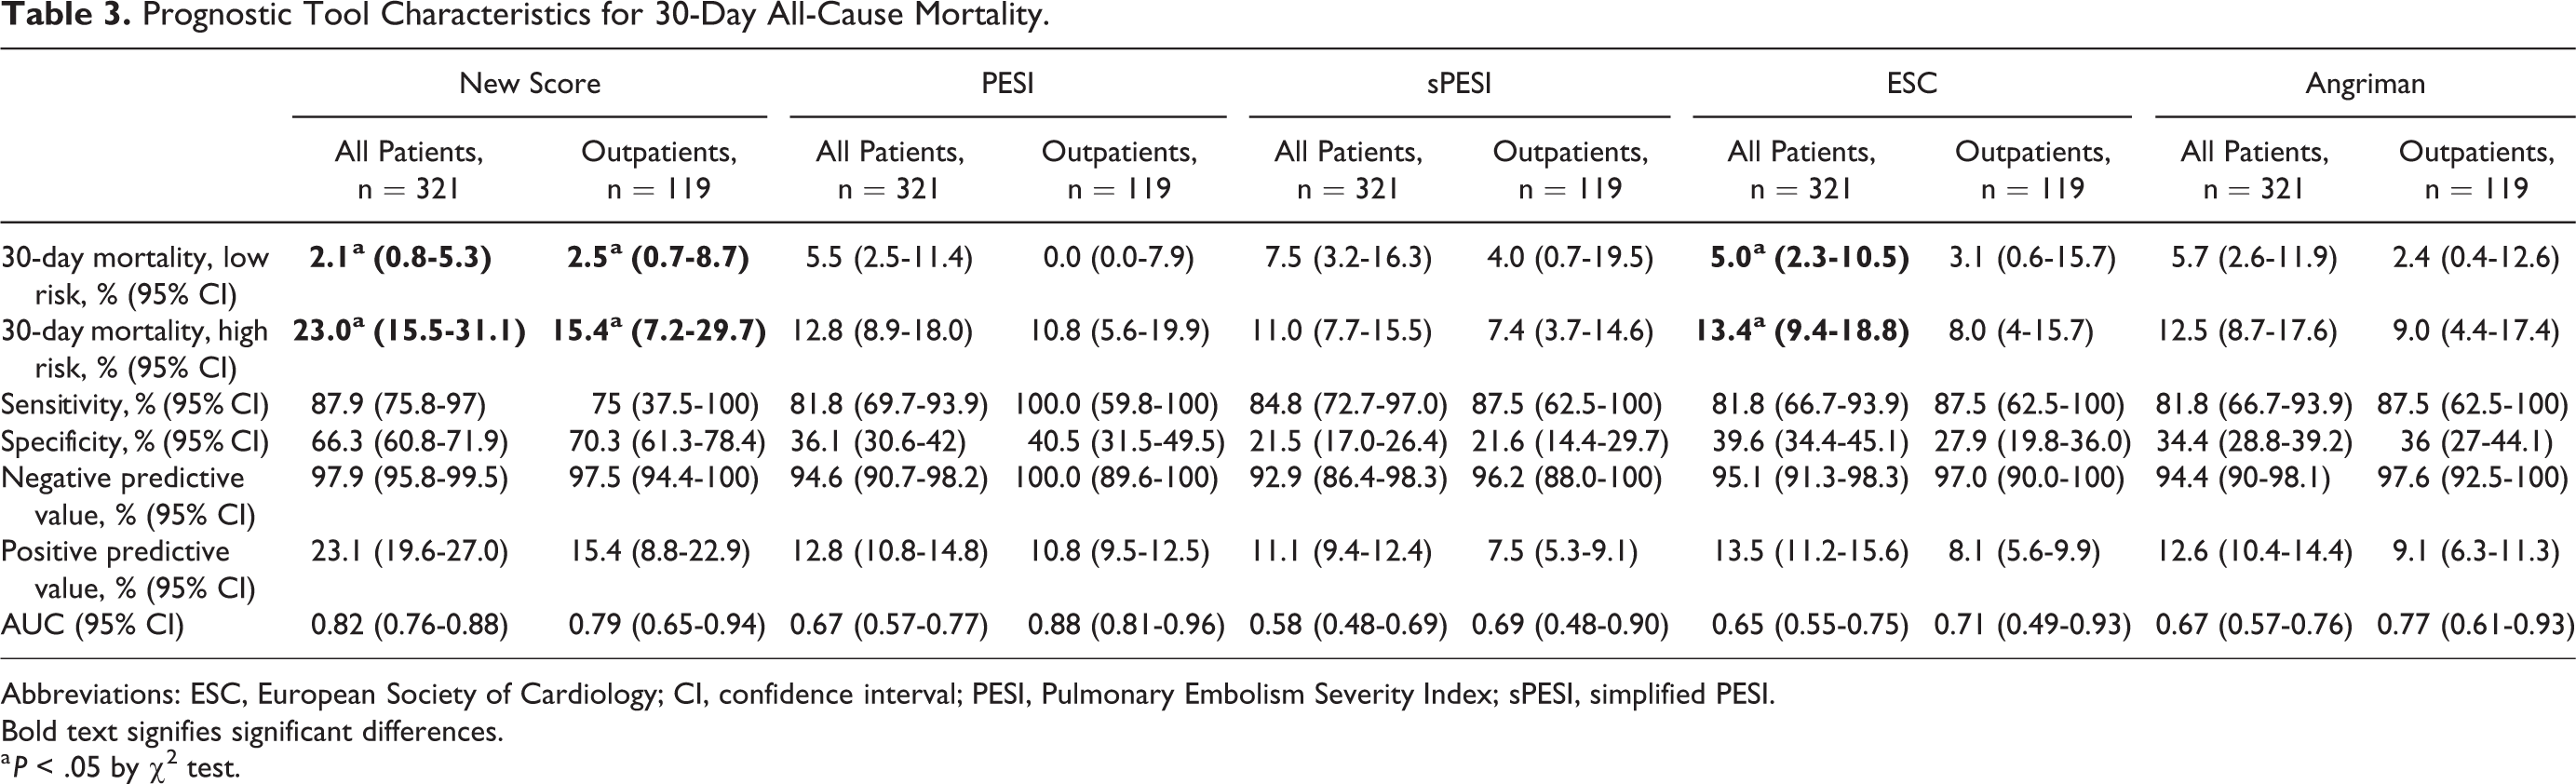
Abbreviations: ESC, European Society of Cardiology; CI, confidence interval; PESI, Pulmonary Embolism Severity Index; sPESI, simplified PESI.
Bold text signifies significant differences.
a P < .05 by χ2 test.
Secondary Outcomes
The median length of stay was 11.4 days (interquartile range [IQR] 19 days). In all, 14.3% (95% CI, 10.9%-18.6%) had a subsequent admission related to PE, while 14.3% (95% CI, 10.9%-18.6%) required intubation, and 11.2% (95% CI, 8.2-15.3) required vasopressor support.
There were 41 (12%; 95% CI, 9.6%-17.0%) bleeds within 30 days, 20 (6.2%, 95% CI, 4.1-9.4%) classified as major according to the ISTH classification. 13 There was a significant difference in major bleeding rates between low-risk and high-risk patients identified by the ESC (2.5% [95% CI, 0.9%-7.1%] versus 28.0% [95% CI, 14.3%-47.6%]) and Angriman scores (0.0% [95% CI, 0.0%-3.5%] versus 9.3% [95% CI, 6.1%-13.9%]).
Prognostic Model Performance
The AUC for 30-day, all-cause mortality for all patients was 0.67 (95% CI, 0.57–0.77), 0.58 (95%CI, 0.48-0.69), 0.65 (95% CI, 0.55-0.75), and 0.67 (95%CI, 0.57-0.76) for the PESI, sPESI, ESC, and Angriman scores, respectively (Figure 1A). Model characteristics are shown in Table 3.
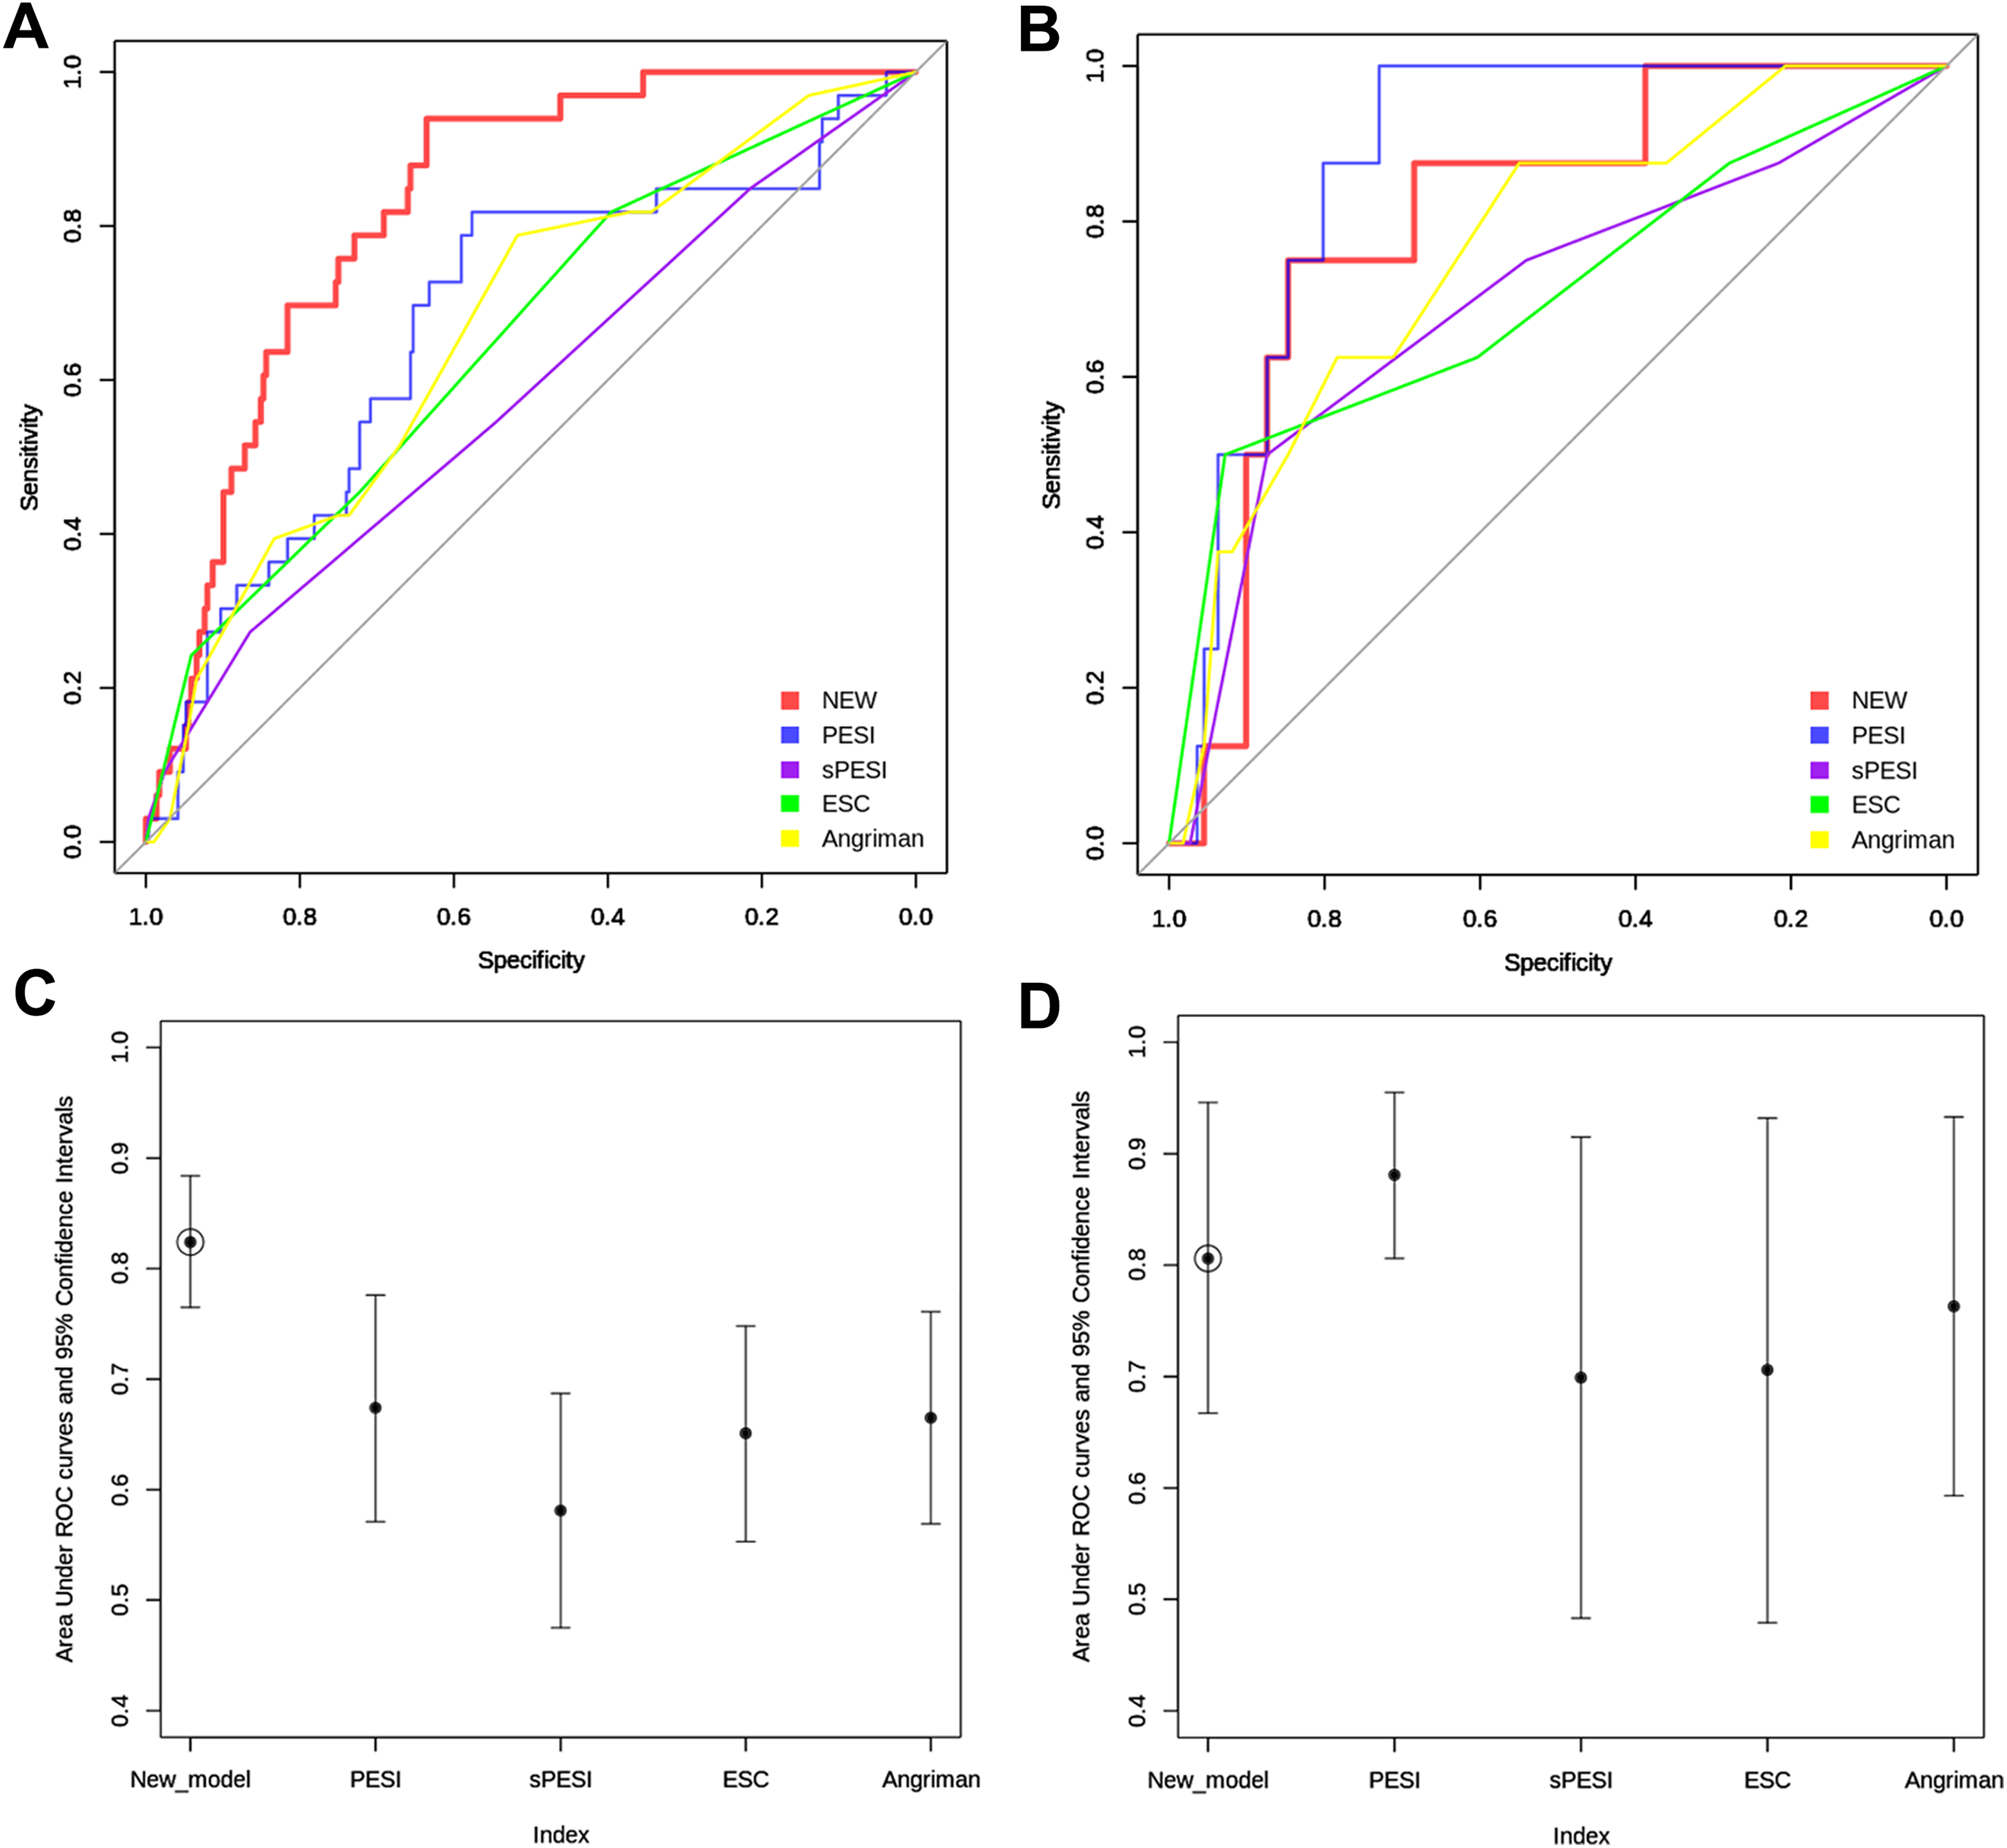
(A) The receiver–operating characteristic (ROC) curves for 30-day mortality for all patients. (B) ROC curves for 30-day mortality for outpatients. (C) Comparison of AUC values for 30-day mortality in all patients. (D) Comparison of AUC values for 30-day mortality in outpatients.
We conducted a subgroup analysis on 119 outpatients presenting with symptoms of acute PE (i.e., the reason for admission being acute PE). The AUC for 30-day, all-cause mortality was 0.88 (95%CI, 0.81-0.96), 0.69 (95%CI, 0.48-0.90), 0.71 (95%CI, 0.49-0.93), and 0.77 (95%CI, 0.61-0.93) for the PESI, sPESI, ESC and Angriman scores, respectively (Figure 1B).
For the calculation of sensitivity, specificity, NPV, and PPV, risk categories were dichotomized as low risk and high risk (intermediate- and high-risk groups). This allowed us to evaluate the prediction tools in the setting of safety for discharge. Results are shown in Table 3. Of note, the PESI criteria had a 100% (95% CI, 89.6%-100%) for 30-day mortality in patients presenting as outpatients.
Comparison to the New Prognostic Model
Since none of the evaluated models performed well in all-comers with PE, we sought to derive a new prognostic model that would better identify patients at risk of deterioration. Variables and their associated weightage in our new model are shown in Table 4. Baseline characteristics of the derivation and validation cohort are shown in Table 2. This new model achieved an AUC of 0.79 (95% CI, 0.66-0.93) and 0.83(95% CI, 0.76-0.90) on validation (n = 96) and derivation cohorts (n = 225), respectively (Figure 1). The model outperformed PESI in the entire cohort (n = 321), with an AUC of 0.82 (95% CI, 0.76-0.88; Figure 1A). In all, 195 (60.1%) patients were classified as low-risk with 126 (39.9%) classified as high-risk at a cutoff score of 100. Overall 30-day, all-cause mortality was 2.1% (95% CI, 0.8%-5.2%) and 23.0% (95% CI, 16.5%-31.1%) in the low- and high-risk groups, respectively (P < .001). The rates of major bleeding at 30 days were also significantly lower in the low-risk group: 3.8% (95% CI, 1.3%-10.5%) versus 15.4% (95% CI, 7.2%-29.7%) respectively (P = .012).
New Prognostic Model.a
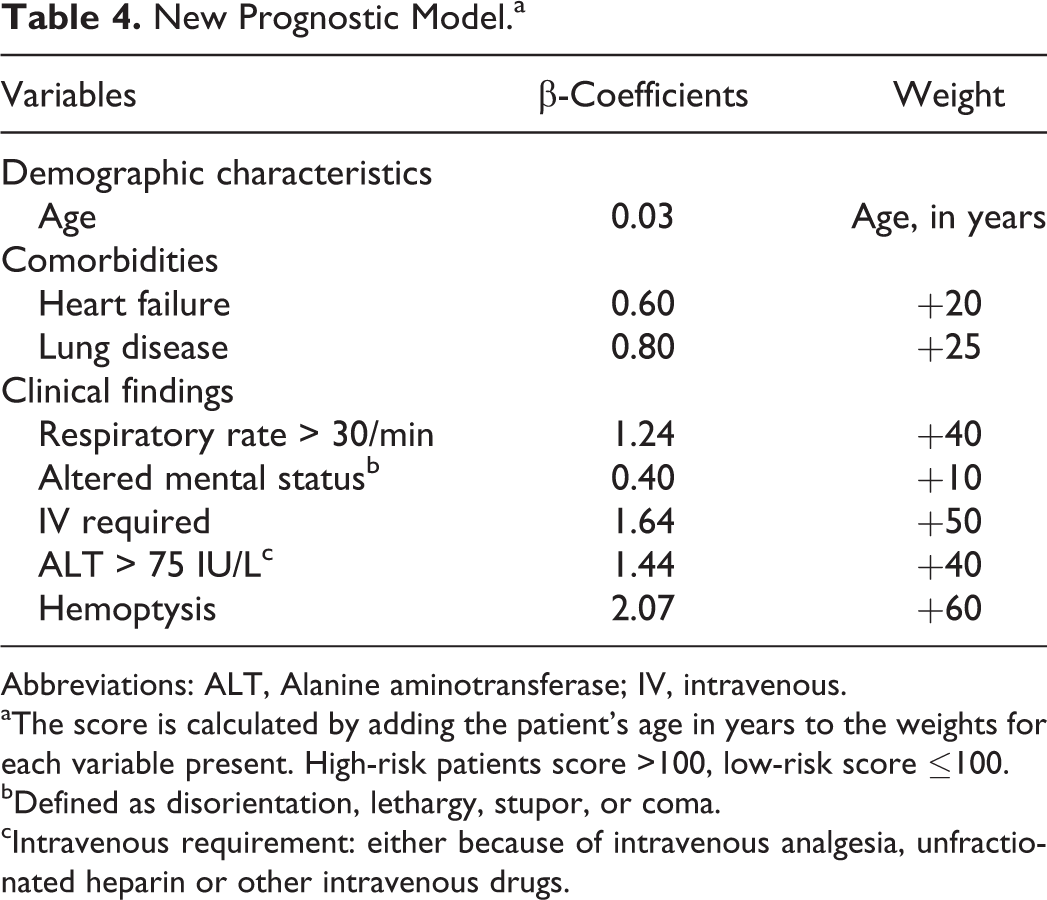
Abbreviations: ALT, Alanine aminotransferase; IV, intravenous.
aThe score is calculated by adding the patient’s age in years to the weights for each variable present. High-risk patients score >100, low-risk score ≤100.
bDefined as disorientation, lethargy, stupor, or coma.
cIntravenous requirement: either because of intravenous analgesia, unfractionated heparin or other intravenous drugs.
Discussion
In this study, we evaluated the utility of various clinical prediction tools in predicting early mortality in patients with acute PE. The overall and PE-specific 30-day mortality rate of our cohort is similar to that published in the literature at 10.3% and 2.8%, respectively. The proportion of patients classified into low- and high-risk PE are similar to that in the published literature, despite the inclusion of all patients, regardless of presentation setting.
Unfortunately, none of the clinical prediction tools fare well when applied to all-comers with acute PE. One possible reason for this is that a significant proportion of acute PEs were diagnosed in patients who were either critically ill in intensive care settings or who had long, complicated stays in hospital. This would confound all-cause mortality data as well as certain clinical parameters used in calculating risk scores. Of all the clinical prediction tools evaluated, the one proposed by the ESC is the best at risk-stratifying patients. This is likely to be because it relies on biochemical or radiological markers that are less sensitive to acute illness.
For all the scores, the calculated PPV and specificity for early mortality was low. This is likely due to the fact that intermediate- and high-risk patients were grouped together for the purposes of calculation. The vast majority of acute PEs in our institution are managed in the inpatient setting. We chose to dichotomize the groups as such because we wanted to see whether these scores could identify low-risk patients who can safely be discharged early for outpatient treatment.
When the subgroup of symptomatic PE or patients presenting in the outpatient setting were analyzed, the PESI, Angriman, and ESC prediction tools have good value in predicting early mortality. The sPESI, while easier to calculate, has less discriminatory value. The NPV for 30-day mortality was 100% for low-risk patients defined by the PESI. This is consistent with findings from other studies 18,19 and suggests that such patients may be considered safe for discharge and management in the outpatient setting. The caveat to this is that low-risk patients identified by the PESI score could theoretically include patients with hypotension. In addition, we still lack a clinical prediction tool that can also accurately identify patients at risk of bleeding on anticoagulation.
Given the limitations of the currently available prediction tools, we sought to develop a model that would identify high-risk PE in all-comers, as well as patients at higher risk of major bleeding at 30 days. Our model has a better AUC than other models included in this study and appears to be better at identifying patients at risk of major bleeding. It is limited by its single-center, retrospective design. In addition, we only included patients with PE diagnosed via CTPA. Although these represent the vast majority of PEs in our institution, certain populations less likely to be subjected to CTPA, such as pregnant women, will be selected against. We chose 30-day outcome measures as PE is associated with early mortality. The utility of the score would be improved by assessing longer term outcomes as the data set matures. The score was derived and internally validated, which limits its general applicability. The score requires rigorous external validation with large data sets before it can be recommended for routine clinical use in untested populations.
Many of the patients in whom acute PE develops are not the typical patients described by conventional risk scoring systems. They often have comorbidities, may be in hospital for a number of other reasons and may be frailer. All of these factors can adversely impact on prognosis, affecting the predictive value of prognostic scores. Our score involves clinical and baseline laboratory data and is easy to calculate at diagnosis of PE. The 30-day, all-cause mortality rate and major bleeding rate were low in low-risk patients, which indicates that this model may be useful in identifying patients suitable for early discharge or less intensive inpatient monitoring. The score also provides a means for discriminating high-risk patients from a heterogenous group. Such high-risk patients may benefit from more intensive monitoring, careful titration of anticoagulation, and should not be candidates for early discharge. Further study is required to assess whether the discriminatory ability of the score can be applied to the subgroup of patients with submassive PE, so as to identify patients who might benefit most from early thrombolysis.
Conclusion
The PESI, sPESI, ESC, and Angriman clinical prediction tools have little discriminatory value for early mortality for all-comers with acute PE, although they remain useful in outpatients presenting with symptoms of acute PE. We have derived a new model that outperforms existing evaluated models. However, we also acknowledge that further validation on an external cohort is required before its use can be recommended to guide patient management.
Footnotes
Authors Contributions
Wei-Ying JEN, BM BCh and Young Seok JEON, BSc contributed equally to this work, and are regarded as joint first authors. Yen-Lin CHEE, MBChB PhD and Mengling FENG, BSc PhD contributed equally to this work, and are regarded as joint last authors.
Declaration of Conflicting Interests
The author(s) declared no potential conflicts of interest with respect to the research, authorship, and/or publication of this article.
Funding
The author(s) received no financial support for the research, authorship, and/or publication of this article.