
Abstract
Glycoprotein IIb/IIIa (GPIIb/IIIa) is the most abundant platelet surface receptor for fibrinogen and von Willebrand factor. Polymorphism PlA1/A2 in the gene of GPIIb/IIIa is among the risk factors for the development of arterial and venous thrombosis. The aim of this study is to evaluate the effect of the carriage of PlA1/A2 on the size, topographic features, and membrane stiffness of platelets from healthy controls and patients with deep venous thrombosis (DVT). Atomic force microscopy (AFM) imaging and nanoindentation (force–distance curves) were applied to investigate the morphological and nanomechanical properties (Young’s modulus) of platelets immobilized on glass surface. The surface roughness (Ra) and height (h) of platelets from patients with DVT, carriers of mutant allele PlA2 (Ra = 30.2 ± 6 nm; h = 766 ± 182 nm) and noncarriers (Ra = 28.6 ± 6 nm; h = 865 ± 290 nm), were lower than those of healthy carriers of allele PlA2 (Ra = 48.1 ± 12 nm; h = 1072 ± 338 nm) and healthy noncarriers (Ra = 49.7 ± 14 nm; h = 1021 ± 433 nm), respectively. Platelets isolated from patients with DVT, both carriers and noncarriers, exhibit much higher degree of stiffness at the stage of spreading (E = 327 ± 85 kPa and 341 ± 102 kPa, respectively) compared to healthy noncarriers (E = 198 ± 50 kPa). In addition, more pronounced level of platelet activation was found in polymorphism carriers. In conclusion, the carriage of PlA2 allele modulates the activation state, morphology, and membrane elasticity of platelets.
Keywords
Introduction
Platelets are major determinants of blood hemostasis and thrombosis. In the last years, a considerable progress has been made in the understanding of the relation between platelets behavior, changes in their shape and cytoskeleton, and their function. 1,2 Various factors, including inherited ones, control the platelet morphology and thereby cause alterations in their nanomechanical properties. 1 –6
Resting platelets are nonadhesive anucleate 2 to 5 µm discoid cells, 1,7 possessing thick wrinkled membrane and circulating in the bloodstream. They respond to vasculature damage and shear stress by simultaneous shape change—first they convert from compact discoid to asymmetrical spheres and then flatten and spread on the surface of damaged endothelium by extending actin-rich filopodia and lamellae. 7,8 These morphological changes due to reorganization of the cell cytoskeleton involve interactions between distinct receptors and adhesive ligands, as well as changes in blood flow. 9,10
For a variety of cells, including stem cells, cancer cells, and inflammatory cells, it was shown that the cell membrane elasticity and the balance of biomechanical properties are vitally allied to the cell function and to cell differentiation, apoptosis, regeneration, specific cell activities, and so on. 11,12 Stiffness tomography investigations demonstrated changes in the actin cytoskeleton on actin depolymerization in fibroblasts. 13
However, the alterations in platelet elasticity and its interrelationship with platelet’s activation phase are still an object of extensive investigations. When exposed to stiff microenvironments, platelets may undergo reorganization that generates higher stiffness and high contractile forces, depending on the environmental factors. 14 The nanomechanics of platelets was also found to change under thrombin activation—they significantly stiffen during spreading but soften during thrombin-induced activation. 15,16
Changes in platelet shape on activation and adhesion and related signals are primed by integrins and include targeted phosphorylation, activation of Ras homolog gene family member A (RhoA) in the formation of focal adhesions, 17 lamellipodia (Rac), 18 and filopodia (Cdc42 signals) 19 that are related to intracellular stress level, actin polymerization, and microtubule rearrangements. 20 Platelets activation also results in a conformational change in integrin glycoprotein IIb/IIIa (GPIIb/IIIa; also known as αIIbβ3), which is important for their spreading, adhesion, propagation, and aggregation processes. An important step that regulates the process of conversion from reversible to stable adhesion of platelets is the activation of integrin GPIIb/IIIa by the generation of agonists like adenosine diphosphate (ADP), thromboxane A2, and thrombin. Platelet GPIIb/IIIa (∼105 per platelet), on the other hand, is an important element of the clot-forming process, being rearranged during activation. The PlA1/A2 (rs5918) polymorphism in GPIIb/IIIa gene was discussed as a possible factor of prothrombotic tendency, along with commonly recognized inherited thrombophilic factors: Factor V Leiden (FVL) and mutation G20210A in prothrombin gene. 21,22 The frequency of mutant allele PlA2 was found to be about 20% in healthy controls and 32.8% in patients with DVT. 23 The carriage of PlA2 allele has been associated with an increased risk of myocardial infarction and stroke and was postulated as a risk factor for venous thromboembolism (VTE). 24 –28 Platelets play an important role in the development of venous thrombosis, and along with slow blood flow and vein wall damage, they contribute to a hypercoagulable and prothrombotic state. The occurrence of multiple interacting risk factors is a precondition for VTE development. 26
Recently, atomic force microscopy (AFM) was applied to investigate the biomechanical characteristics and 3-dimensional changes in platelet architecture on activation. 2,3,6,29 The experiments on elasticity in parallel with depolymerization of cytoskeleton provided a new light on the cell biomechanics. 4
The aim of our study was to assess the changes in the topology and membrane elasticity (Young’s modulus) of platelets isolated from healthy individuals and patients with deep venous thrombosis (DVT) at the cell spreading stage and to evaluate the impact of the carriage of allele PlA2 in GPIIb/IIIa on their nanomechanical properties.
Patients and Methods
Selection of Patients and Study Protocol
Fifteen patients (9 males and 6 females) with deep venous thrombosis managed in the Clinic of Surgery at University Hospital, Pleven, Bulgaria, were investigated; the mean age of the patients was 48 ± 16 years (range: 33-77 years). The selection criterion was the history of DVT diagnosed by compression and Doppler ultrasonography according to criteria set by Evidence-Based Clinical Practice Guidelines.
The healthy control group included 10 unrelated healthy individuals (6 males and 4 females) with no family history of thrombosis. The healthy controls—5 carriers and 5 noncarriers of PlA2 allele in glycoprotein gene—were selected from the database of healthy controls.
The study protocol was approved by the ethics committee of the Medical University, Pleven. All the participants involved in the study provided written informed consent for the investigation.
DNA Analysis
The PlA1/A2 polymorphism was investigated by polymerase chain reaction (PCR) and restriction analyses. Venous blood was collected in BD EDTA vacutainers (Becton Dickinson and Company, USA). DNA was isolated following the procedure of GFTTM Genomic Blood DNA Purification Kit (Amersham Pharmacia Biotech Inc, USA). DNA samples were quantified using the agarose gel procedure.
The primers used were F: 5′-TTC TGA TTG CTG GAC TTC TCT T-3′ and R: 5′-TCT CTC CCC ATG GCA AAG AGT-3′. The amplification was carried out in a thermal cycler (Techne, version 11.04). The resulting product of 266 base pair (bp) was tested in 2% agarose gel and was digested at 37°C for 12 hours with Msp restrictase (20 000 U/mL; New England BioLabs Inc, USA), 3 U per sample, in the presence of 0.2 µL purified bovine serum albumin (10 mg/mL; New England BioLabs Inc) and 2 µL NEBBuffer 2 (New England BioLabs Inc, USA) in a total volume of 20 µL. The fragments, 266 bp (PLA1 allele) and 221 bp/45 bp (PLA2 allele), were separated by electrophoresis in 3% agarose gel and visualized by ethidium bromide in UV light. The PCR guidelines were strictly followed to avoid contamination. 24,30,31
Platelets Collection
Venous blood was drawn from the patients after morning fasting before taking medications by using minimum tourniquet pressure and 19-gauge needle. The first 5 mL of blood was used for DNA analysis, but not for platelets isolation in order to avoid an effect of thrombin traces. All procedures were performed at room temperature. Whole blood was centrifuged at 1000 rpm (150g) for 15 minutes, and the upper fraction of platelet-rich plasma (PRP) was transferred to a new tube. Tubes were kept upright and capped. To collect a platelet pellet PRP was centrifuged at 2700 rpm for 5 minutes. The supernatant with platelet-poor plasma was carefully removed, and the pellet was gently resuspended in phosphate-buffered saline (PBS, pH 7.2). Then platelets were washed twice in PBS buffer before their deposition on glass coverslip for AFM study.
Sample Preparation for AFM Experiments
The isolated platelets were spread on sterilized round glass slides (diameter of 12 mm) for 30 minutes, followed by washing with PBS buffer to remove the loosely attached cells. Washed samples were fixed in 1% glutaraldehyde with pH 7.4 for 40 minutes, washed again with PBS buffer, and gently dried under nitrogen stream.
Atomic Force Microscopy Imaging
The AFM imaging was performed with NanoScope V system (Bruker Inc, USA) in tapping mode in air. Standard silicon nitride (Si3N4) probe tips (BudgetSensors; Innovative Solutions Ltd, Bulgaria) were used (tip radius <10 nm). The glass slides were fixed to metal pads and scanned with a very slow rate of 0.2 Hz. Each sample was examined at 5 to 10 different locations all over the slide. The images (512 × 512 pixels) were captured in height and error modes, and morphology characterization (determination of the height, spreading area, and average roughness of the objects) was carried out using Bruker NanoScope Analysis 1.3 software. The roughness analysis was performed in a fixed area of 0.9 × 0.9 μm in the central part of the platelets, since it is well known that roughness depends strongly on the scanned area. To avoid the effect of the cell’s curvature, we applied first-order flattening prior to the roughness analysis. 32,33
Force Mapping
Force–volume (FV) mapping combined the force measurement and topographic imaging capabilities. Single force–distance (f-d) curve recorded the force (or deflection of the cantilever) felt by a tip and the corresponding displacement of the piezo in approach/retraction cycle. Each f-d curve was measured at a unique position on the sample surface, and force curves from an array of points were combined into a 3-dimensional array of force data. Therefore, the FV data set combined at the same time the topography information and the force information. First, the topographic image of a single platelet in contact mode was obtained and then FV mapping was carried out in the same area.
The FV mapping was always preceded by thermal tune calibration of the sensitivity of the piezo on a bare glass surface. Gold/chromium-coated Si3N4 tips with elastic constant about 0.06 N/m and length about 200 μm (purchased from BudgetSensors, Innovative solutions Ltd, Bulgaria) were used. The precise value of the elastic constant of the cantilever was determined by the thermal tune method right before the FV mapping. Force curves were taken typically at a lateral scan rate of 0.5 Hz, 128 pixels per line.
Young’s Modulus
The elastic properties of the sample can be well described with the Young’s modulus (E) determined from the f-d curves registered by AFM. The most appropriate model for the evaluation of the elastic modulus of living cells is the Hertz model. 2,34,35 The relationship between the applied force F and the indentation δ based on the Hertz model is given by the equation:
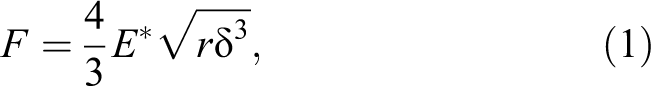
where r is the radius of the tip curvature and E* is the effective modulus of a tip–sample system. E* can be expressed with:
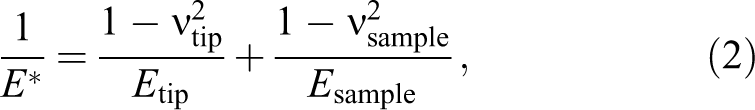
where ν is the Poisson’s factor representing the ratio of transverse to axial strain. Since the material of the tip is significantly harder than the sample (ie, Etip >> Esample), then:
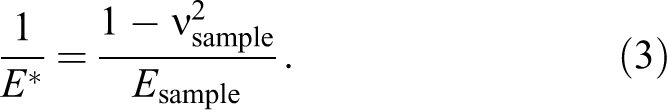
The value of ν is in the range of 0 to 0.5 and it is generally assumed that cells are incompressible with a Poisson’s ratio of 0.5.
Results
Atomic Force Microscopy Images of Platelets
The morphological features and mechanical properties of platelets from the following groups of participants were analyzed: (1) healthy individuals (controls) noncarriers of thrombophilic mutations, (2) healthy carriers of PlA2 allele in GPIIb/IIIa gene, (3) patients with DVT noncarriers, and (4) patients with DVT carriers of PlA2 allele (Table 1). The typical AFM images of platelets isolated from those groups are presented in Figure 1. Evidently, the platelets are slightly activated by the isolation procedure and the contact with the glass coverslip, since filopodia are clearly visible. Upon activation, platelets undergo a series of morphological alterations that include membrane protrusions, formed as a consequence of granules gathering into the center of the cell, filopodia and lamellipodia formation, and spreading on the surface. 36,37
Age and Carriage of PlA1/A2 Polymorphism of the Studied Healthy Individuals and Patients With DVT.
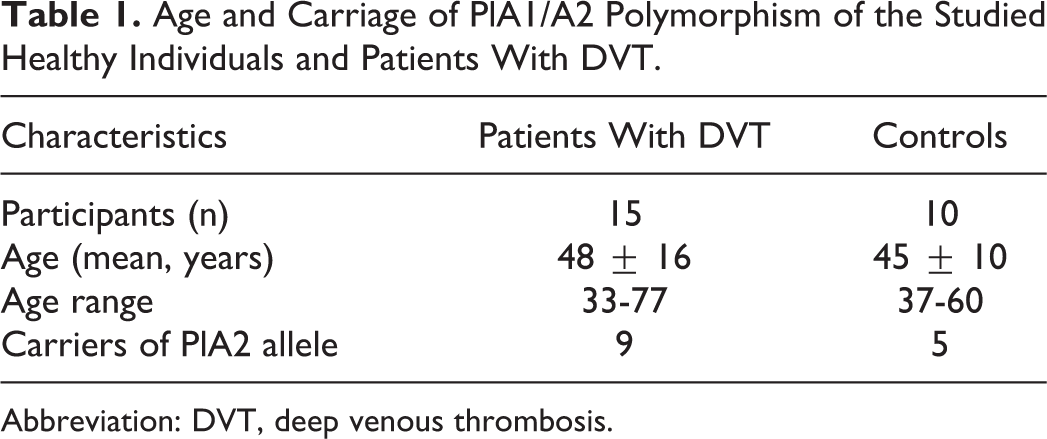
Abbreviation: DVT, deep venous thrombosis.
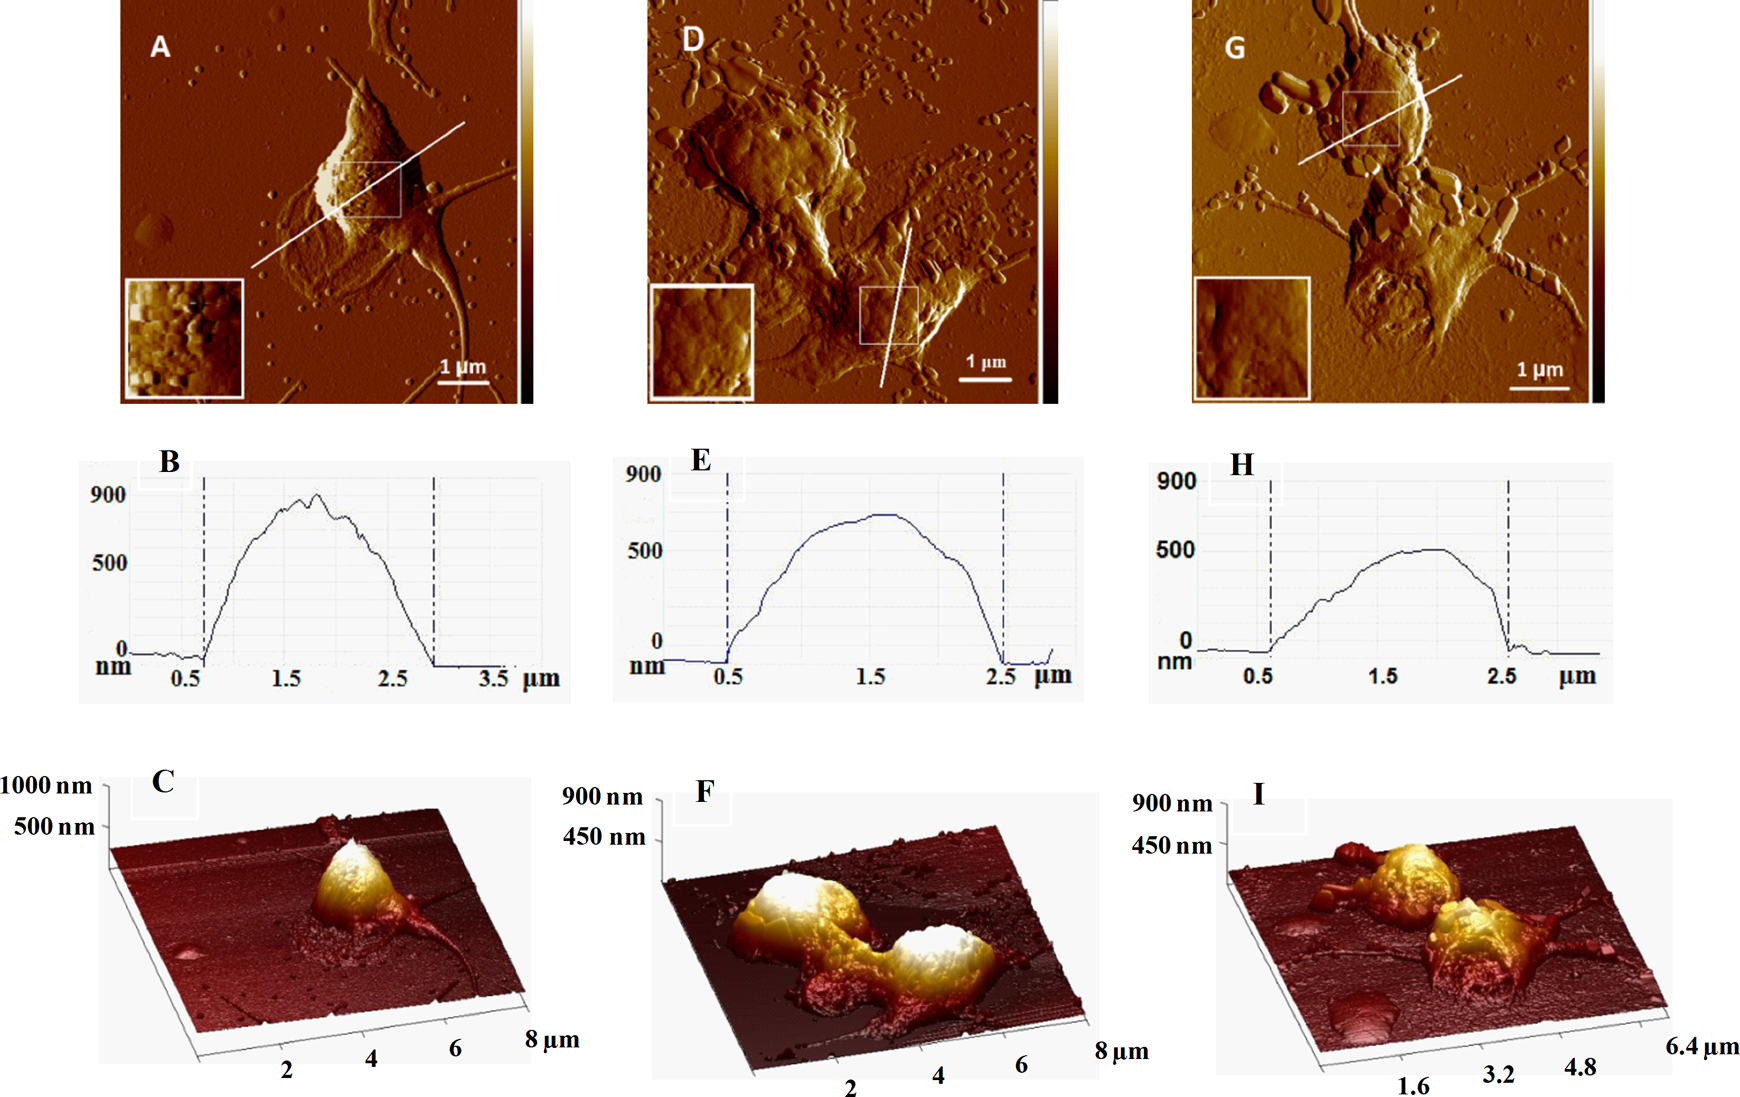
Representative error mode and 3-dimensional (3D) mode atomic force microscopy (AFM) images of platelets derived from healthy individual noncarrier of PlA2 allele (A, C) and carrier of PlA2 allele (D, F) and from patient with DVT carrier of PlA2 allele (G, I) and deposited onto glass coverslip. The platelets were fixed with 1% glutaraldehyde. The images were taken in tapping mode in air, at room temperature. Scale bar is indicated in panels A, D and G. Atomic force microscopy 2-dimensional (2D) profiles (A, D, G). Insets represent enlarged images of the central framed area. Cross-section plots (B, E, H) from the white lines in A, D, G.
The platelet from healthy individual noncarrier of PlA2 allele is obviously at the initial stage of activation when it loses its discoid shape and forms long filopodia (Figure 1A, C) and its membrane appears gently pleated (Figure 1A). The activated platelets derived from carriers of PlA2 allele in both healthy individuals and patients with DVT are at the late pseudopodial stage with dendrite shape and excreted hyaloplasm; often platelets clump together as seen in Figure 1F and I. The hyaloplasm of DVT platelets is fully spread around the cell, and a few particles with a diameter slightly over 1 μm probably detached from the hyaloplasm can be distinguished (Figure 1I).
One of the events clearly seen is the release of small objects around the activated platelets (Figure 1) that most probably represent platelet microparticles (PMPs) and/or granules.
Substantial difference was revealed in the morphology and number of particles released from the platelets of healthy individuals, carriers and noncarriers, and patients with DVT (Figure 2). The shape of the particles, derived from healthy controls, is spherical (Figure 2A, B) with a diameter in the range 110 to 170 nm for noncarriers but much larger for carriers of PlA2 allele (200-400 nm). Patients with DVT, on the other hand, are characterized by polygonally shaped PMPs whose sizes vary in a much wider interval from 100 to 1100 nm. Our future efforts will be directed toward in-depth characterization of the nature of these particles.
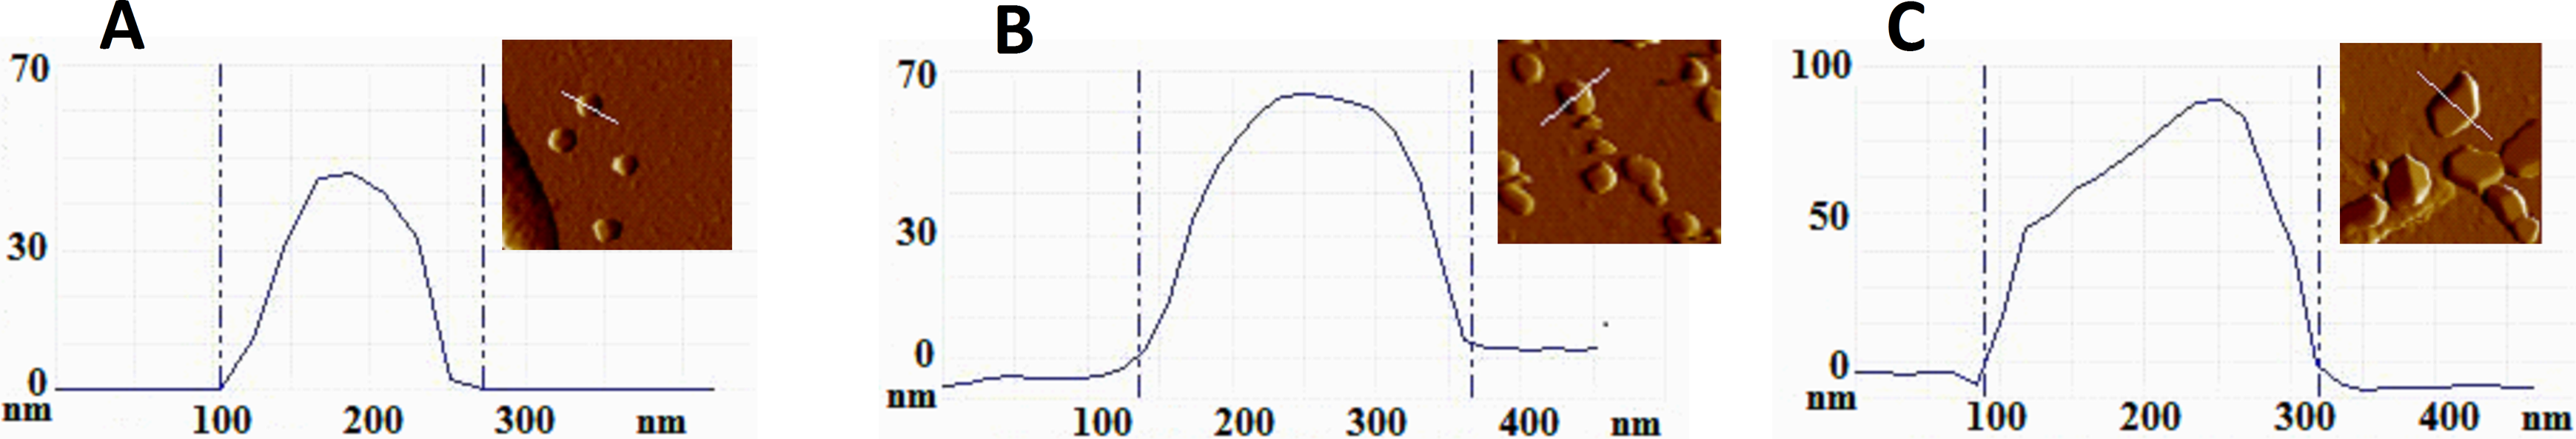
Atomic force microscopy (AFM) images of the particles (derived from the corresponding topographs in Figure 1) released from the platelets of healthy noncarrier (A), healthy carrier (B), and patient with DVT carrier of PlA2 allele (C) and the corresponding height profiles.
Topography of Platelets From Healthy Controls and Patients With DVT
The topographic parameters (platelet height, h; spreading area and average surface roughness, Ra) derived from the AFM scans of 117 platelets from healthy controls (65 platelets of carriers and 52 of noncarriers) and 136 platelets from patients with DVT (58 platelets of carriers and 78 of noncarriers) were determined at the stage of the platelets spreading on the glass surface, when most of the platelets get activated after they came into contact with the glass coverslip.
Therefore, the statistical analysis refers solely to activated platelets. Platelet topographic parameters are presented on Figure 3.
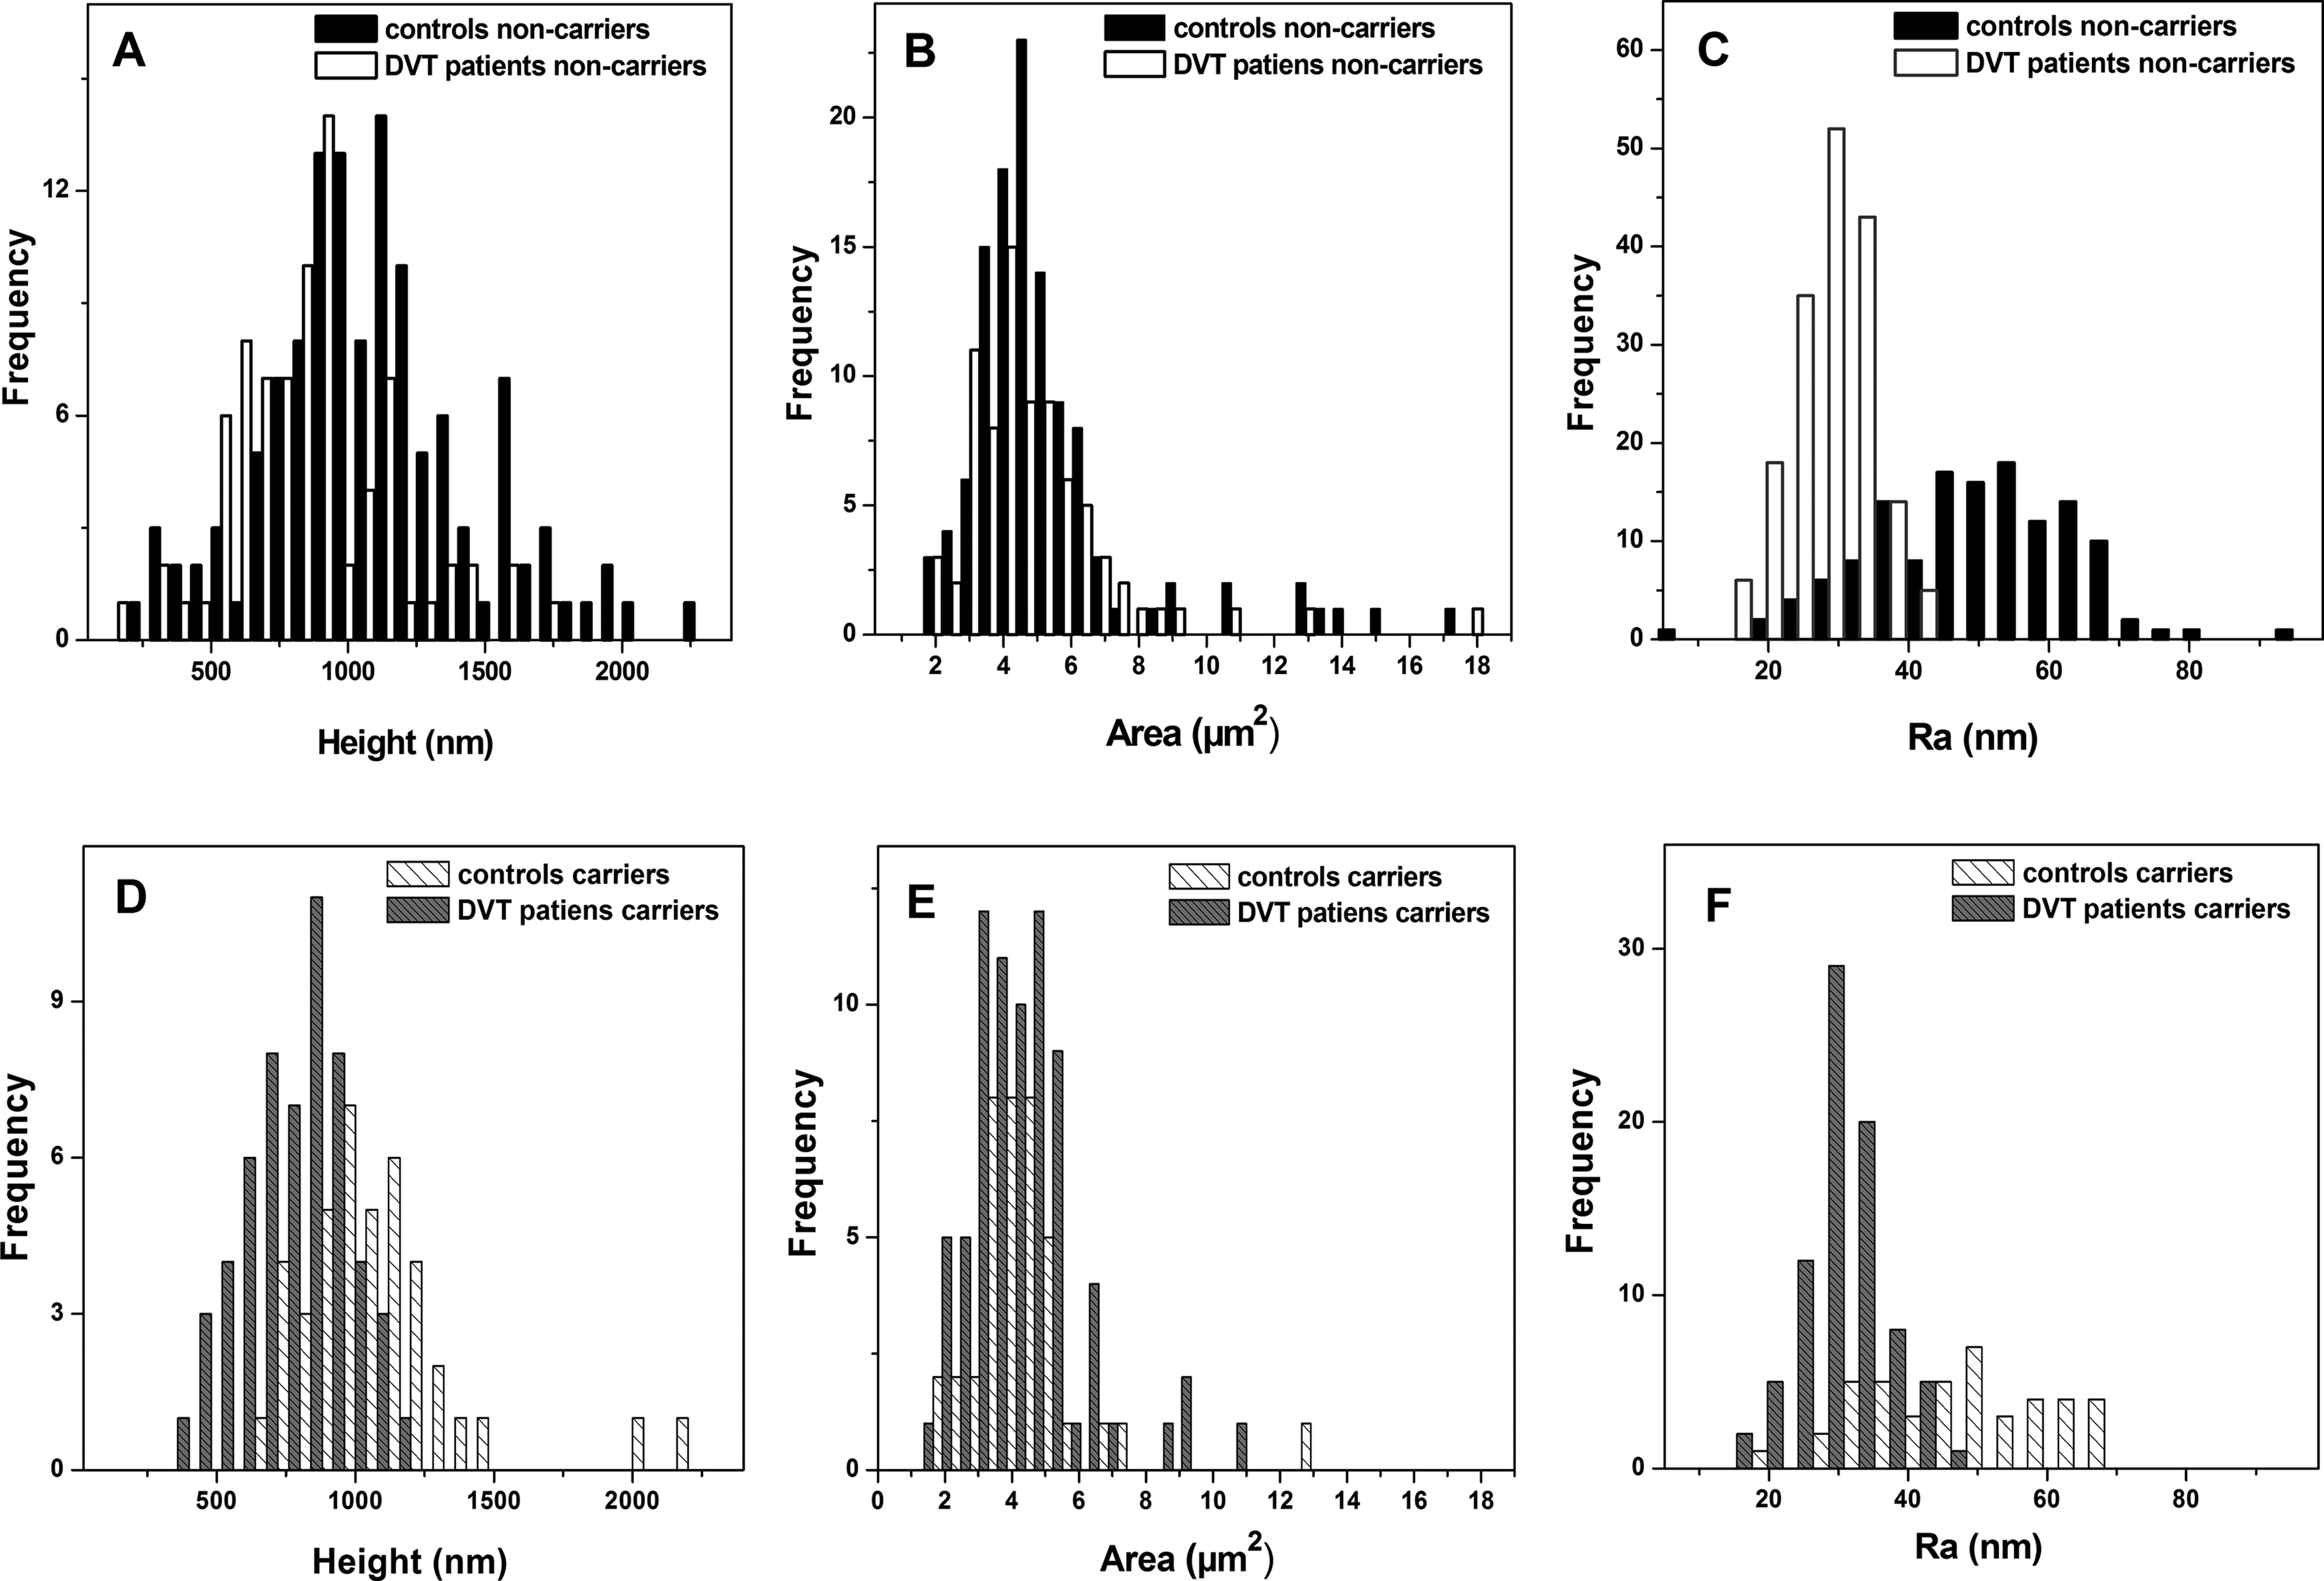
Histograms of the height (A, D), surface area (B, E), and roughness (C, F) distribution of the platelets, obtained from healthy individuals and patients with deep venous thrombosis (DVT), noncarriers (panels A-C) and carriers of PlA2 allele (panels D-F) as designated on the figure panels.
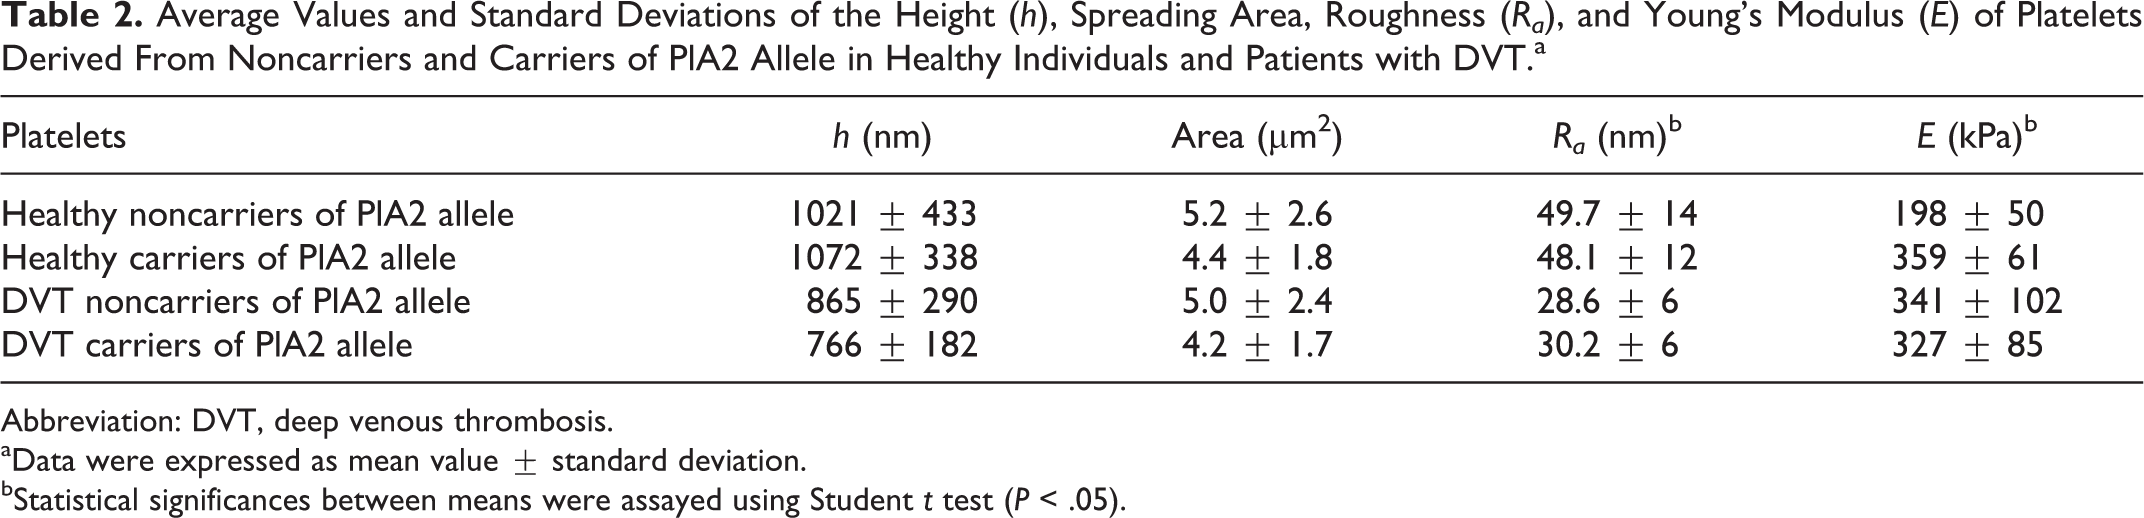
The platelets from patients with DVT have significantly lower height as compared to the controls irrespective of the carriage of PlA2 allele (Table 2, Figure 3A), the average values being h = 1021 ± 433 nm for platelets isolated from healthy individuals and h = 865 ± 290 nm for platelets from the patients with DVT, noncarriers of PlA2 allele, and h = 1072 ± 338 nm versus h = 766 ± 182 nm for control and DVT, carriers of PlA2 allele, respectively (Table 2).
Average Values and Standard Deviations of the Height (h), Spreading Area, Roughness (Ra), and Young’s Modulus (E) of Platelets Derived From Noncarriers and Carriers of PlA2 Allele in Healthy Individuals and Patients with DVT.a
Abbreviation: DVT, deep venous thrombosis.
aData were expressed as mean value ± standard deviation.
bStatistical significances between means were assayed using Student t test (P < .05).
No significant difference was found between the distribution of the spreading area of platelets from healthy individuals and those from patients with DVT. The mean area of platelets isolated from healthy controls is 5.2 ± 2.6 µm2 for noncarriers and 4.4 ± 1.8 µm2 for carriers of PlA2 allele, and 5.0 ± 2.4 µm2 and 4.2 ± 1.7 µm2 for patients with DVT, noncarriers and carriers of PlA2 allele, respectively (Table 2). The platelets area is somewhat lower in both patients with DVT and healthy controls, carriers compared to noncarriers of PlA2 allele (Table 2).
The roughness values determined in the central part of the platelets (in an area of 0.9 × 0.9 μm) were significantly lower for platelets isolated from patients with DVT (Ra = 28.6-30.2 nm) than those from controls (Ra = 48.1-49.7 nm), both for noncarriers and carriers of PlA2 allele (Figure 3 and Table 2).
Young’s Modulus of Platelets From Healthy Controls and Patients With DVT
The Young’s moduli of the individual platelets were determined by fitting each f-d curve using Equation 1 (“Patients and Methods” section). Assuming that the stiffness of the human platelets varies widely in different parts of the cell, 38 the f-d curves (about 12 for each platelet) were recorded in the platelet central part. Figure 4 illustrates the distribution profiles of the Young’s modulus obtained from platelets of healthy individuals and patients with DVT, carriers and noncarriers of thrombophilic allele PlA2. The distribution profiles of the Young’s modulus of carriers versus noncarriers of polymorphism are very different for both healthy individuals and patients with DVT. The control platelets, isolated from both carriers and noncarriers, show relatively normal distribution patterns centered on the mean values of the Young’s modulus (Figure 4A), while those from patients with DVT exhibit more complex distribution pattern (Figure 4B). We can distinguish 3 populations of platelets in DVT noncarriers; the Gaussian fitting of the data reveals that the largest one is centered at 347 ± 50 kPa, while the 2 others have either higher (590 ± 50 kPa) or lower (197 ± 10 kPa) average value of the Young’s modulus. The elasticity of a small cohort of the investigated platelets is close to that of controls noncarriers.
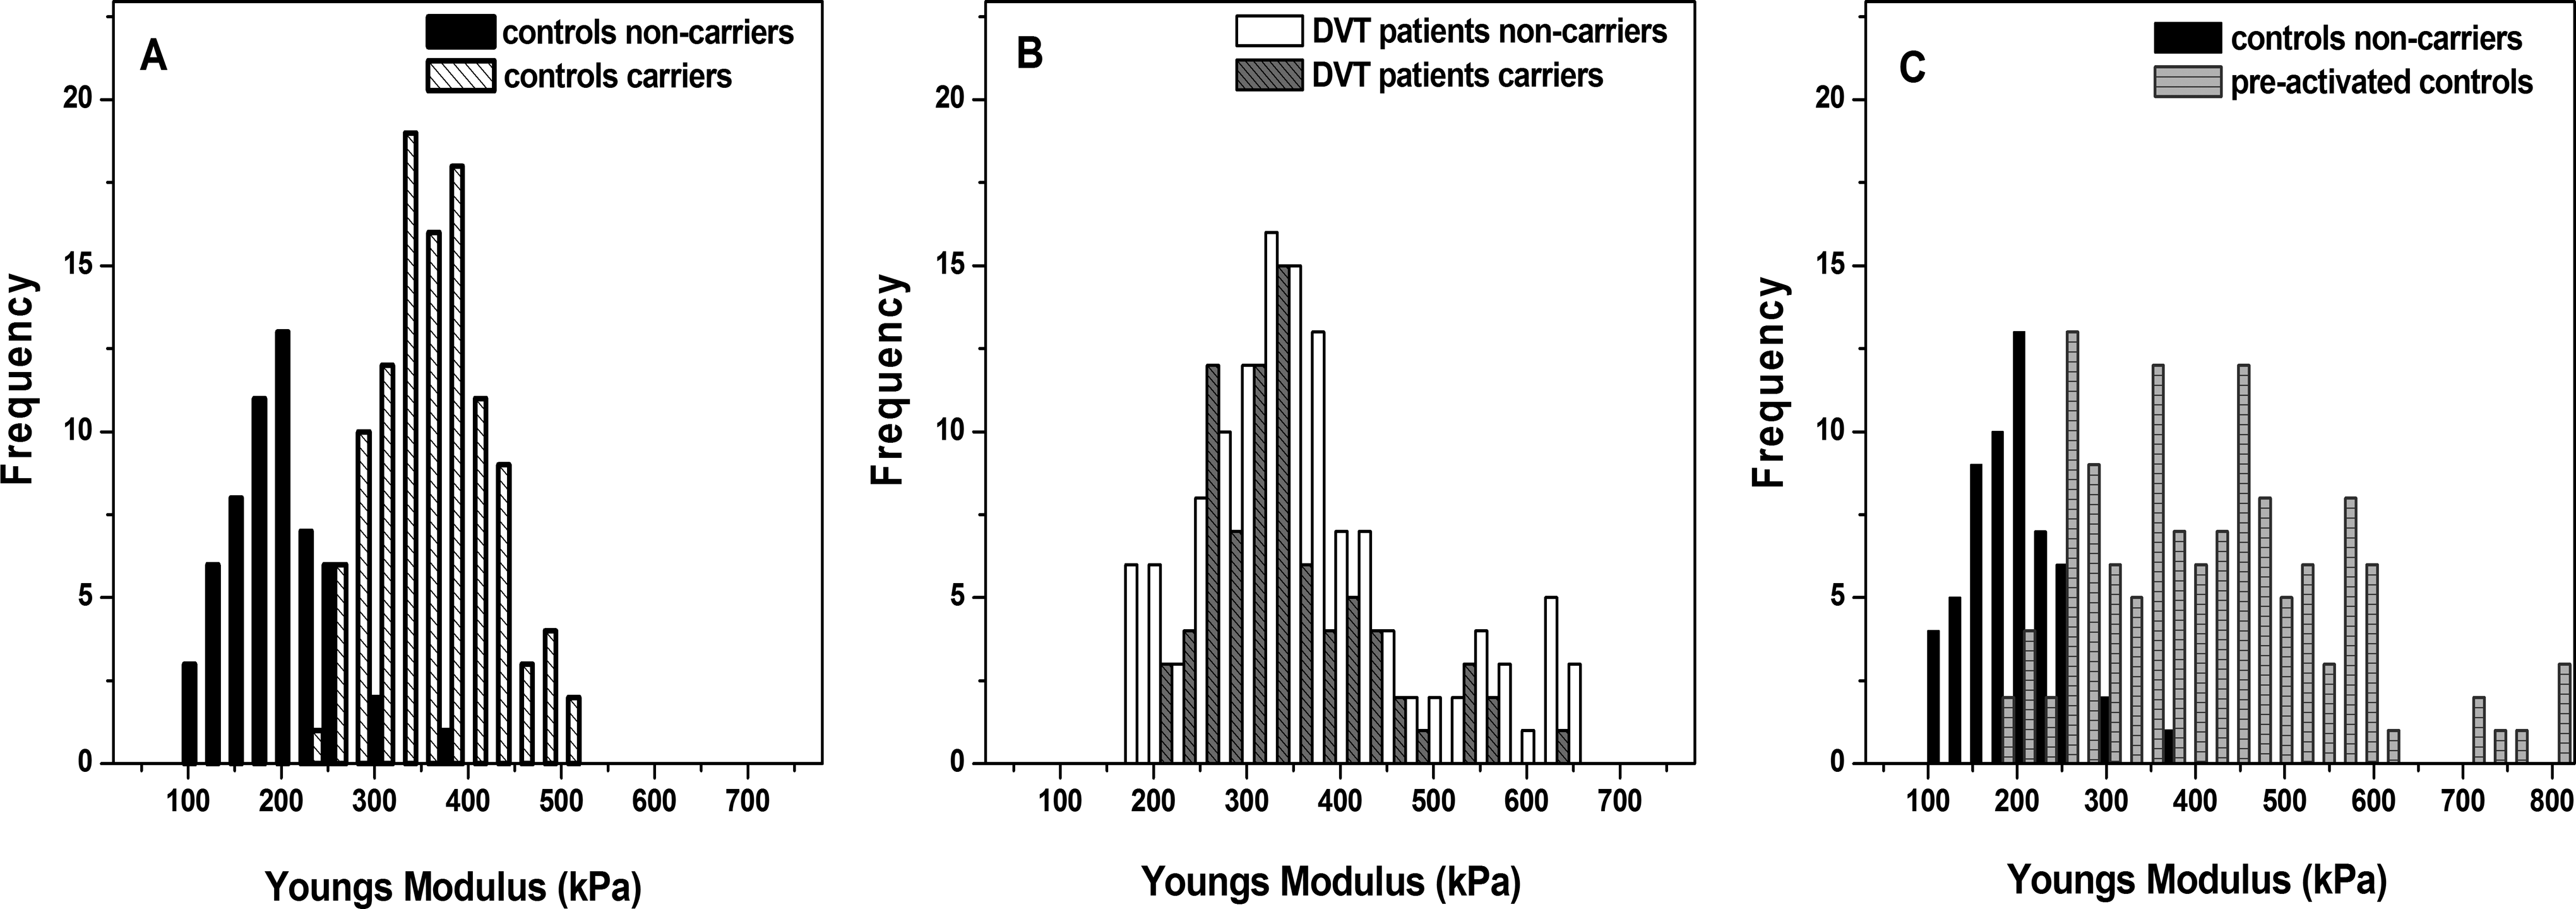
Young’s moduli histograms of platelets derived from healthy controls and patients with DVT, carriers and noncarriers of PlA1/A2 polymorphism. Healthy individuals noncarriers (A, C) and carriers (A) of PLA1/A2 polymorphism; patients with deep venous thrombosis (DVT), noncarriers and carriers (B) of PLA1/A2 polymorphism; and preactivated with ADP platelets of the same healthy noncarrier (C) as designated on the figure panels.
The distribution of Young’s moduli obtained for platelets of DVT carriers reveals 2 populations of cells with normal distribution and stiffness of 321 ± 60 kPa and 553 ± 30 kPa, respectively. The corresponding values of the Young’s modulus for healthy controls were 359 ± 61 kPa and 198 ± 50 kPa for carriers and noncarriers of thrombophilic polymorphism, respectively. Thus, carriage of PlA2 allele contributes to a strong change in the elasticity of the platelet membranes and consequently to approximately twice stiffer cells membranes than “healthy noncarrier.” For patients with DVT noncarriers, the elasticity modulus of the platelets’ membranes was much higher (E = 341 ± 102 kPa) than that of controls (E = 198 ± 50 kPa), whereas that of DVT carriers (E = 327 ± 85 kPa) was somewhat lower than the corresponding control one (E = 359 ± 61 kPa; Table 2).
In order to analyze the influence of the degree of platelets activation on their mechanical properties, platelets derived from healthy individual (noncarrier of PlA2 allele) were pretreated with ADP (Figure 4C). The ADP has been recognized for its contribution to the initiation and propagation of platelet activation at the sites of vascular injury and is secreted from platelet-dense granules and also from damaged erythrocytes and endothelial cells. 39
The preactivated platelets had irregular distribution of the Young’s modulus in the range 200 to 800 kPa, and on the average, they are 2 times stiffer (E = 415 ±140 kPa) than the nonactivated ones (E = 198 ± 50 kPa; Table 2). The histogram reveals several populations of cells arising from a multicomponent Gaussian fit of the data with maxima centered at 274 ± 15 kPa, 357 ± 27 kPa, 467 ± 30 kPa, and 574 ± 20 kPa, respectively. Very few of the cells are stiffer (Young’s modulus higher than 700 kPa), while another small portion of platelets has Young’s modulus of 225 ± 20 kPa, similar to patients with DVT noncarriers. Concerning the range of the Young’s moduli distribution, the profile of the preactivated healthy platelets resembles the ones of patients with DVT (Figure 4B and C). We suppose that the mechanism of ADP release from the platelets of patients with DVT is modified and that since activation occurs in a cascade mode, a release of additional ADP might lead to the activation of adjacent platelets to a greater extent.
Discussion
PlA1/A2 polymorphism is associated with conformational changes in the GPIIb/IIIa, which might exert an effect on the platelets’ nanomechanics, as well as on the signaling pathways by triggering thrombotic event, and thus might contribute to the DVT occurrence. It was shown by Floyd et al 27 that an expression of the PlA2 allele of glycoprotein IIIa has an impact on platelet function. In this work, we studied the platelet nanomechanics and compared the topology and Young’s modulus of platelets derived from healthy individuals and patients with DVT who either carry or not PlA2 allele in GPIIb/IIIa gene.
The roughness is one of the morphometric parameters closely related to the cell state. We found that the roughness and the height of platelets from patients with DVT, both carries and noncarriers of PlA2 allele, were reduced compared to the corresponding healthy controls, noncarriers of the polymorphism. The reason for this result might be the different activation stage of the platelets. In the case of healthy individuals, noncarriers of the polymorphism, only a few microparticles/granules are found in the area around the platelets. It can be suggested that the newly formed microparticles/granules remain clustered in the central part of the platelet (Figure 1A), contributing to the granular membrane surface and to the higher cells roughness and height. The platelets of healthy individuals, carriers of PlA2 allele, appear to be in more advanced stage of activation with partly released, smaller objects/particles observed around the platelets and partly unreleased particles bubbled on the cells surface (Figure 1D). On the contrary, the platelets from patients with DVT, carriers of PlA2 allele, are characterized by low-sized flat membranes, with no visible bubbles, but substantially larger (both in lateral dimensions and height) released microparticles. The processes of microparticle release and membrane remodeling possibly contribute to the changes in platelet’s bubbling and roughness. At the activation stage, besides membrane remodeling, GPIIb/IIIa complexes migrate from alpha granules’ membranes to the cellular membrane tightly covering its surface and making it more flat. The elevated level of GPIIb/IIIa receptors, in turn, is a prerequisite for higher susceptibility to clot formation.
The morphological features (shape and size) of numerous small objects released around the activated platelets (Figure 2), presumably representing microparticles, strongly depend on the carriage of the polymorphism. This is not surprising since it is well known that the elevated levels of microparticles were observed in thrombosis, heart failure (endothelial microparticles), tumor, and other diseases, 40 –43 and many groups reported that PMPs are promising prognostic markers for coagulation disorders due to their specific release during platelet activation. 44 –48 The formation of vesicles with various sizes might be a consequence of disconnection of heterogeneous in size membrane domains from the underlying skeleton. In many pathological states, platelet-derived microparticles are formed from activated platelets upon loss of cytoskeleton–membrane adhesion. 49 The reduced average roughness in patients with DVT can be attributed to the disruption of membrane–cytoskeleton linkage, leading to the release of vesicles with a larger dimension. Similar effect was observed upon oxidative damages and aging of erythrocytes. 50 Therefore, the alteration in the platelets’ roughness is mainly associated with the size of the detached particles and the activation stage.
One plausible explanation of the PMPs’ shape difference between the controls and patients with DVT would be the different origin and mechanism of their formation. The vesicles should carry the features of the membrane from which they were detached, thus the different quantity and spatial distribution of membrane proteins and lipids might have an impact on the vesicles shape in DVT and healthy cases. Recent study has shown that the detected microparticles in the bloodstream of healthy individuals originated from platelets activation and/or megakaryopoiesis. 51 However, to assess how DVT impacts the formation of PMPs, more in-depth studies and complementary methods are needed, which is a subject of our current investigations.
The values of the Young’s moduli recorded for healthy controls are much higher (>150 kPa) than that reported by Lee and Marchant (46.5, 29.7, and 6.2 kPa) 2 and Rheinlaender et al (46.6 kPa), 16 which could be attributed to the fact that the AFM measurements in this work were performed in air on platelets fixed with 1% glutaraldehyde, while in fluid in the abovementioned works.
There are controversial data regarding the Young’s moduli in thrombotic disease. 52,53 Similar to our results, significantly higher Young’s modulus was determined for patients with transient ischemic attack than for healthy individuals 53 ; however, in another study, a lower value of the Young’s modulus was found in patients with stroke and smokers. 52 Feasibly, this could be explained by methodological differences, namely, the extent of platelets activation during imaging, since the nanomechanical cell characteristics depend on the platelet state, as shown in an elegant study of Rheinlaender et al 16 detecting stiffening and softening periods of platelets during thrombin-induced activation. A presence of thrombophilic polymorphisms in the studied individuals that affect the platelets physical properties might be another probability. In this respect, an important finding in our study is that platelets derived from healthy individuals with PlA2 allele showed almost twice higher value of Young’s modulus (359 ± 61 kPa) than that of healthy individuals, noncarriers of the polymorphism (198 ± 50 kPa). Likewise, the Young’s modulus had also considerably higher value for DVT platelets, carriers and noncarriers, than that of healthy controls, noncarriers of the polymorphism.
The elevated membrane stiffness of platelets preactivated with ADP, their Young’s modulus value (415 ± 140 kPa) being close to that of platelets of carriers of PlA2 polymorphism, confirms that they are in a more advanced activation stage in agreement with our data obtained by flow cytometry (not shown). It is known that upon activation, platelets undergo a major cytoskeleton rearrangement; initially, the cell swells toward more spherical shape and then flattens forming filopodia extensions and lamellipodia. 54 Thus, the enhanced platelets stiffness of patients with DVT in our study could be explained by platelets cytoskeleton reorganization.
It is to be noted that the underlying cytoskeletal remodeling and the membrane elasticity of platelets upon activation due to interaction with the environment 55,56 are still poorly understood, because of the limited morphological and mechanical assessment of the dynamic function of platelets. The application of AFM techniques is expected to greatly improve our knowledge of the biological relevance of the changes in the nanomechanical properties of platelets in their different functional states.
Conclusion
In this work, we applied AFM to characterize quantitatively and qualitatively the mechanical properties and topography of platelets and to define the specific effect of the PlA1/A2 polymorphism on the platelets nanomechanics and state. We demonstrated that the degree of platelets stiffness, roughness, and height strongly depends on the carriage of prothrombotic PlA2 allele in the gene of GPIIb/IIIa of healthy individuals as well as of patients with DVT. The roughness and the height of the platelets isolated from patients with DVT were lower than those of the healthy patients, while at the stage of spreading, the degree of stiffness is much higher for DVT platelets compared to healthy ones. Platelet plasma membranes of healthy carriers of PlA2 allele were found to be twice stiffer than those of noncarriers.
Thus, our results clearly showed that the carriage of PlA2 allele leads to nanomechanical alteration in platelets; it is also associated with elevated platelet activation in both DVT and healthy carriers as compared to noncarriers. Our observations could have an implication for the understanding of the factors that drive hemostasis and thrombosis.
Footnotes
Authors’ Note
Svetla Todinova and Regina Komsa-Penkova contributed equally to this work.
Declaration of Conflicting Interests
The author(s) declared no potential conflicts of interest with respect to the research, authorship, and/or publication of this article.
Funding
The author(s) disclosed receipt of the following financial support for the research, authorship, and/or publication of this article: Financial support for this investigation was obtained from the Medical University, Pleven, Project N 20/2015 (Institutional Projects Funding).