
Abstract
A rapid and accurate diagnosis of venous thromboembolism (VTE) in the elderly individuals represents a dilemma due to nonspecific clinical presentation, confusing laboratory results, and the hazards of radiological examination in this age-group.
Introduction
Deep vein thrombosis (DVT) and its possible life-threatening consequence, pulmonary embolism (PE), are leading causes of preventable morbidity and mortality following the hospitalization of elderly people. 1 Accurate and timely diagnosis of venous thromboembolism (VTE) can be lifesaving especially in this age-group due to short-term mortality. 2 However, in bedridden elderly patients, the diagnosis of DVT may be challenging because of the high prevalence of asymptomatic cases. 3,4
Nowadays, the diagnostic workup for suspected VTE has evolved into an integrated approach that includes pretest probability (PTP) assessment and
A high proportion of elderly patients with a non-high clinical probability undergo unnecessary burdensome diagnostic investigations, in whom the yield of this imaging is relatively low. Hence,
Recently, many studies evaluated different approaches to improve the specificity of
The aim of our study was to assess different
Participants and Methods
This study was an observational retrospective study that was conducted from June 2013 till January 2014 in the Ain Shams University Specialized Hospital.
Inclusion Criteria
Age ≥65 years.
Hospital admission for acute medical illness other than VTE.
Life expectancy of at least 30 days.
Reduced mobility persisting for at least 7 days that was reported by either the attending physician or an informant.
Exclusion Criteria
Patient presenting with classical signs and symptoms of DVT or PE.
History of recent thromboembolism (up to 1 month).
Patients receiving oral anticoagulant therapy or low-molecular-weight heparin for any reason.
Any patient with the history of recurrent DVT.
All patients in our study were subjected to the following: Clinical assessment: for exclusion of any VTE signs and symptoms using the Wells scoring system, selecting those with non-high clinical probability. Laboratory assessment: quantitative determination of Radiological assessment: Doppler examination of both lower limbs by a general electric logiq 9 device performed with a real-time, B mode, linear-array sonographic scanner at 5.0 to 7.5 MHz. The entire proximal deep vein system was explored for compressibility.
Study Design
Patients were analyzed by 2 approaches: whole population (≥65 years) and age-stratified groups—first group 65 to 70 years, second group 71 to 80 years, and third group above 80 years.
The following cutoff values were applied: The “conventional” cutoff value for INNOVANCE The receiver operating characteristic (ROC)–derived cutoff value showing the best specificity, while preserving the 100% sensitivity. An “age-adjusted” cutoff (age in years × 10 µg/L) proposed by Douma et al.
21,22
On correlating the results of both Doppler ultrasound examination and Sensitivity, specificity, positive predictive value, negative predictive value, and accuracy. The proportion in which DVT could be excluded (based on an unlikely clinical probability and a negative The number of patients needed to undergo a
Statistical Analysis
Data were analyzed using Statistical Package for the Social Science (SPSS; version 15), a statistical software package for the Windows XP operating system of IBM-compatible personal computer. The χ2 test was used for comparison of qualitative data. Student t test was used for comparison of quantitative data. Receiver operating characteristic curves were prepared, and for each cutoff value, the area under the curve and the 95% confidence interval (CI) were calculated. We used the Wilson score method to compute the 95% CI for estimated proportions.
Results
Of a total 1123 patients older than 65 years who were admitted to the emergency department of Ain Shams University Specialized Hospital, 252 were serially included according to our inclusion and exclusion criteria (non-high PTP of VTE). Four hundred eight patients were not admitted to the hospital and left after the emergency department visit, 117 patients either refused our study or dropped out before completion of the desired tests, 100 patients were already on anticoagulation, 23 patients died after admission within 48 hours, 192 didn’t report any reduced mobility, 4 patients had previous recurrent DVT, 25 patients were presenting with signs and symptoms suggestive of DVT, and 2 patients’ radiological assessment wasn’t successful.
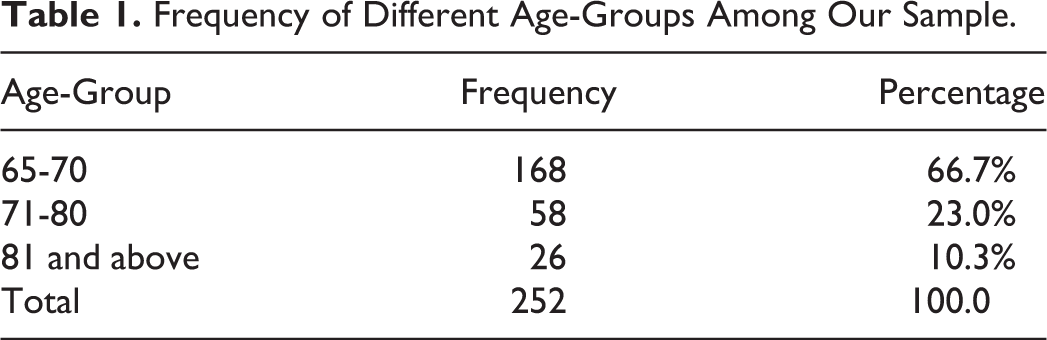
There were 127 (50.3%) males and 125 (49.6%) females with a male to female ratio of 1.01:1. Their ages ranged from 65 to 98 years with a mean of 73.3 years and standard deviation (SD) = 6.74. Frequency of different age-groups among our sample is shown in Table 1.
Frequency of Different Age-Groups Among Our Sample.
They were divided according to the cause of admission with infection as the main cause of admission, representing 23.8% of the total sample.
Pearson χ2 test was performed to determine the association between the cause of admission, presence and number of comorbidities, and the appearance of positive radiological findings. There was no statistically significant correlation between the medical grounds for admission and the prevalence of DVT (Table 2).
Different Causes of Admission in Relation With the Diagnosis of DVT.
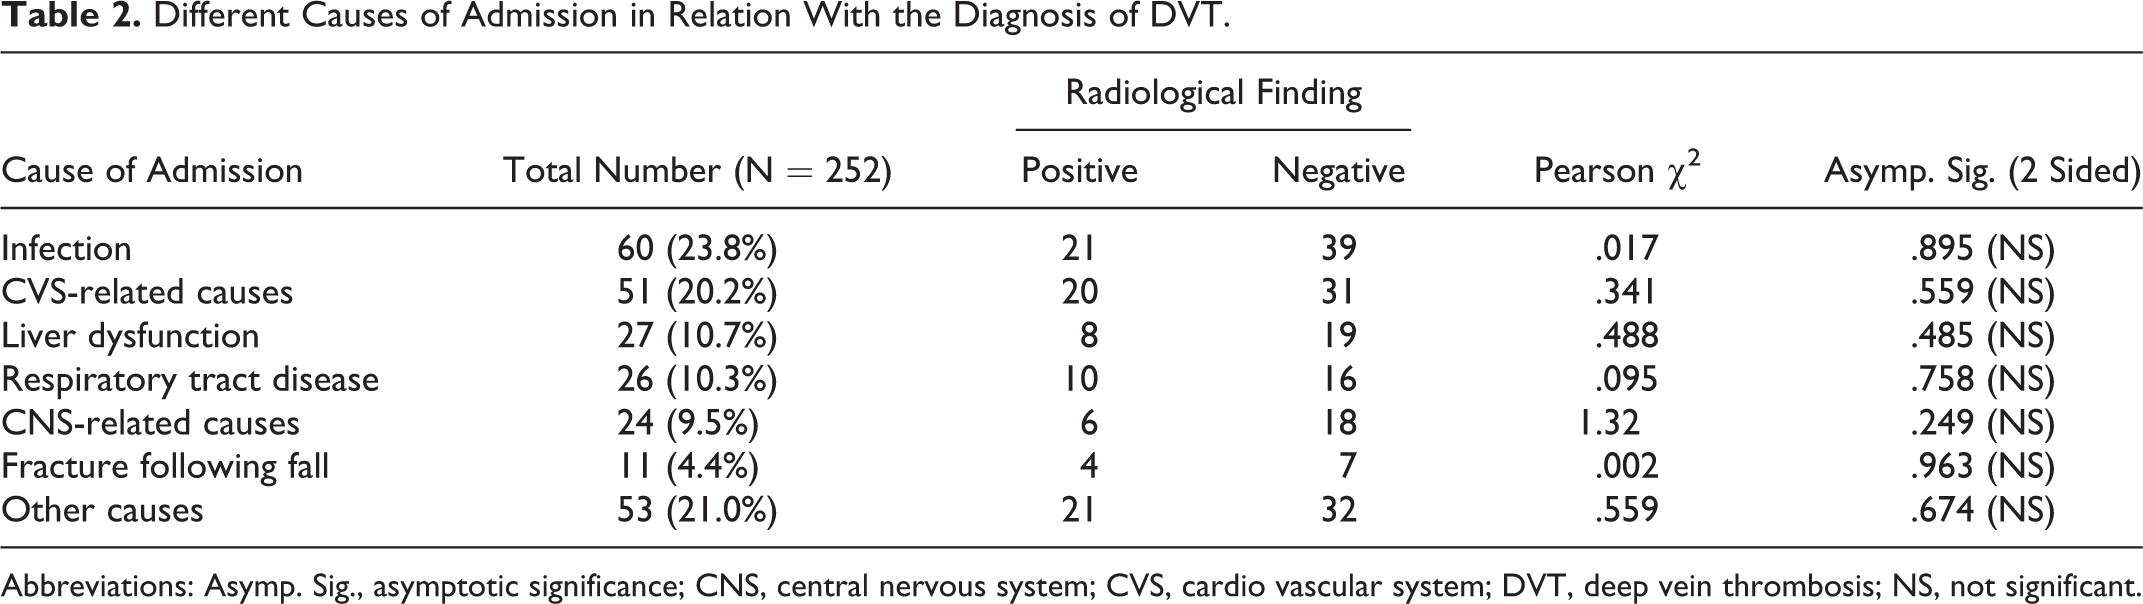
Abbreviations: Asymp. Sig., asymptotic significance; CNS, central nervous system; CVS, cardio vascular system; DVT, deep vein thrombosis; NS, not significant.
Laboratory and radiological results were collected from the patients’ charts in Ain Shams University Hospitals.
d -Dimer Results
For patients ages 65 to 70 years,
Radiological Data
Ninety (35.7%) of our participants showed compression changes in their lower limb by duplex sonography, diagnosed as having DVT with prevalence of 35.7% in the non-high PTP, whereas 162 (64.3%) showed normal patency and compressibility of blood vessels and normal blood flow inside it (proved to be free from DVT).
Patients who were found to have DVT by radiological examination had
Study of the Whole Sample Population
Table 3 shows that the best performance was for the age-adjusted cutoff in comparison with the conventional and ROC-derived cutoffs in the whole population.
Performance Criteria for Different Cutoffs in the Whole Population.
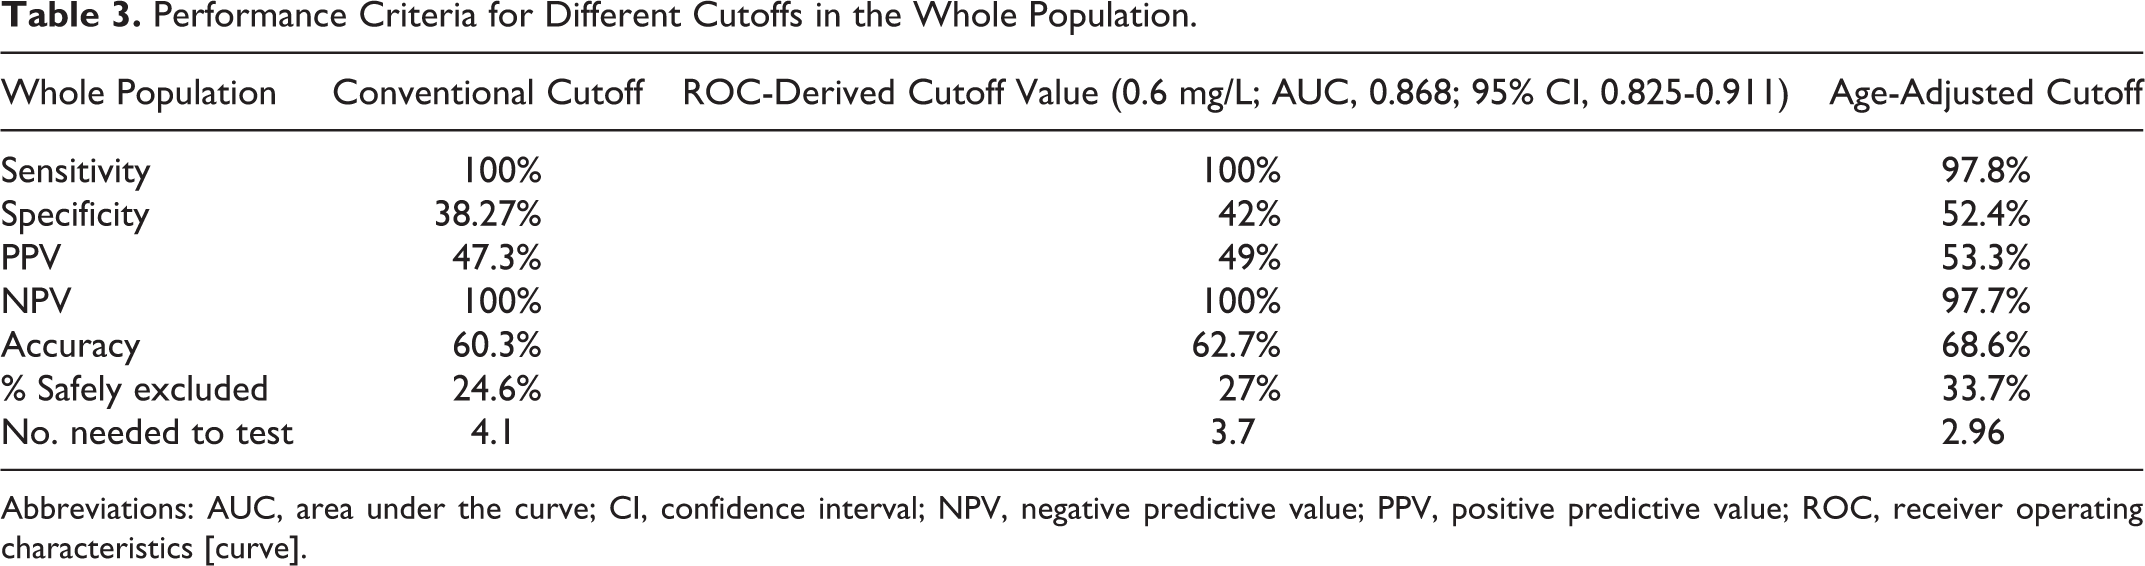
Abbreviations: AUC, area under the curve; CI, confidence interval; NPV, negative predictive value; PPV, positive predictive value; ROC, receiver operating characteristics [curve].
Study of Age-Specific Groups Revealed the Following Results
Table 4 shows that the age-adjusted cutoff achieved the best performance in the 65 to 70 age-group and with comparable performance to the ROC-derived cutoff in the 71 to 80 age-group, however, its sensitivity compromised in those older than 80 years in whom the conventional and ROC-derived cutoffs show comparable performance.
Performance Criteria for Different Cutoffs in the 3 Age-Groups.
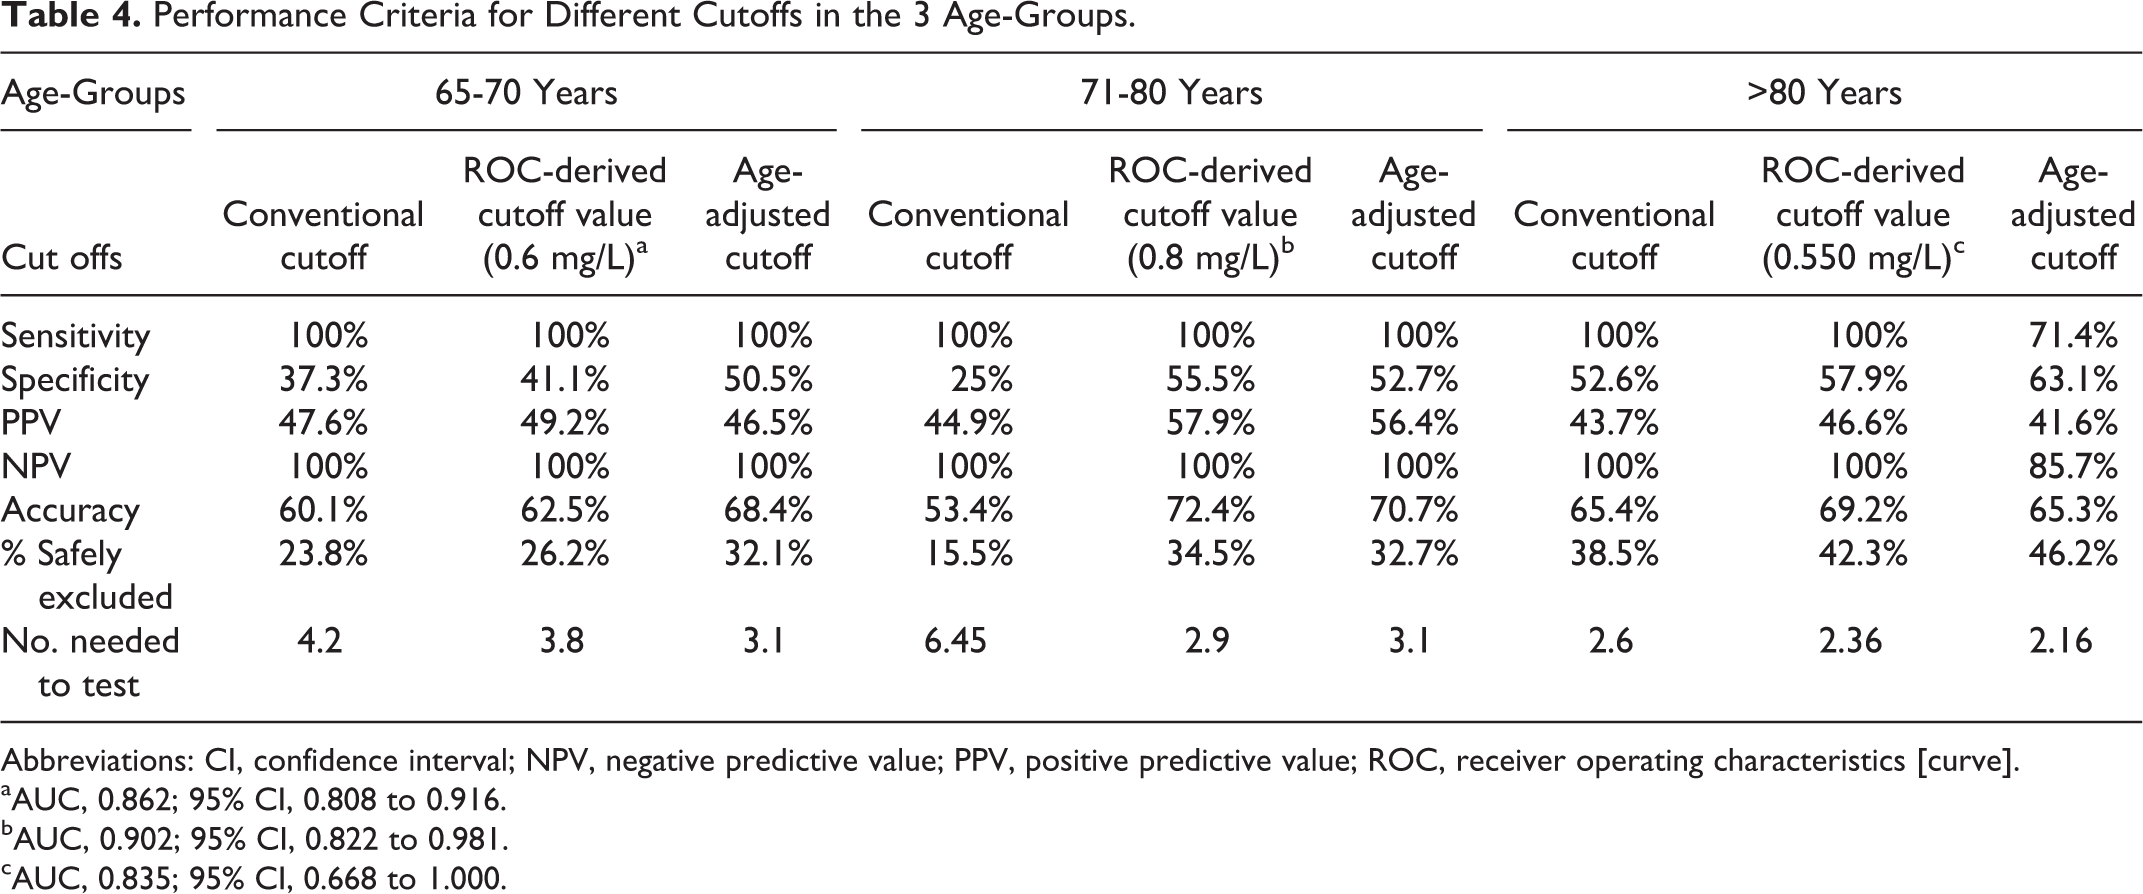
Abbreviations: CI, confidence interval; NPV, negative predictive value; PPV, positive predictive value; ROC, receiver operating characteristics [curve].
aAUC, 0.862; 95% CI, 0.808 to 0.916.
bAUC, 0.902; 95% CI, 0.822 to 0.981.
cAUC, 0.835; 95% CI, 0.668 to 1.000.
The pooled specificity of
The prevalence of DVT was comparable between groups, 36.3% (65-70 years), 37.9% (71-80 years), and 31.8% (>80 years), with the overall prevalence in the whole population being 35.7%
Discussion
In elderly patients, specificity of
Using the conventional cutoff for
The aim of the current study was to explore the reliability of 3 different
The current study was carried out on 252 bedridden hospitalized elderly patients with non-high PTP for VTE based on clinical decision rules applying Wells’ scoring system (≤2), with exclusion criteria, inclusion criteria, and study design similar to the studies by Granziera et al,
23
Cini et al,
24
Douma et al,
22
Harper et al,
9
and Schouten et al
8
as this is the indicated population for the application of
In our study, 252 patients were included with mean ages of 73.3 ± 6.74 years, showing infection as the main cause of admission with a frequency of 23.8% and prevalence of VTE as 35.7%, without significant correlation between any of medical grounds for admission and the prevalence of DVT. Similar, the study reported by Lippi et al 25 included 1647 patients with mean ages of 77 ± 15 years, showing the highest frequency for admission due to infection (15.6%) and prevalence of DVT (about 21.5%), and the study reported by Granziera et al 23 had a study population of 199 patients with mean age of 86.3 ± 6.7 years, showing 29.1% of patients were admitted due to infection and 12.5% due to the prevalence of DVT, and neither studies showed correlation between any medical grounds for admission and the prevalence of DVT.
Studying the Sample Population as a Whole
Performance of the conventional
The best performance was for the age-adjusted cutoff, showing the highest specificity of 52.4%, accuracy of 68.6%, percentage safely excluded of 33.7% with an absolute increase of 9.1% and 6.7%, and the least number of patients needed to be tested to exclude DVT in 1 patient (2.96) in comparison with the conventional cutoff and the ROC-derived cutoff (0.6 mg/L), respectively, while keeping the sensitivity at 97.8% due to the loss of 2 cases (2 false negatives) in those older than 80 years.
Similar to Han et al 26 who reported age-adjusted cutoff formula to give sensitivity of 95% and specificity of 84.1% for his non-high (low and moderate) PTP population, Cini et al 24 reported the age-adjusted cutoff formula to give sensitivity of 100% and specificity of 67.3% with an absolute increase in percentage safely excluded (24.1%) and reduced number needed to test from 2.8 to 1.7 for his whole population and Schouten et al 8 documented increased specificity from 42% to 47.8% and a decrease in the number of cases needed to test from 2.4 to 2.1 with an absolute increase in percentage of excluded cases (efficiency; 5.7%) when applied the age-adjusted cutoff formula.
In this study, the ROC-derived cutoff value showing the best specificity while preserving the 100% sensitivity was at 0.6 mg/L and gave specificity of 42%, which is lower than that reported by Haas et al 10 who suggested a cutoff value of 0.75 mg/L, which gives a sensitivity of 100% and a specificity of 49.2%. Harper et al 9 chose a point of 1.00 mg/L, improving the specificity to 55% and reported sensitivity of >98%, Granziera et al 23 suggested raising the cutoff value to 0.49 DDU mg/L (equivalent to 0.98 mg/L FEU), which increased the specificity from 20.1% to 39.1% while keeping the sensitivity as 100%, and Cini et al 24 suggested raising the cutoff value to 376 DDU ng/mL (equivalent to 752 ng/mL FEU), which increased specificity to 63.7% while keeping sensitivity as 100%, and the fixed cutoff (>750) adopted by Schouten et al 8 with specificity being improved from 42% to 47.4%.
Stratifying the Sample Population According to Age
Studying those aged 65 to 70 years
In the present study, performance of the conventional cutoff (0.5 mg/L) showed sensitivity above 99% and compromised specificity, which was close to other studies done on the similar age-group. 8,24,27
The best performance in this age-group was for the age-adjusted cutoff showing the highest specificity of 50.46%, accuracy of 68.4%, and proportion of safely excluded patients of 32.1% with an absolute increase of 8.3% and 5.9% in comparison with the conventional cutoff and the ROC-derived cutoff (0.6 mg/L), respectively, while preserving 100% sensitivity with the least number of patients needed to be tested to exclude DVT in 1 patient (3.1). This is very close to the results obtained by Schouten et al 27 who showed 97.3% sensitivity and 49.5% specificity, Schouten et al 8 who reported 98.5% sensitivity, 39.3% specificity, and number of cases needed to test 2.6, efficiency 6.5% for the similar age-group of 61 to 70 years, and Cini et al 24 who documented 100% sensitivity, 71.9% specificity, and number of cases needed to test 1.4. The number of cases excluded increased to 24.5% when applied the age-adjusted cutoff formula.
Analysis of the ROC curve revealed that the cutoff value showed the best specificity of 41.1%, while preserving 100% sensitivity at 0.6 mg/L with accuracy of 62.5%, percentage safely excluded of 26.2%, number needed to test as 3.8 in comparison with the study reported by Schouten et al 8 who adopted a fixed cutoff (>750 ng/mL) with a sensitivity of 98.5%, a specificity of 42.1%, number of cases needed to test as 2.4, and efficiency as 9.3% and the study by Cini et al 24 using the modified cutoff (376 ng/mL DDU) with 100% sensitivity for this age-group, 73.7% specificity number of cases needed to test to be 1.4, and the number of cases excluded increased to 26.3%.
Studying those aged 71 to 80 years
Both the ROC-derived cutoff (0.8 mg/L) and the age-adjusted cutoff values showed comparable specificities (55.5% and 52.7%, respectively), accuracies (72.4% and 70.7%), and proportions of safely excluded patients (34.5% and 32.7%), which are higher than those of the conventional cutoff specificity (25%), accuracy (53.4%), and proportion of safely excluded patients (15.5%) with an absolute increase of 17.5% using the age-adjusted cutoff and 19% using 0.8 mg/L cutoff than using conventional cutoff, while preserving 100% sensitivity with the least number of patients needed to be tested to exclude DVT in 1 patient, 2.9 and 3.1, respectively, versus 6.45 for the conventional cutoff.
In accordance with the study by Schouten et al, 8 comparable performance of both age-adjusted cutoff and their fixed cutoff for this age-group showed 100% sensitivity, 45% specificity, number of cases needed to test to be 2.2, and 14.4% efficiency for the former and 100% sensitivity, 45.9% specificity, number of cases needed to test to be 2.2, and 15.3% efficiency for the latter. Similarly, Cini et al 24 reported comparable performance of both age-adjusted cutoff and their modified cutoff with 100% sensitivity, 50% specificity, number of cases needed to test to be 2.0, and proportion of cases excluded increased to 29.3% for the former and 100% sensitivity, 48.8% specificity, number of cases needed to test to be 2.0, and proportion of cases excluded increased to 28.1% for the latter.
Also in a close proximity to Schouten et al, 27 results showed 97.3% sensitivity and 44.2% specificity for the age-adjusted formula.
Studying those aged 81 years and above
Both the ROC-derived cutoff (0.550 mg/L) and the conventional cutoff values showed comparable specificities (57.9% and 52.6%, respectively), accuracy (69.2% and 65.4%%), proportions of safely excluded patients (42.3% and 38.5%), and number of cases needed to test (2.36 and 2.6), while preserving 100% sensitivity. The age-adjusted cutoff did show an increase in specificity (63.16%) however at the expense of sensitivity (71.4%), making the age-adjusted formula not suitable to replace conventional cutoff (0.5 mg/L).
Similar studies 8,24,27 showed the age-adjusted cutoff to have the best performance in this age-group. However, our findings should be cautiously interpreted due to the small number of patients >80 years (n = 26) in comparison with the large cohort of patients in the study by Schouten et al 27 (n = 1269), Schouten et al 8 (n = 62), and Cini et al 24 (n = 57).
In conclusion, in bedridden hospitalized elderly patients (65-80 years), combining the clinical probability for VTE with an age-adjusted formula
21
for the interpretation of
Footnotes
Declaration of Conflicting Interests
The author(s) declared no potential conflicts of interest with respect to the research, authorship, and/or publication of this article.
Funding
The author(s) received no financial support for the research, authorship, and/or publication of this article.