
Abstract
Heparin is a widely used clinical anticoagulant. It is also a linear glycosaminoglycan with an average mass between 10 and 20 kDa and is primarily made up of trisulfated disaccharides comprised of 1,4-linked iduronic acid and glucosamine residues containing some glucuronic acid residues. Heparin is biosynthesized in the Golgi of mast cells commonly found in the liver, intestines, and lungs. Pharmaceutical heparin currently used in the United States is primarily extracted from porcine intestines. Other sources of heparin including bovine intestine and bovine lung are being examined as potential substitutes for porcine intestinal heparin. These additional sources are intended to serve to diversify the heparin supply, making this lifesaving drug more secure. The current study examines bovine heparins prepared from both intestines and lung and compares these to porcine intestinal heparin. The structural properties of these heparins are examined using nuclear magnetic resonance, gel permeation chromatography, and disaccharide analysis of heparinase-catalyzed depolymerized heparin. The in vitro functional activities of these heparins have also been determined. The goal of this study is to establish the structural and functional similarities and potential differences between bovine and porcine heparins. Porcine and bovine heparins have structural and compositional similarities and differences.
Introduction
Heparin is a glycosaminoglycan obtained from animal tissues that is widely used as a clinical anticoagulant. 1 Heparin is composed of disaccharide repeating units, including a major repeating unit that is trisulfated, (→4) α-L-IdoA2S (1 → 4) α-D-GlcNS6S (1→), where IdoA is iduronic acid, GlcN is glucosamine, and S is sulfo. Heparin contains lesser amounts of glucuronic acid (GlcA) and N-acetyl glucosamine (GlcNAc) residues having varying numbers of O-sulfo groups. Pentasaccharide sequences within heparins, having a central 3-O-sulfo group-containing GlcN residue, are the primary structures responsible for heparin binding to antithrombin (AT), resulting in inhibition of blood coagulation.
The reliance on a single species, the pig, and past contamination issues arising in the Chinese production of heparin has put the supply of this critical drug under stress. 2,3 This vulnerability of heparin could result from a disease in pigs or an unreliable foreign supply chain destabilizing the heparin market. Recently, the reintroduction of bovine heparins to the US market has come under consideration. 3 By understanding the structure, composition, and activity of heparins from various animal sources, potential substitutes for porcine intestinal (PI) heparin might be identified. 4 –7 This would broaden the potential sources of heparin, increase the supply of heparin for use in developing countries, and stabilize the market against disruption due to disease or product contamination.
The literature suggests that there are distinct differences in the structure, saccharide composition, polydispersity, and AT-binding affinity of heparins from different animal sources. 4,5,8,9 Determining these differences can lead to a better understanding of the limitations of current heparin and to a more tailored design of low-molecular-weight (LMW) heparins. Although previous studies have compared heparin from different heparin sources, 4,8,10 this study relies on modern analytical techniques to examine multiple samples of heparin from different species and tissues, providing a set of statistically significant differences in properties. The data obtained on PI, bovine lung (BL), and bovine intestinal (BI) heparins will provide a template that will be useful in identifying the source of a given heparin and in determining whether heparin from multiple tissue or species sources has been mixed or adulterated. This information should also help regulatory authorities decide whether to adopt new heparin sources.
Methods
Porcine intestinal heparins used in this study were recently prepared active pharmaceutical ingredient (API) obtained from Celsus Laboratories (Cincinnati, Ohio) and Scientific Protein Laboratories (Madison, Wisconsin) complying with the current United States Pharmacopeia (USP), 11 and their activities were determined by their manufacturers. Bovine lung heparins were historic samples obtained from a variety of past manufacturers. Bovine intestinal heparins were obtained from Extrasul (Sao Paulo, Brazil). For a listing of lot numbers and activities, see Table S1.
Molecular Weight Analysis
Molecular weights were measured by gel permeation chromatography (GPC), in accordance with the USP 37 heparin monograph method, 11 with nonessential minor modifications. A guard column TSK SWXL 6 mm × 4 cm, 7 μm diameter was used (for some samples only) in series with 2 analytical columns: TSK G4000 SWXL 7.8 mm × 30 cm, 8 μm in series with TSK G3000 SWXL 7.8 mm × 30 cm, 5 μm (Tosoh Corporation, Tokyo, Japan). These columns were connected to a high-pressure liquid chromatography (HPLC) system consisting of Shimadzu LC-10Ai pump, a Shimadzu CBM-20A controller, and a Shimadzu RID-10A refractive index detector (RID; Shimadzu, Kyoto, Japan). Columns and RID were maintained at 30°C using Eppendorf column heater (Eppendorf, Hamburg, Germany). The mobile phase was 0.1 mol/L ammonium acetate with 0.02% sodium azide. The flow rate was 0.5 or 0.6 mL/min (in order not to exceed column pressure limits). A sample injection volume was 20 μL (sample concentration was approximately 5 mg/mL). The GPC chromatograms were recorded with the LCsolution version 1.25 software (Shimadzu) and analyzed with its “GPC Postrun” function. For molecular weight determination, USP Heparin Sodium Molecular Weight Calibrant reference standard (RS) was used as a calibrant and USP Heparin Sodium Identification RS (USP, Maryland) was used to confirm system suitability. All the data were passed system suitability requirements stated in the USP monograph. 11 For calculation, a third-order polynomial equation was used. The definitions of molecular weight parameters are below.
The weight-average molecular weight (MW) is calculated by
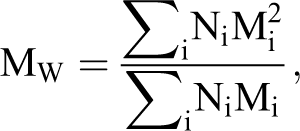
where Ni is the number of molecules of molecular weight Mi. M24000 is a percentage of heparin chains with molecular weight greater than 24 000 Da. M8000-16000/M16000-24000 is a ratio of the percentage of heparin with molecular weight in the range 8000 to 16 000 Da to the percentage of heparin with molecular weight in the range 16 000 to 24 000 Da.
Nuclear Magnetic Resonance Analysis
Nuclear magnetic resonance (NMR) analyses were performed on a Bruker Avance II 600 MHz spectrometer (Bruker BioSpin, Billerica, Massachusetts) with TopSpin 2.1.6 software (Bruker). Samples were prepared by dissolving approximately 20 mg of heparin in 99.96% D2O and lyophilizing the sample to remove exchangeable hydrogen from the backbone of the structure. This was repeated to ensure that the deuterium exchange was complete. The sample was then redissolved in 0.5 mL of 99.996% D2O to minimize the HOD peak in the NMR spectrum. Some samples will be purified beforehand using a 10K spin column eluted with water or an H+ Amberlite cation exchange column eluted with water, and the collected eluent neutralized with sodium bicarbonate. The conditions for 1-dimensional (1D) 1H-NMR spectra were as previously reported. 12 Briefly, a wobble sweep width of 12.3 kHz, acquisition time of 2.66 seconds, and relaxation delay of 8.00 seconds were used. Temperature was 298 K. The conditions for 2-dimensional (2D) heteronuclear single-quantum coherence (HSQC) spectra were as follows: 32 scans, sweep width of 6.15 kHz, acquisition time of 0.33 seconds, and relaxation delay of 0.90 seconds.
Disaccharide Analysis
High-pressure liquid chromatography–ultraviolet (UV) spectrometry was used to analyze the disaccharide composition. The high-pressure liquid chromatography-ultraviolet (HPLC-UV) analyses were performed on an Agilent 1200 LC instrument (Agilent Technologies, Wilmington, Delaware) equipped with a binary pump followed by a UV detector equipped with a high-pressure cell. The column used was a Poroshell 120 C18 column (2.1 × 100 mm2, 2.7 μm; Agilent). Eluent A was water–acetonitrile (85:15, vol/vol), and eluent B was water–acetonitrile (35:65, vol/vol). Both eluents contained 12 mmol/L tributylamine and 38 mmol/L ammonium acetate with pH adjusted to 6.5 with acetic acid.
Disaccharide samples were prepared by adding 10 μL of (10 mU each) heparinase I, II, and III to 10 μL of 1 mg/mL heparin and 100 μL of deionized H2O. After incubating the samples in a 35°C water bath for about 6 hours, an additional 5 μL of heparinase I, II, and III was added to the solution to ensure the digestion of the sample. Tetrasaccharide samples were prepared by adding 20 μL of (10 mU) heparinase II to 100 μL of 1.0 mg/mL heparin and 100 μL of H2O. After incubating the samples in a 35°C water bath for about 6 hours, an additional 10 µL of heparinase II was added to the sample. The disaccharide and tetrasaccharide samples were boiled and then centrifuged to remove the heparinase enzymes; the supernatant was collected and freeze dried. The disaccharide and tetrasaccharide samples were then redissolved in deionized H2O to a final concentration of 0.25 and 5.0 μg/μL, respectively.
Liquid chromatography–mass spectrometry was used to analyze the disaccharide and tetrasaccharide composition. An Acquity UPLC BEH C18 column (2.1 × 150 mm, 1.7 μm, column temperature 30°C; Waters [Waters Corporation, Milford, MA]) was used. 12,13 Mobile phase A was water, and mobile phase B was water:acetonitrile (25:75); both mobile phases contained 15 mmol/L of pentylamine (PTA) or hexylamine (HXA; ion-pairing reagents) and 50 mmol/L of 1,1,1,3,3,3-hexafluoro-2-propanol (buffering agent) with a flow rate 0.25 mL/min. Electrospray ionization mass spectra were obtained using a Xevo QTof MS (Waters). The electrospray interface was set in positive ion mode with a capillary voltage of 2000 V and a sampling cone voltage of 20 V. The source and the desolvation temperatures were 120°C and 400°C, respectively. Nitrogen was used as desolvation (750 L/min) and cone gas (25 L/min). The mass range was 200 to 2000 Da (scan rate 0.5 seconds). Under these conditions, molecular ion peaks were adducts of the ion-pairing agent (PTA or HXA).
Disaccharide standards were purchased from Iduron (Manchester, United Kingdom). The weight/weight (wt/wt) percentage for each disaccharide was calculated, and the sum being related to all the 8 disaccharides. Peak areas were used for quantification.
Activity Analysis
The BL and BI heparins were supplemented in pooled normal human plasma and tested in a concentration range of 0 to 10 μg/mL. The clot-based activated partial thromboplastin time (aPTT) was performed on the ACL 300 Plus kinetic coagulation analyzer (Instrumentation Laboratory, Lexington, Massachusetts) using the Triniclot S aPTT reagent (Diagnostica Stago, Parsippany, New Jersey). The amidolytic anti-IIa and anti-Xa assays were run as the following. For BI1-6 samples, BIOPHEN Heparin Anti-IIa (or Anti-Xa) kit (ANIARA Diagnostica, West Chester, Ohio) was used in accordance with the manufacturer’s instructions. The absorbance was measured at 405 nm using Spectra Max M5 (Molecular Devices, Sunnyvale, California). For all the other samples, bovine Xa and human thrombin were purchased from Enzyme Research Laboratories (South Bend, Indiana), and chromogenic substrates, Spectrozyme Xa and TH, were obtained from Sekisui Diagnostics (Stamford, Connecticut). The assay was run by ACL ELITE (Instrumentation Laboratory). As a standard for all of the samples, USP Heparin Sodium for Assays RS (The United States Pharmacopeial Convention, Inc, Maryland) was used (Lot #: F0I187). This USP RS has an assigned potency of 2144 USP U/ampule. The potency of each of the heparins was calculated based on the calibration curve prepared with the USP RS.
Results
The molecular weight properties of BI samples were nearly equivalent to current USP heparin, which is derived from PI mucosa (Table 1). The GPC chromatograms of representative BI and BL heparins are shown with USP Heparin Sodium Identification RS (from PI mucosa) in Figure S1. Five of the 6 BI heparins met USP specifications for molecular weight, and the remaining BI heparin sample fell slightly below the specifications (Table 1). In contrast, all 5 BL heparins showed a lower molecular weight than the BI and PI heparins (Table 1) and exhibited molecular weight properties falling outside the USP specifications. The BL heparin having the lowest molecular weight, MW of 9100, while considerably lower than the range required for USP PI heparin, Mw 15 000 to 19 000, was still significantly higher than the LMW heparin, enoxaparin, MW 3800 to 5000. 14
Molecular Weight Properties of Bovine Intestinal Mucosa Heparin and Bovine Lung Heparin.
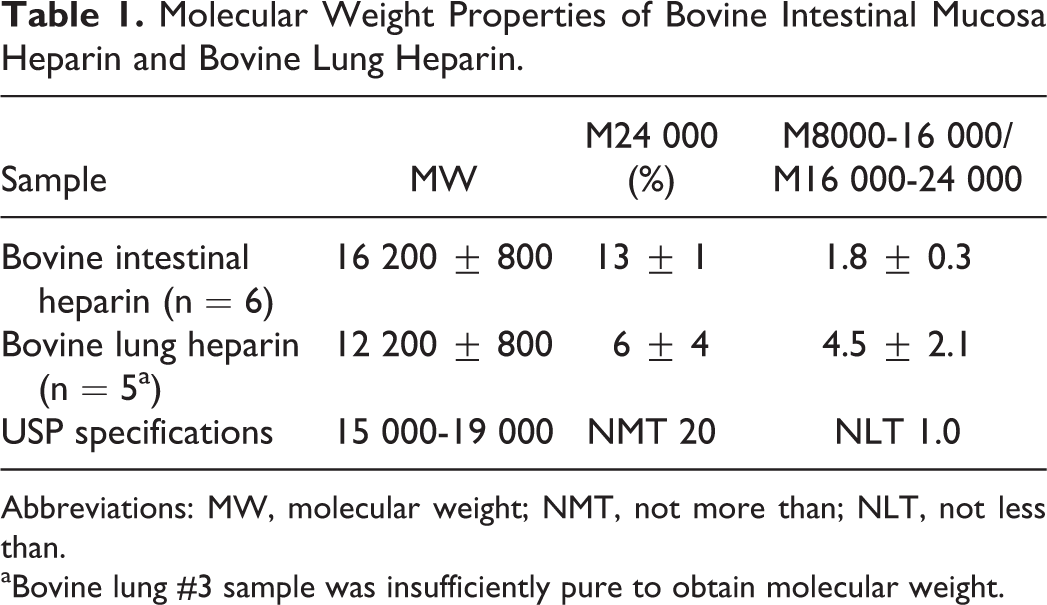
Abbreviations: MW, molecular weight; NMT, not more than; NLT, not less than.
aBovine lung #3 sample was insufficiently pure to obtain molecular weight.
The chemical structures of the intact BL, PI, and BI heparins were next examined using 1D 1H NMR spectroscopy, and representative spectra are shown in Figure 1A. Although all 3 heparins showed similar 1H spectra, some distinct differences were observed. The BI heparins showed the presence of additional anomeric signals between C (5.34 ppm) and D (5.15 ppm) assignable to the H1 of GlcNS (5.23) and to the H1 of IdoA2S with a GlcNAc or GlcNS residue linked at its reducing end (5.18 ppm). In addition, only a weak signal for E (4.93 ppm) was observed in BI heparins, suggesting a very low IdoA content. The intensity of the signal at 3.78 ppm shows that BI heparin has a large content of glucosamine without a 6-O-sulfo group. Finally, the intensity of signal S (1.95 ppm), corresponding to the CH3 of GlcNAc, was extremely low in BL heparins.
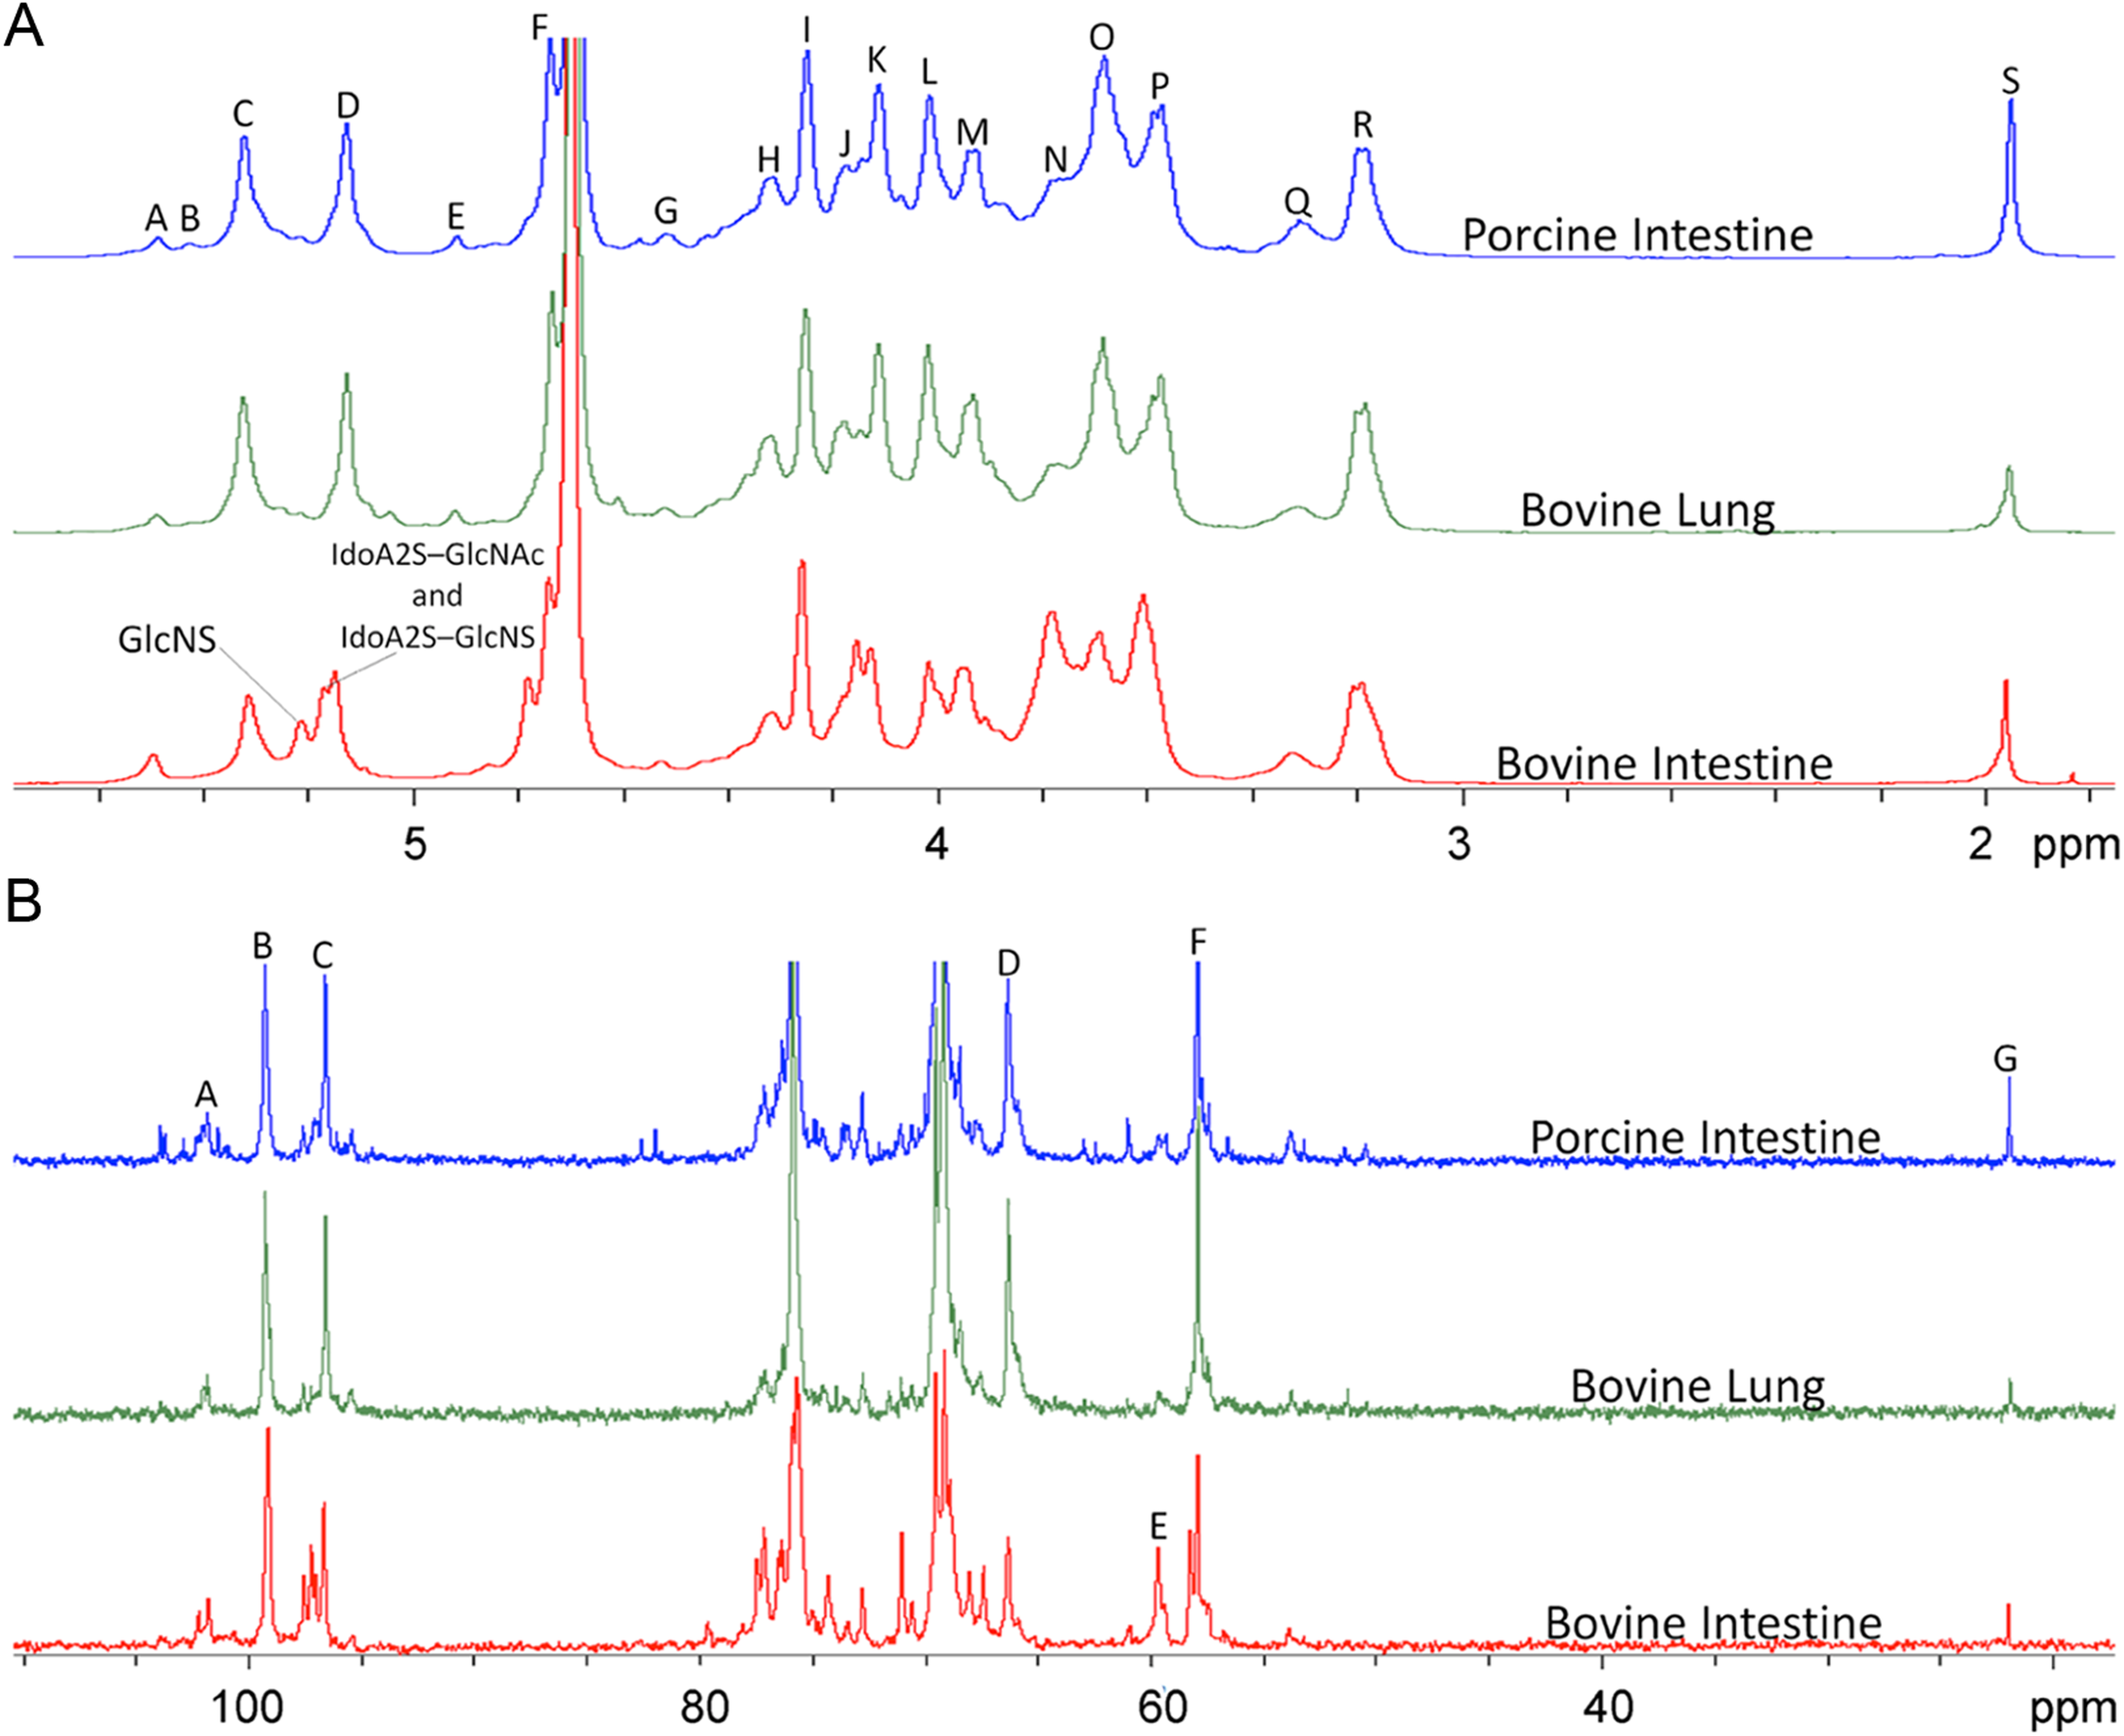
One-dimensional (1D) nuclear magnetic resonance (NMR) of bovine and porcine heparin. A, Comparison of the 1H-NMR spectra of heparin prepared from bovine intestine BI2 (red), bovine lung BL1 (green), and porcine intestine PIS1 (blue). Peak/ppm/assignment/residue: A/5.51/H1/GlcNS6S; B/5.38/H1/GlcNY3S6X; C/5.34/GlcNY6S (where Y = Ac or S and X = H or S); D/5.15/H1/IdoA2S; E/4.93/H1/IdoA; F/4.67/H5/ IdoA; G/4.53/H1/GlcA; H/4.34/H6/GlcNY6S; I/4.26/H2/IdoA; J/4.19/H6/GlcNY6S; K/4.13/H3/IdoA; L/4.03/H4/IdoA; M/3.94/H5/GlcNY6S; N/3.78/H6/GlcNY; O/3.71/H4/GlcNY6S; P/3.58/H3/GlcA; Q/3.32/H2/GlcA, GlcNY3S6X; R/3.20/H2/GlcNS6X; S/1.95/CH3/GlcNAc. B, Comparison of the 13C-NMR spectra of heparin prepared from bovine intestine BI2 (red), bovine lung BL1 (green), and porcine intestine PIS1 (blue). Peak/ppm/assignment/residue: A/101.97/C1/GlcA and IdoA; B/99.39/C1/IdoA2S; C/96.70/C1/GlcNY6S; D/66.37/C6/GlcNY6S; E/61.10/C6/GlcNY; F/57.91/C2/GlcNS6X; G/22.00/CH3/GlcNAc. See Table S1 for details on the heparins used in Figure 1.
The 1D 13C spectra were examined for each of the heparins, and representative spectra are shown in Figure 1B. The BI heparins showed a relatively weak C6 signal (peak D at 66.37 ppm), corresponding to GlcNY6S, with a much stronger C6 signal for GlcNY (peak E at 61.10 ppm), consistent with very low 6-O-sulfo group content. The BI heparins also showed a greater number of peaks in its 13C spectrum than did BL or PI heparins. The BL heparins showed the lowest level of I-acetyl content as indicated by the weak signal at 22.00 ppm.
The overlay of the 2D HSQC spectrum for a representative PI heparin with BL and BI heparin is shown in Figure 2A and B. Although the spectral properties are similar, some differences are clearly evident. For example, cross-peaks observed at 4.8-68, 4.25-75, 3.65-77, 3.7-59 are much broader in BI heparins than in either PI or BL heparins, confirming the higher structural variability of BI heparins. This variability is attributable to the higher content of glucosamine residues without 6-O-sulfo groups present in BI heparins.
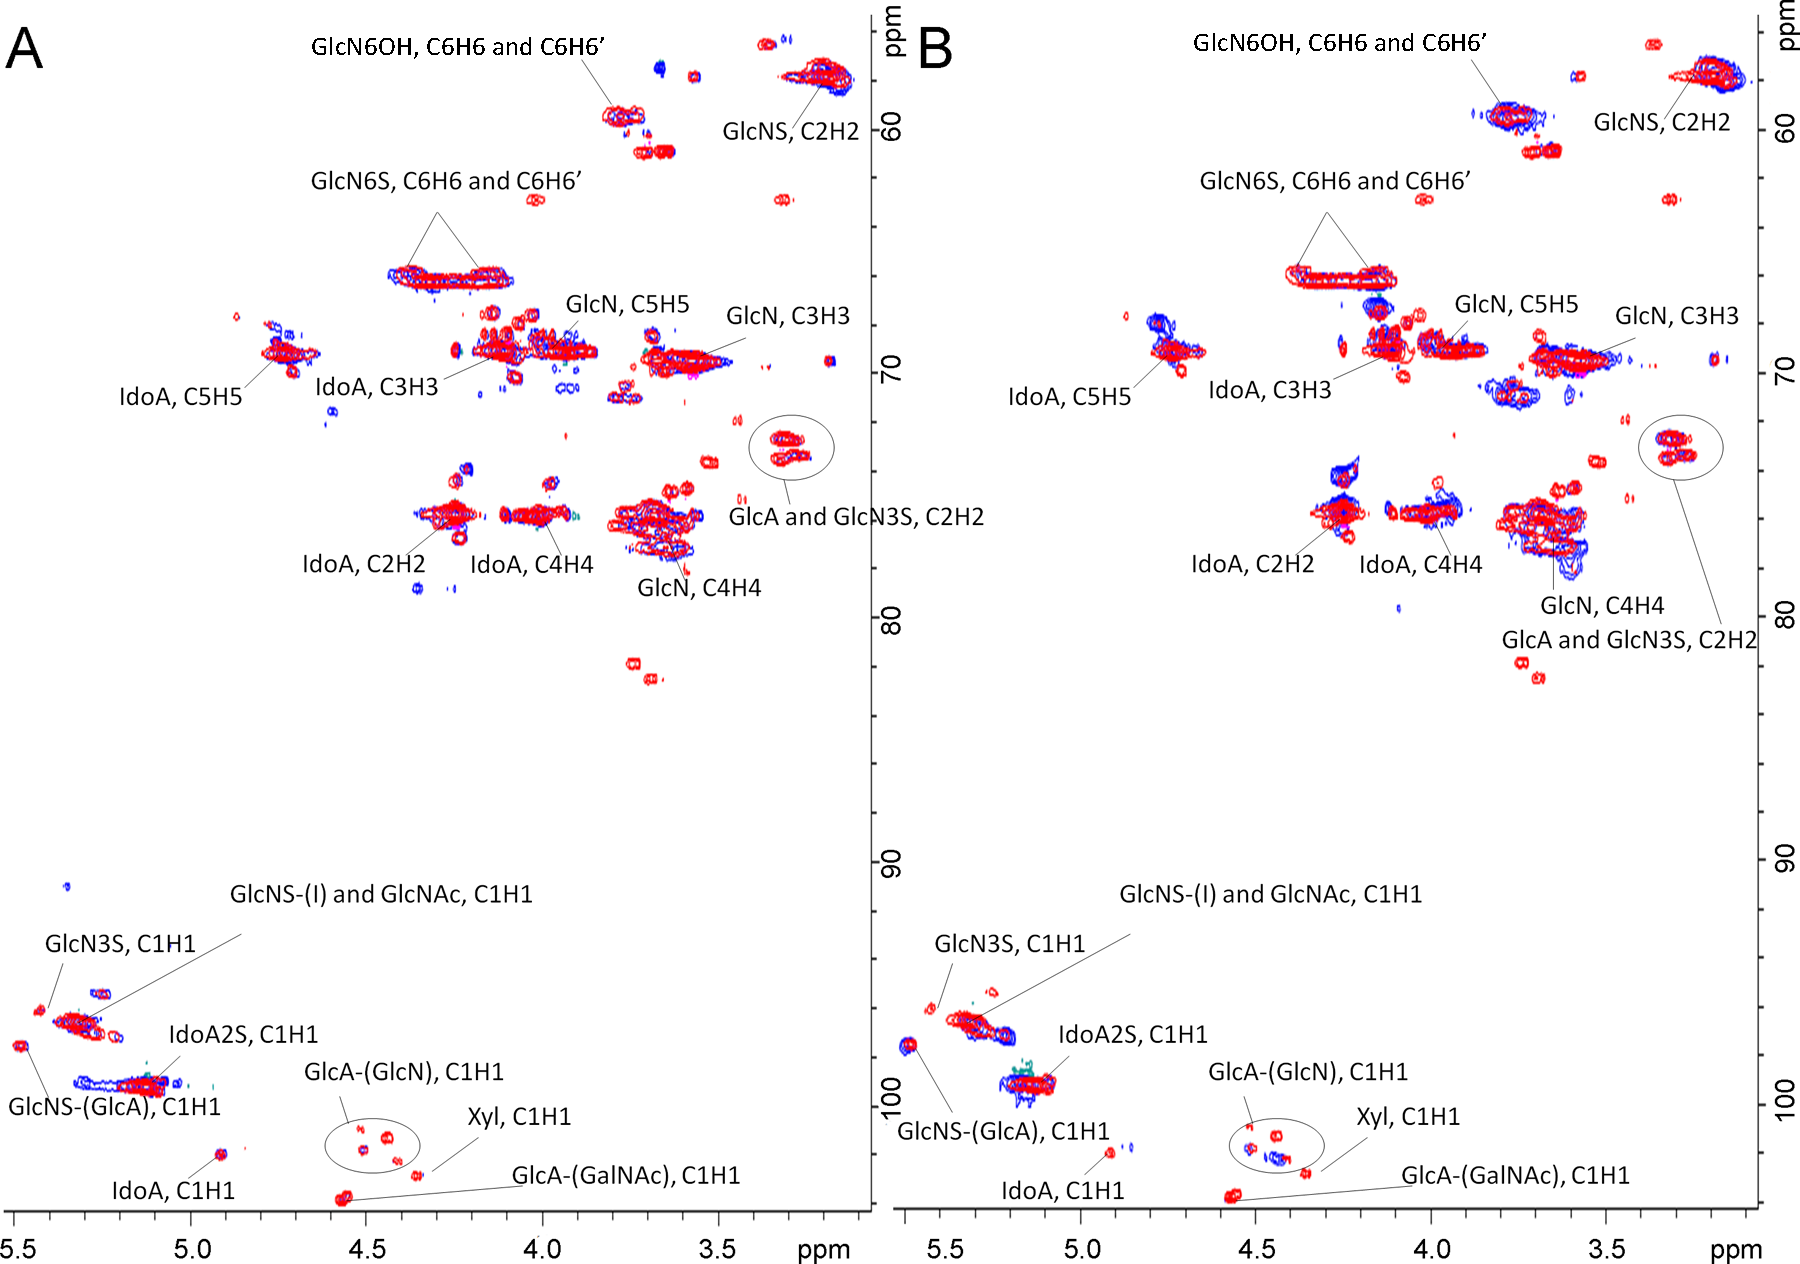
Two-dimensional (2D) nuclear magnetic resonance (NMR) of bovine and porcine heparins. A, An heteronuclear single-quantum coherence (HSQC) overlay of porcine intestine PIS1 (red) and bovine lung BL1 (blue). B, An HSQC overlay of porcine intestine PIS1 (red) and bovine intestine BI2 (blue). See Table S1 for details on the heparins used in Figure 2.
Based on our NMR spectroscopy experiments, the compositional analysis of PI, BL, and BI heparins was determined (Figure 3). Of particular interest are the differences in the content of 3-O-sulfo groups between these heparin samples, as this moiety is found primarily in the AT pentasaccharide-binding site responsible for heparin’s anticoagulant activity. The PI heparins showed the greatest of 3-O-sulfo group content, followed by BL heparins, with BI heparin having the lowest content. Another important aspect of this analysis is that it provides structural information on the ratio of IdoA2X (corresponding to IdoA and IdoA2S) to GlcA. Interestingly, BL heparins show the highest IdoA2X–GlcA ratios with PI and BI heparins, showing significantly lower and comparable IdoA2X–GlcA ratios.
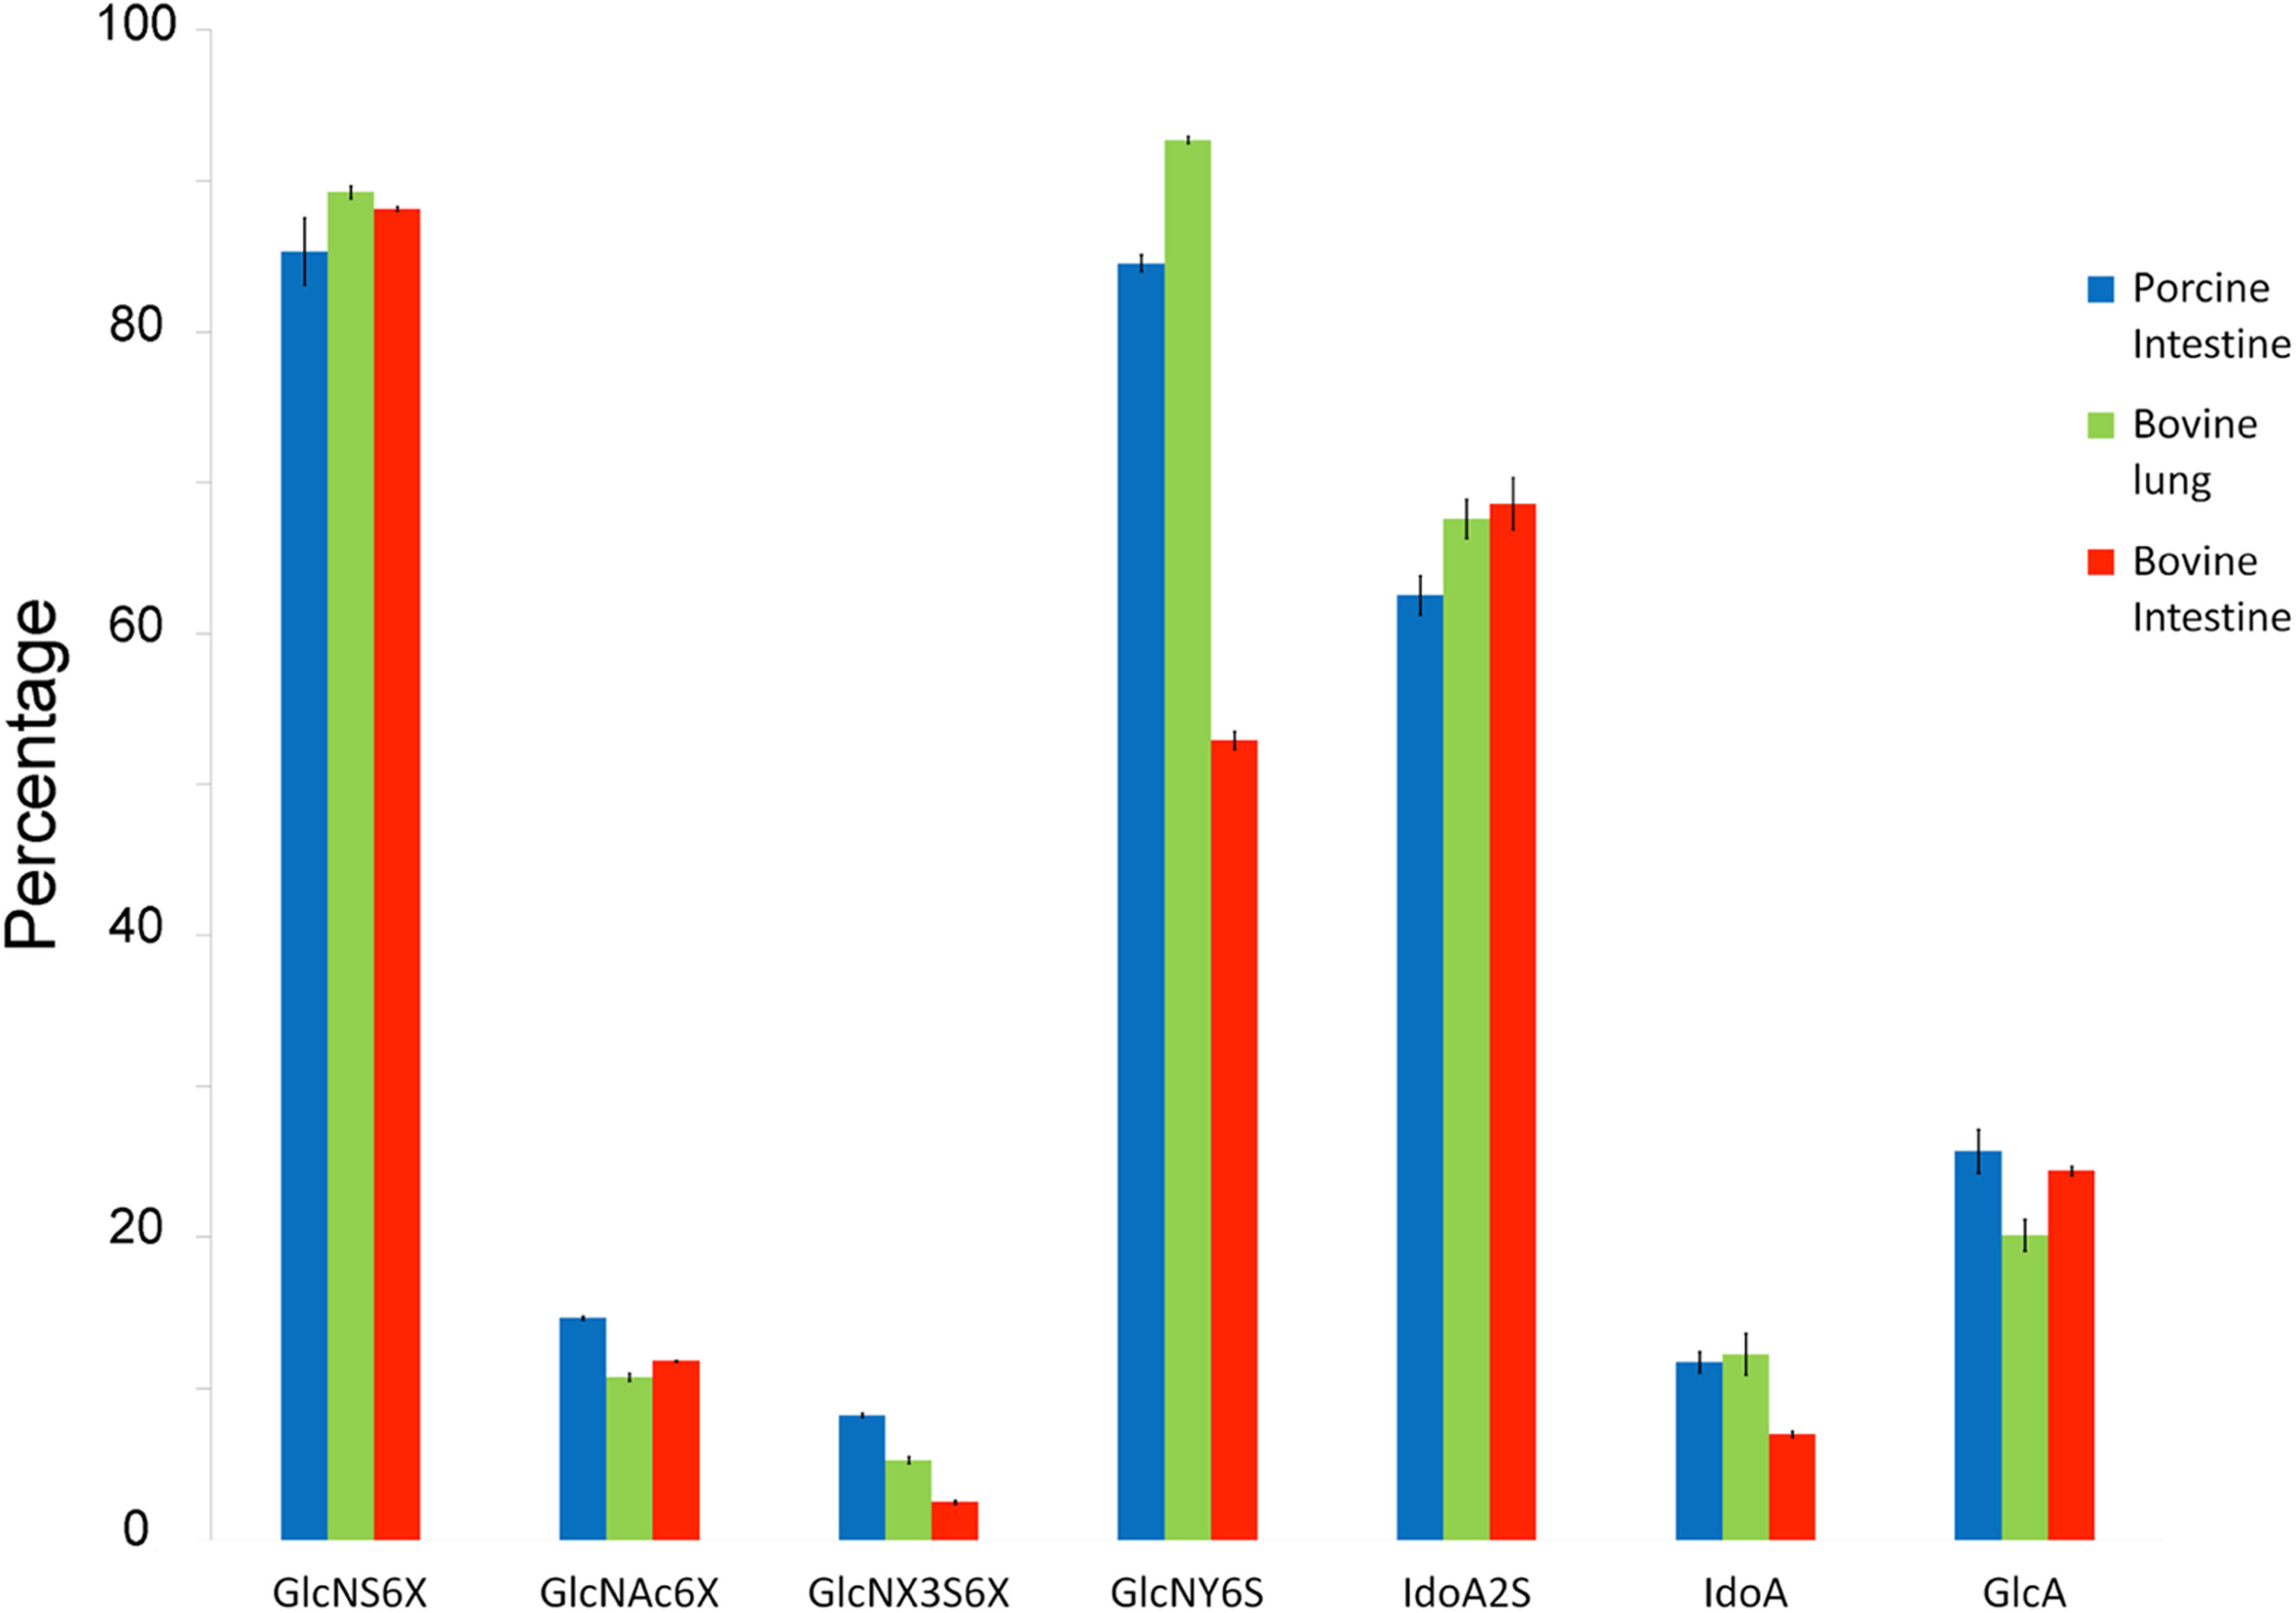
Composition of bovine intestinal BI2 (red), bovine lung BL1 (green), and porcine intestinal heparin PIS1 (blue) determined by NMR integration of NMR peaks. The GlcNS integral (3.26-3.10 ppm), the GlcNAc6X integral (1.82-2.07 ppm), the GlcN3S6X integral (5.47-5.41 ppm), the GlcNY6S integral (66.72-65.60 ppm and 61.26-60.57 ppm), the IdoA2S integral (5.21-5.01 ppm), the IdoA integral (4.97-4.90 ppm), and the GlcA integral (3.27-3.41 ppm). The error bar shows the standard deviation over the integration of the same sample 4 times. See Table S1 for details on the heparins used in Figure 3.
Disaccharide compositional analysis was next undertaken on each of the heparin samples. The results of these analyses are shown in Figure 4, Table S3, and Figure S2, measured by liquid chromatography (LC)-ultraviolet (UV)/mass spectroscopy (MS) and LC-UV, respectively. In Figure 4, the disaccharide composition of 3 different PI heparins obtained from 2 manufacturers shows virtually no difference. The TriS (ΔUA2S-GlcNS6S, where ΔUA is 4-deoxy-α-L-threo-hex-4-enopyranosyluronic acid) corresponds to the major disaccharide repeating unit within heparin. The TriS content of the PI heparins was very similar at 67 to 69 wt/wt%. The BL heparins showed the greatest structural diversity when compared to one another. The TriS content of BL heparin was quite high ranging from 70 to 87 wt/wt. The BI heparins were also quite variable. The TriS content of BI heparins was quite low at 51 to 56 wt/wt%, and these BI heparins showed considerable amount of NS2S (ΔUA2S-GlcNS) content, 15 to 32 wt/wt%. This is consistent with the low content of 6-O-sulfo groups observed by NMR spectroscopy.
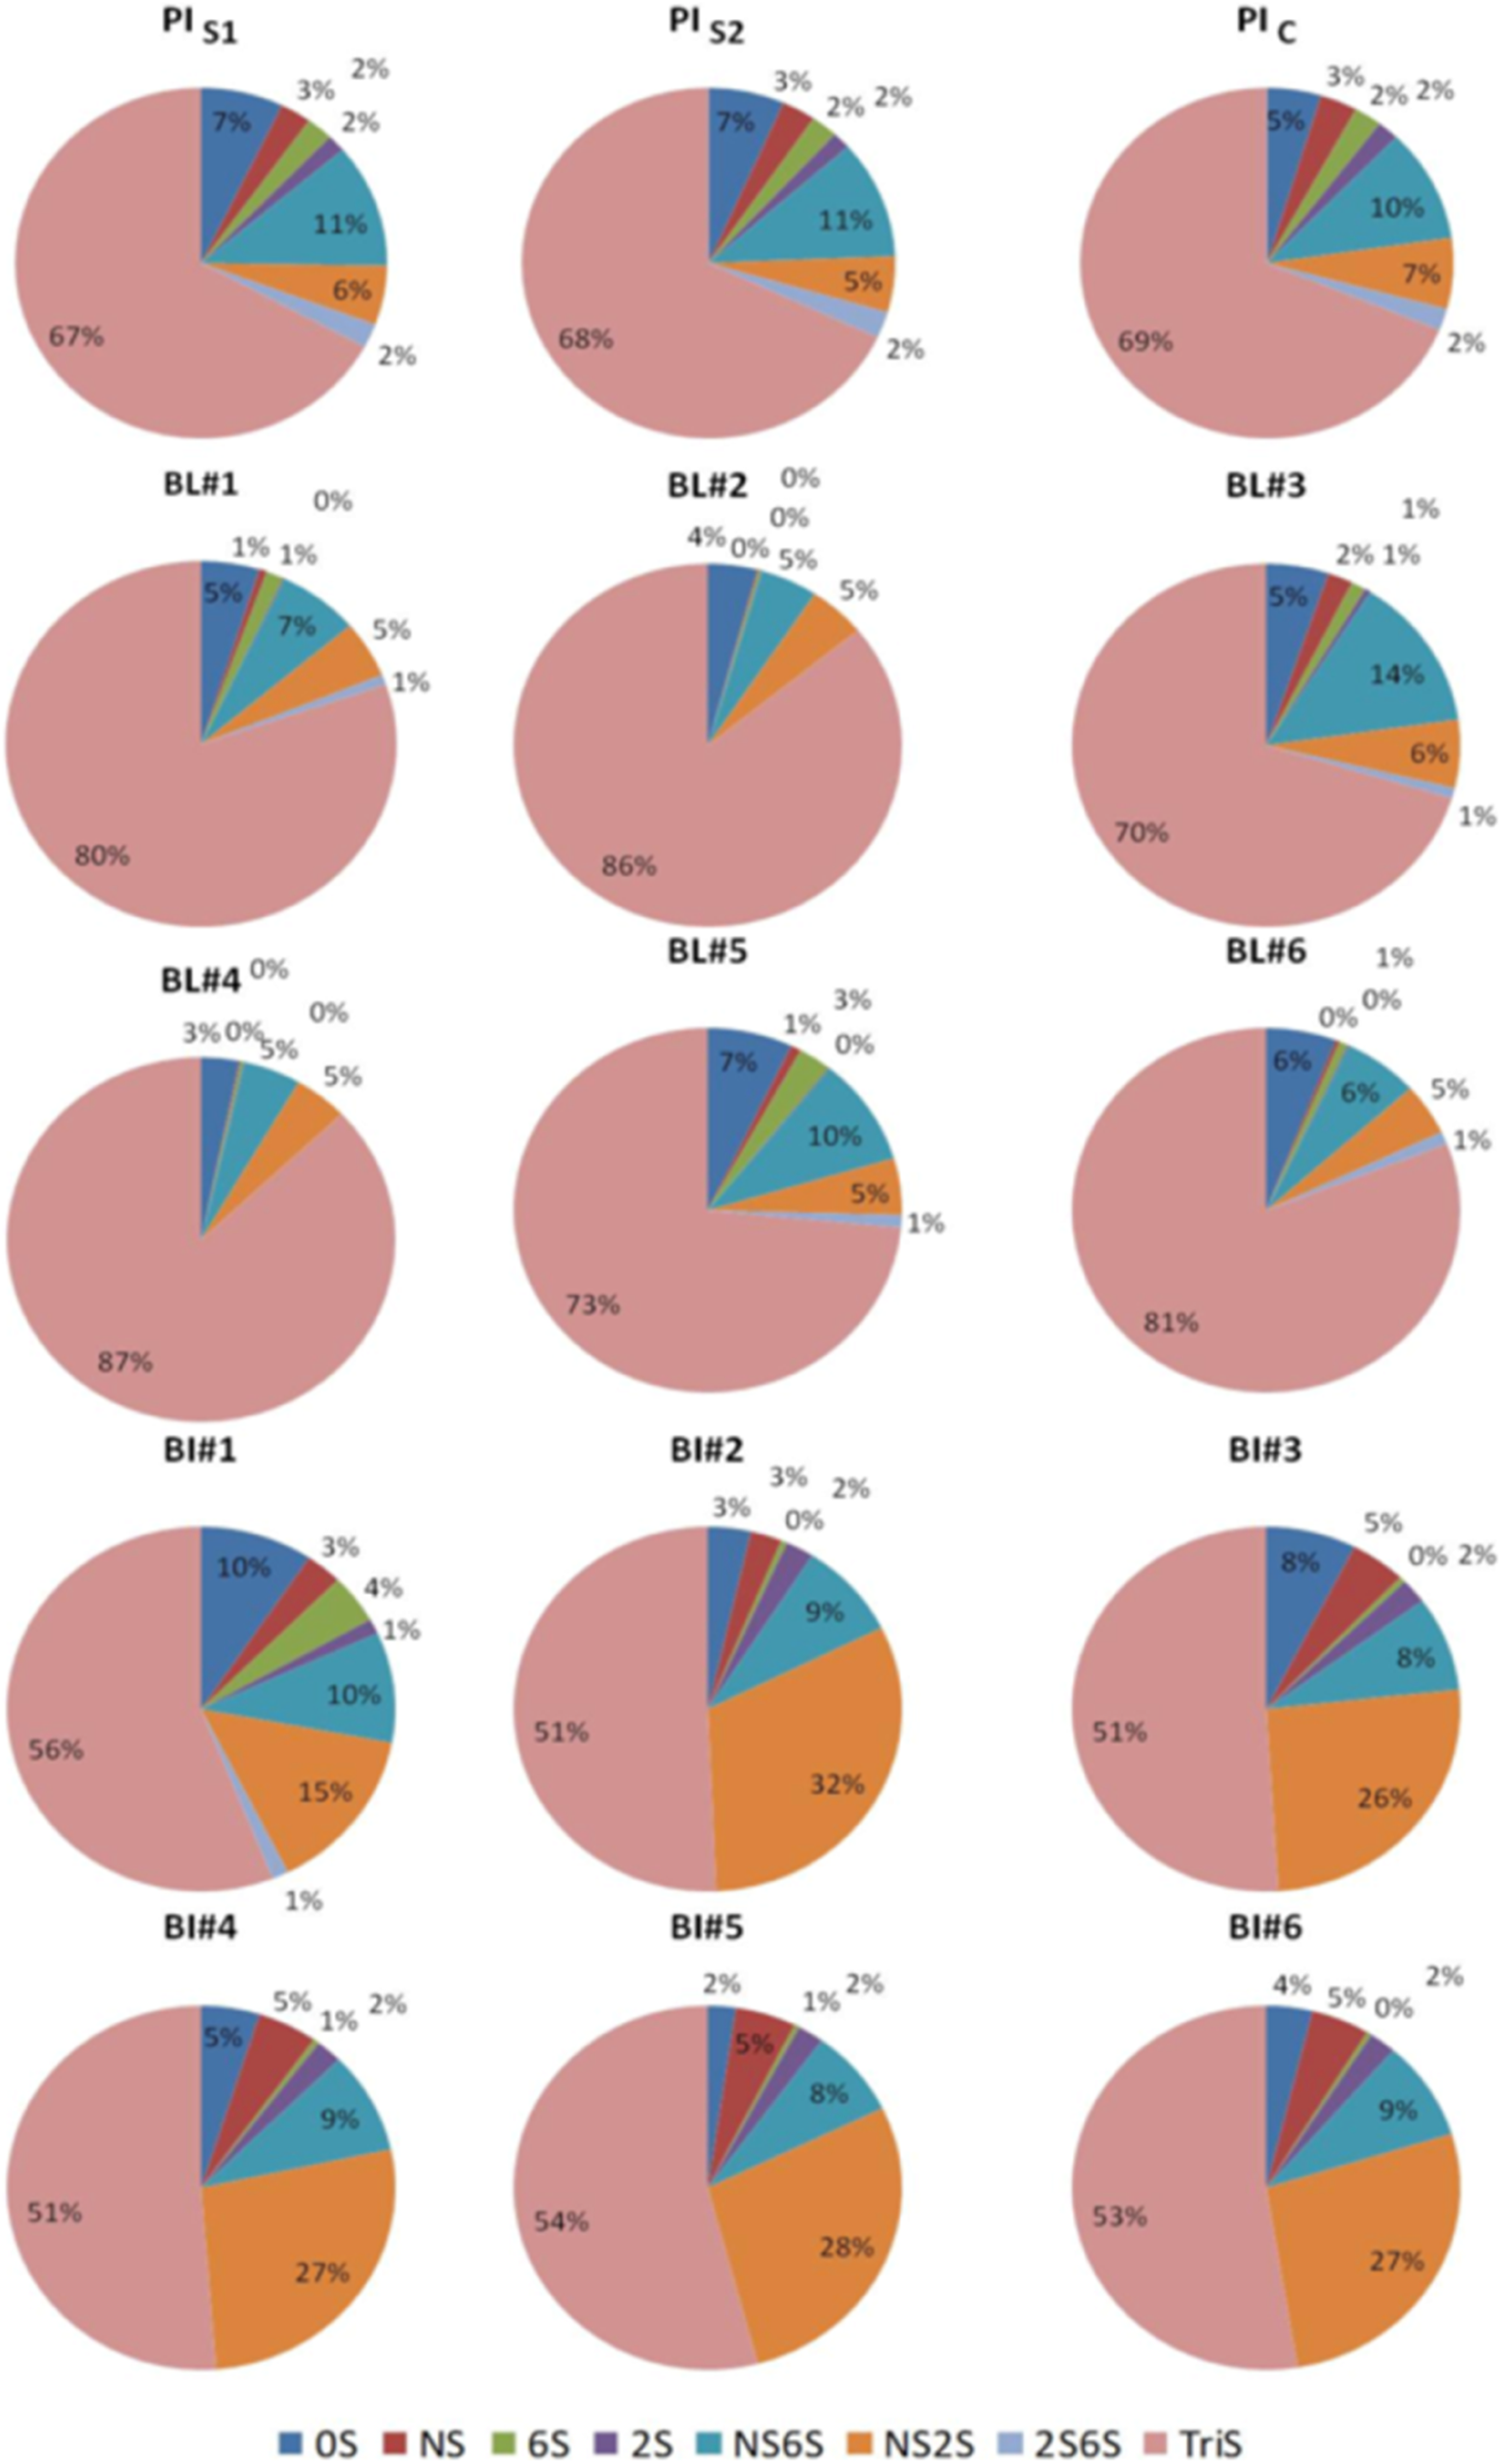
Composition of bovine lung, bovine intestinal, and porcine intestinal heparin determined by high-pressure liquid chromatography-ultraviolet analysis. See Table S1 for details on the heparins used in Figure 4.
Anticoagulant activity, conveniently determined using aPTT, was first used to analyze the BI, BL, and PI heparin samples (Figure S3). The BL, BI, and PI heparins produced a concentration-dependent anticoagulant effect, reaching a maximum of 300 seconds at a concentration of 5 μg/mL. The BL was a slightly weaker anticoagulant than the BI.
The USP amidolytic anti-Xa assay was next applied to BL and BI heparins (Figure 5A). Concentration-dependent inhibitory effects were observed in both agents reaching a ceiling at a concentration of 10 μg/mL. The BL heparins were slightly weaker anti-Xa agents than the BI heparins. The USP amidolytic anti-IIa assay of BL and BI heparins also showed concentration-dependent inhibitory effect in both agents, reaching a ceiling at a concentration of 5 μg/mL (Figure 5B). The comparison of the anti-Xa and anti-IIa activities, reference to the USP PI heparin standard as measured by the Biophen 2 stage methods, is shown in Figure 5C. The anti-Xa and anti-IIa potencies of the BL and intestinal heparins did not differ significantly in these assays. The potency of the anti-Xa and anti-IIa activity of the different heparin APIs tested in this study is presented in Table S1. A second set of 10 BI heparin samples, recently produced by Extrasul, was also examined, and these showed a very uniform level of activity (Table S2).
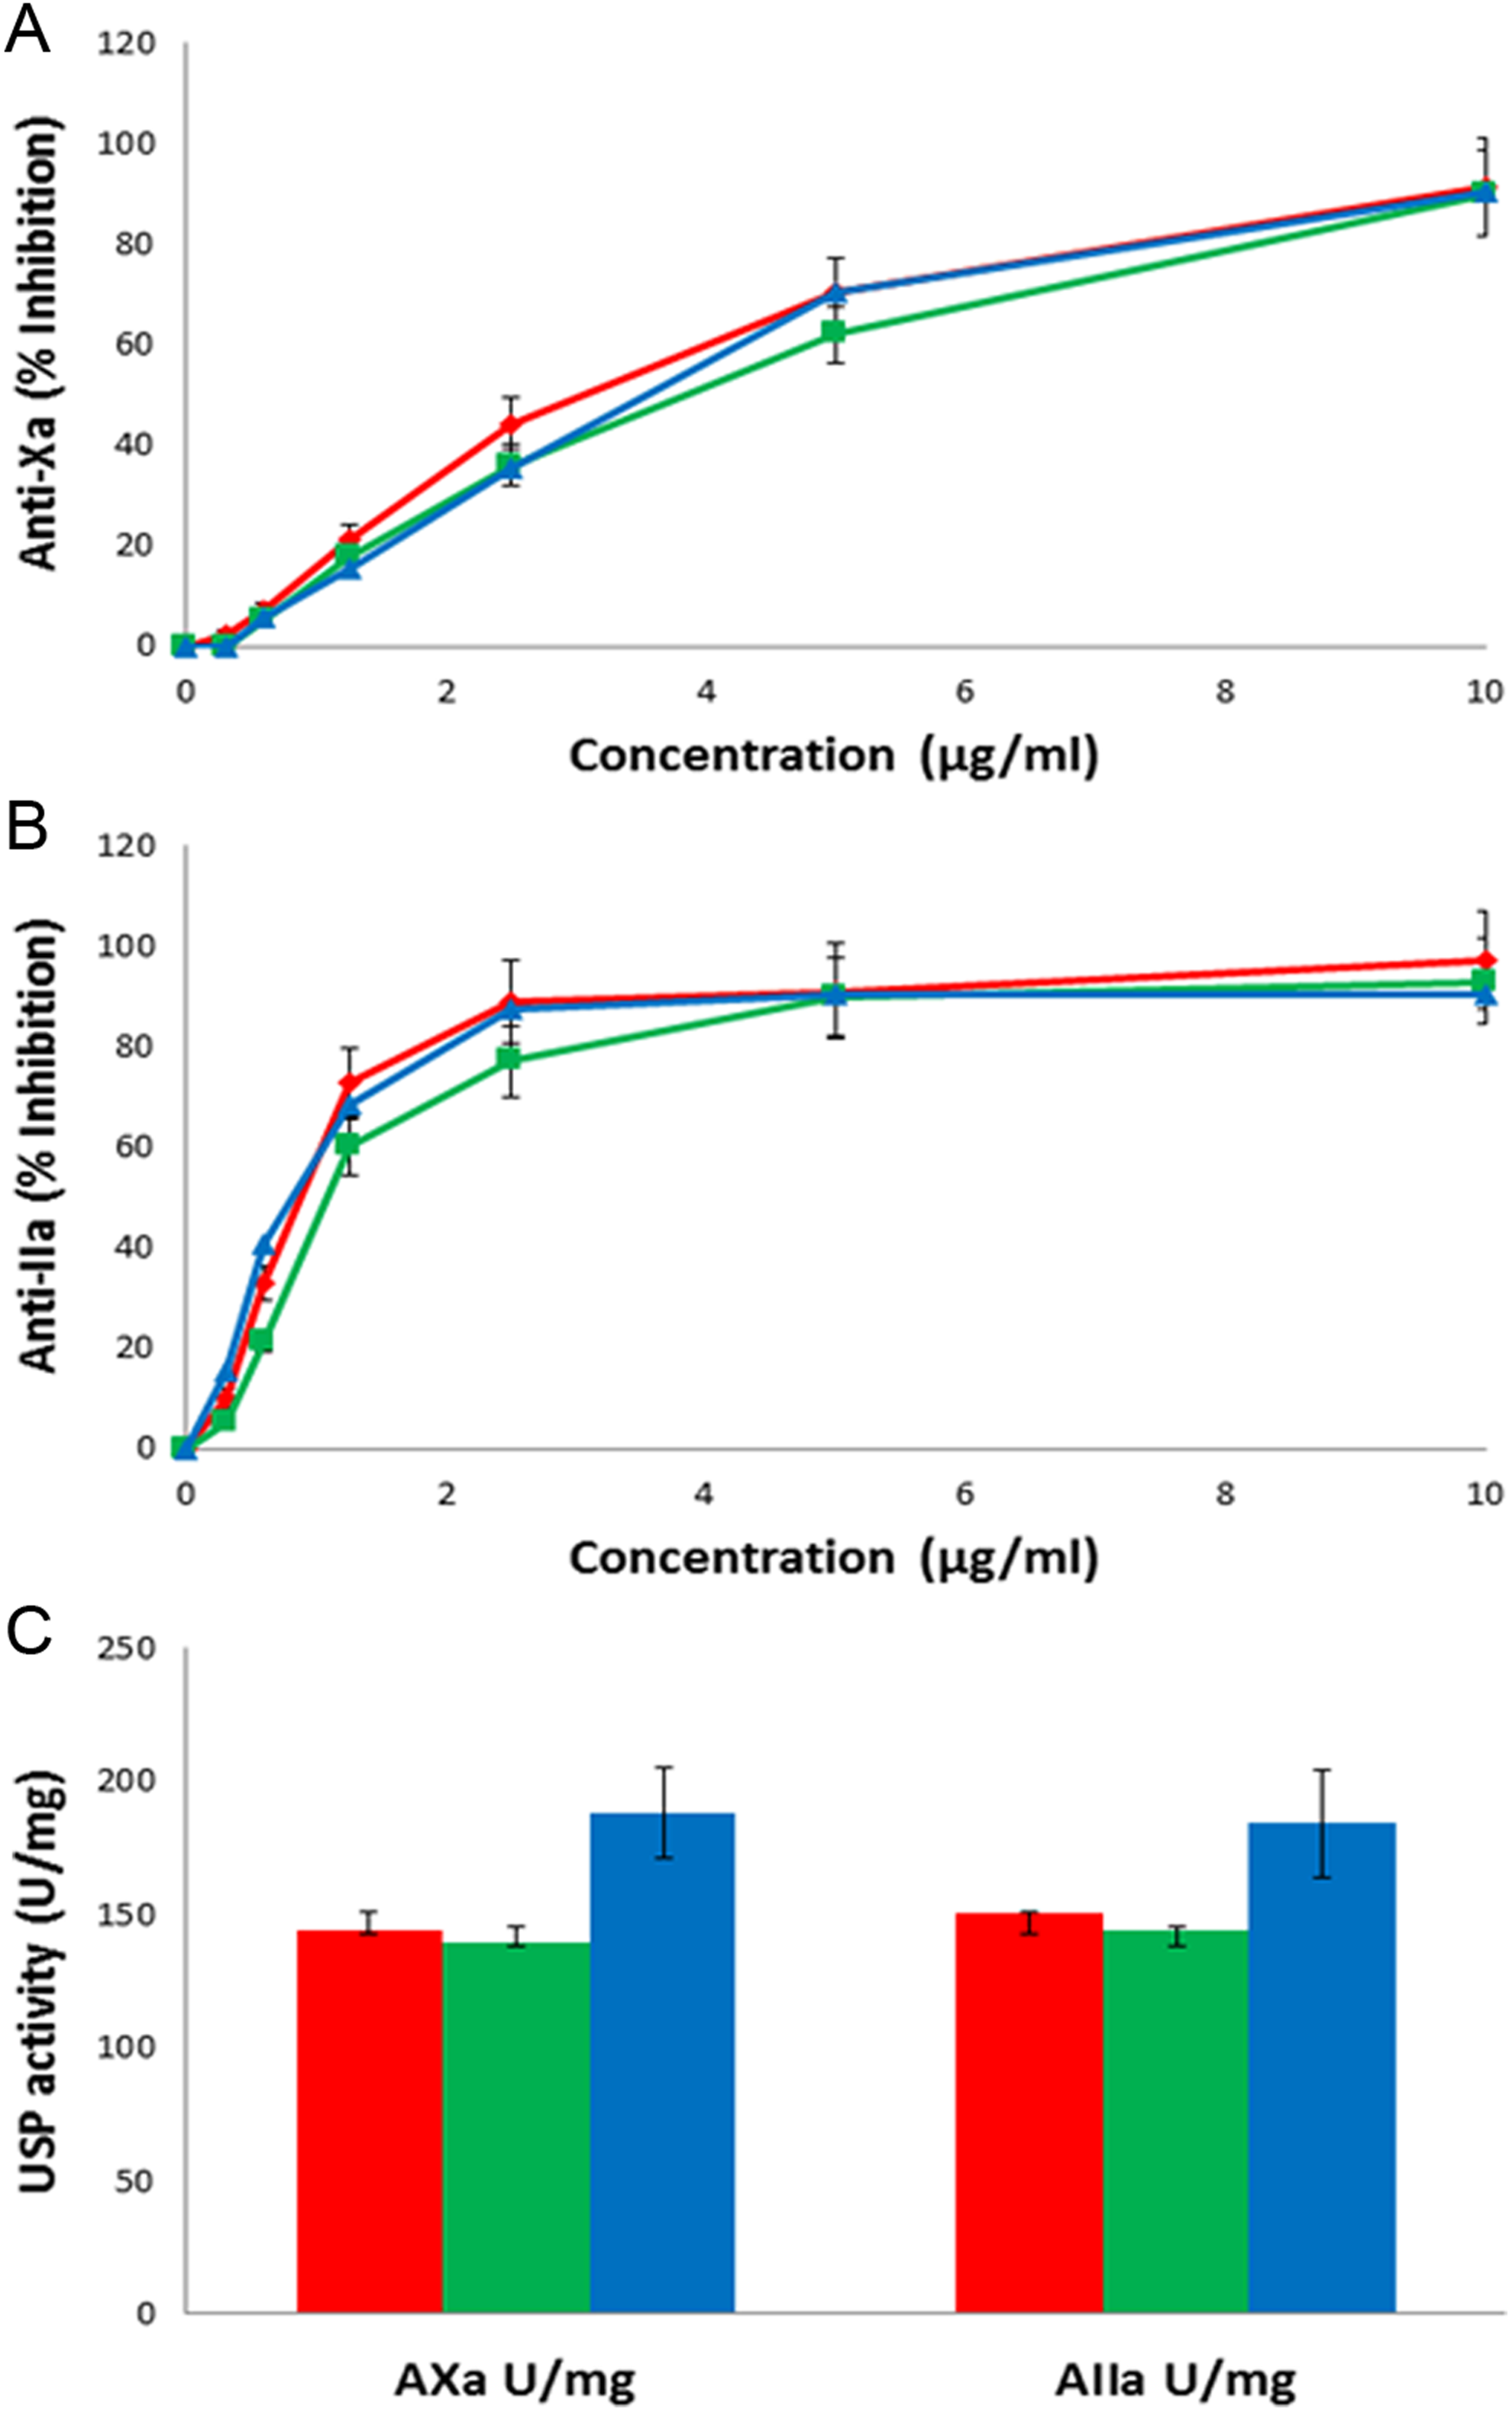
Anticoagulant activities of heparin samples. A, Anti-Xa activities of BI heparin (red), BL heparin (green), and porcine intestine (PI; blue) in the anti-Xa assay. All results represent a mean of 10 bovine heparins and 6 lung heparins cross-referenced against the United States Pharmacopeia (USP) PI heparin reference standard. B, Anti-IIa activities of BI heparin (red), BL heparin (green), and porcine intestine (blue) in the anti-IIa assay. All results represent a mean of 10 bovine heparins and 6 lung heparins cross-referenced against the USP PI heparin reference standard. C, Composite representation of the anti-Xa and anti-IIa activities in terms of USP potency as cross-referenced against the USP PI heparin reference standard. See Table S2 for details on the bovine heparins used in Figure 5.
Discussion
This study has shown that with the exception of molecular weight characteristics, porcine intestine and BL heparins showed a high level of similarity. There are similarities between heparin derived from porcine intestine and bovine intestine, however, there are also significant differences. The 1H NMR spectra of BI heparin have more peaks, and the similar peaks are broader than those observed in the spectra of PI heparin. The iduronic acid composition is also significantly different. The 13C NMR spectra also highlight the additional peaks and the broader peak area. These differences show there are subtle differences in the structure of the BI heparin when compared to porcine heparin.
The molecular weight distribution data were also examined. The BL heparins had a lower average molecular weight than PI USP heparin, whereas BI heparins were very similar in molecular weight properties to PI USP heparin. The molecular weight differences between BL and PI heparin may result in differences in their pharmacological properties, such as activities, bioavailability, pharmacokinetics, and clearance mechanism.
LC-MS and HPLC-UV were used to determine the disaccharide composition of the heparin samples, and both methods yielded quite similar results (Table S3). The BI heparins have a significantly higher NS2S and significantly lower TriS content as compared to the BL and PI heparins. The content of the other minor disaccharide components was similar in regard to their relative percentages. The compositional analyses also are useful in assessing the variability of heparins coming from a single tissue and species source. Although the PI heparin samples are very consistent, the BL heparin samples have a high level of variability. This could possibly be the result of variable manufacturing methods used over the historic period during which these samples had been prepared. The BI heparin samples showed lower variability but a considerable more complicated structure by virtue of their low TriS and high NS2S content.
These results on the functional activities of these agents showed that the anticoagulant and antiprotease effects of the BI heparins and BL heparins were comparable but significantly lower than the activities of the PI heparins. The lot-to-lot variations were also comparable in both groups. The anticoagulant effects of the BL heparins were higher than one subset of the BI heparins (BI1-BI6, Table S1) but slightly weaker than another subset of the BI heparins (Extrasul BI, Table S2). Thus, these studies suggest that the BI heparins may have high variability than BL heparins with respect to their functional activities.
Conclusion
Heparins isolated from PI, BL, and BI have structural and compositional similarities and differences. When compared to PI heparins, the variability of BL heparins are greater, but this could be due to the multiple historic manufacturers of BL heparins. It is not clear whether these structural differences will cause a dramatic effect in patients. The BL heparin samples are more comparable to PI heparin, though it is unclear whether its lower molecular weight will adversely affect the BL heparins pharmacology. It is clear that further research is required to answer these questions.
Footnotes
Declaration of Conflicting Interests
The author(s) declared no potential conflicts of interest with respect to the research, authorship, and/or publication of this article.
Funding
The author(s) disclosed receipt of the following financial support for the research, authorship, and/or publication of this article: The authors are grateful for support from the National Institutes of Health (HL094463, GM102137, HL62244, HL096972) and the National Science Foundation (MCB-1448657).