
Abstract
Introduction:
Disseminated intravascular coagulation (DIC) is a thrombohemorrhagic disorder characterized by hyperactivation of coagulation and secondary fibrinolysis.
Aim:
The primary aim of this prospective study was to evaluate and compare the diagnostic performance of fibrin monomer (FM) and
Materials and Methods:
The patients were categorized into 3 groups: overt DIC, nonovert DIC, and non-DIC based on the International Society of Thrombosis and Hemostasis scoring for overt DIC and the modified nonovert-DIC criteria. Coagulation tests were performed on freshly obtained plasma. Quantitative determination of FM and DD was done by immunoturbidimetric assay.
Results:
Median DD and FM levels in patients with overt DIC were significantly higher in comparison to the other 2 groups. Interestingly, unlike DD, the difference in FM levels was also found to be statistically significant between patients with nonovert DIC and non-DIC patients (P = .0001). At receiver–operator characteristic curve-generated cutoff values, FM had higher specificity and negative predictive value than DD for predicting onset of overt DIC. Multivariate analysis showed that only FM was as an independent predictive factor useful in differentiating patients with overt DIC from non-DIC patients (odds ratio [OR]: 43.3; confidence interval [CI] 4.61-406.68; P value = .001) as well as in distinguishing nonovert DIC from non-DIC patients (OR:18.3; CI 3.45-97.19; P value = .001).
Conclusion:
Fibrin monomer is a better indicator than DD in distinguishing patients with overt and nonovert DIC from non-DIC patients, raising the possibility for its diagnostic utility as a marker for impending overt DIC, aiding in early diagnosis and prompt therapeutic intervention.
Introduction
Disseminated intravascular coagulation is a thrombohemorrhagic disorder characterized by hyperactivation of coagulation and secondary fibrinolysis. The DIC is not a disease itself but is always secondary to an underlying disorder. Commonly associated etiologies include infections, solid organ or hematological malignancies, severe liver disease, trauma, obstetric complications, and so on.
1
–6
In 2001, the Scientific and Standardization Subcommittee on DIC of the International Society of Thrombosis and Hemostasis (ISTH) laid down guidelines for the diagnosis of overt and nonovert DIC.
7
Diagnostic criteria for nonovert DIC includes additional parameters such as antithrombin (AT), protein C, thrombin–antithrombin (TAT) complexes, or soluble fibrin monomer (FM) complexes (SFMCs). However, validation of a scoring algorithm for nonovert DIC proposed by ISTH is still incomplete for detecting patients with DIC in early stages.
8
–12
Moreover, no single laboratory test is specific and sensitive enough to make a definitive diagnosis of the compensated and decompensated stages of DIC. There are very few studies aimed at comparing the diagnostic performance of different fibrin-related markers (FRMs) in overt and nonovert DIC, and their results are also variable. With this in background, the primary aim of this study was to evaluate and compare the diagnostic performance of FM and
Materials and Methods
This prospective study was conducted in the Coagulation Laboratory, Department of Hematology, All India Institute of Medical Sciences, New Delhi. Seventy patients suspected to have DIC on the basis of history of an underlying DIC-associated disease, clinical manifestations such as bleeding and multiorgan failure, and abnormal coagulation profile were included in the final study. Patients with history of autoimmune disease or thrombosis, those on anticoagulant medication, and those with known hemostatic abnormalities were excluded. The patients were categorized into 3 groups: overt DIC, nonovert DIC, and non-DIC based on the ISTH scoring for overt DIC and the modified nonovert DIC criteria using additional parameters such as AT and FM. 8 Management of these patients mainly included prompt replacement with fresh frozen plasma and platelets along with treatment of the primary cause. Thirty healthy controls were also included, from among the relatives of those presenting in the laboratory for their coagulation testing, to establish normal range of FM in the Indian population. Mean FM levels in 30 healthy controls were found to be 5.29 ± 0.46. Written informed consent was obtained from both the patients and the controls, and ethical clearance was obtained from the Institutional Ethical Committee prior to the conduct of the study.
Blood samples (5 mL) for coagulation tests were collected into tubes containing 3.2% sodium citrate (in the ratio of 1:9) and processed within 4 hours of collection. Coagulation tests, including prothrombin time (PT), activated partial thromboplastin time (APTT), and thromboplastin time (TT), fibrinogen assay, and platelet count were performed on the freshly obtained plasma. Heparin contamination was ruled out in cases with abnormally high results of coagulation profile such as PT, TT, and APTT by repeating the tests with fresh blood samples taken from a different venipuncture site. Aliquots of platelet-poor plasma were prepared and stored at −70°C for the determination of FM, quantitative DD, and antithrombin (AT) III. Frozen plasma was thawed directly at 37°C for 15 minutes before testing. Quantification of AT was done by chromogenic assay using STACHROM ATIII kit on automated STA Compact Analyzer (Diagnostica Stago, France). Normal laboratory reference range for AT was 80% to 120%. Quantitative determination of SFMCs and DD were done by immunoturbidimetric assay using STA-LIATEST FM and D-Di kits, respectively (Diagnostica Stago). 13 Levels of FM and DD < 6 μg/mL and < 0.5 μg/mL, respectively, were considered as normal. Hemoglobin, bilirubin, and heparins caused no interference with the assay results until concentrations of 5 mg/mL, 200 μg/mL, and 2 IU/mL, respectively. All samples showing borderline results were repeated, and only those samples giving consistent results on both occasions were considered as positive.
SPSS software (Stata Statistical Software, Release 12.0; Chicago, Illinois) was used to perform statistical analysis. Data were presented in median and frequency percentage. Categorical data were compared among the comparison groups by chi-square test and Fisher exact test. Continuous data following nonnormal distribution were compared in the 2 groups by Wilcoxon rank-sum test and among the 3 comparison groups by Kruskal-Wallis equality of populations rank test, followed by Wilcoxon rank-sum test with Bonferroni correction. All tests were 2 sided, and a P < .05 was considered statistically significant. Multivariate Cox model was used to analyze all laboratory variables, whether significant or not. The correlation between the DIC score and the levels of FRMs was also analyzed, and the receiver–operating characteristic (ROC) curve analysis was performed to compare their diagnostic performance. According to the cutoffs of FRMs from the ROC curve, sensitivity, and specificity, positive predictive value (PPV) and negative predictive value (NPV) were calculated.
Results
Of a total of 70 patients, 32 (45.7%) were categorized as overt DIC, 24 (34.3%) qualified as nonovert DIC, and the remaining 14 (14/70;20%) were labeled as non-DIC. The commoner underlying etiologies predisposing to DIC in these patients included hematological malignancies, solid organ tumors, septicemia, liver cirrhosis, and so on (Table 1).
Etiological Distribution of Patients With and Without Overt DIC.
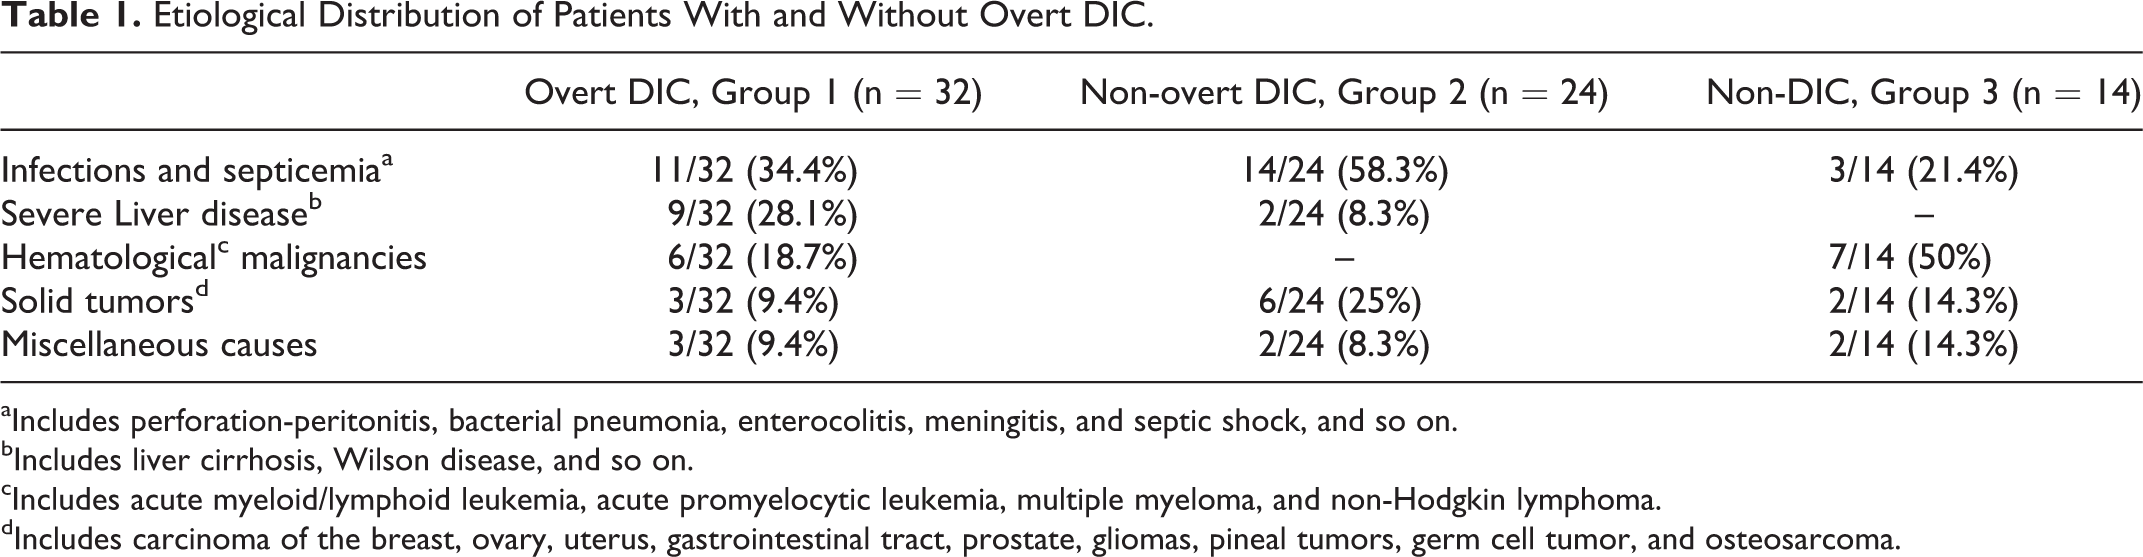
aIncludes perforation-peritonitis, bacterial pneumonia, enterocolitis, meningitis, and septic shock, and so on.
bIncludes liver cirrhosis, Wilson disease, and so on.
cIncludes acute myeloid/lymphoid leukemia, acute promyelocytic leukemia, multiple myeloma, and non-Hodgkin lymphoma.
dIncludes carcinoma of the breast, ovary, uterus, gastrointestinal tract, prostate, gliomas, pineal tumors, germ cell tumor, and osteosarcoma.
Median DD value in patients with overt DIC was 6.55 μg/mL when compared to median values of 2.84 μg/mL and 2.35 μg/mL in the nonovert DIC and non-DIC groups, respectively, and the difference was statistically significant (P = .0001; P = .0003). However, the difference was not statistically significant between the nonovert DIC and the non-DIC patients (P = .17).
Median FM value in patients with overt DIC was significantly higher (55.6 μg/mL) in comparison with median values of 9.65 and 5.98 μg/mL in the nonovert DIC and non-DIC groups (P = .0001; P = .047). Interestingly, the difference in FM levels was found to be statistically significant between patients with nonovert DIC and the non-DIC patients (P = .0001) as shown in Table 2 and Figure 1. At ROC-generated cutoff values for the fibrin-related markers, FM ≥ 9.32 μg/mL had higher specificity (92.86% vs 85.71%) and negative predictive value (96.3% vs 92.86%) in comparison to DD ≥ 3.34 μg/mL for distinguishing between overt DIC and non-DIC groups (Table 3; Figure 2A-C). Similarly, in differentiating the patients with nonovert DIC from the non-DIC group, FM ≥ 7.2 μg/mL had higher specificity, sensitivity, and negative predictive value when compared to DD ≥2.2 μg/mL.
Baseline Characteristics of Patients With Overt, Nonovert, and Non-DIC.
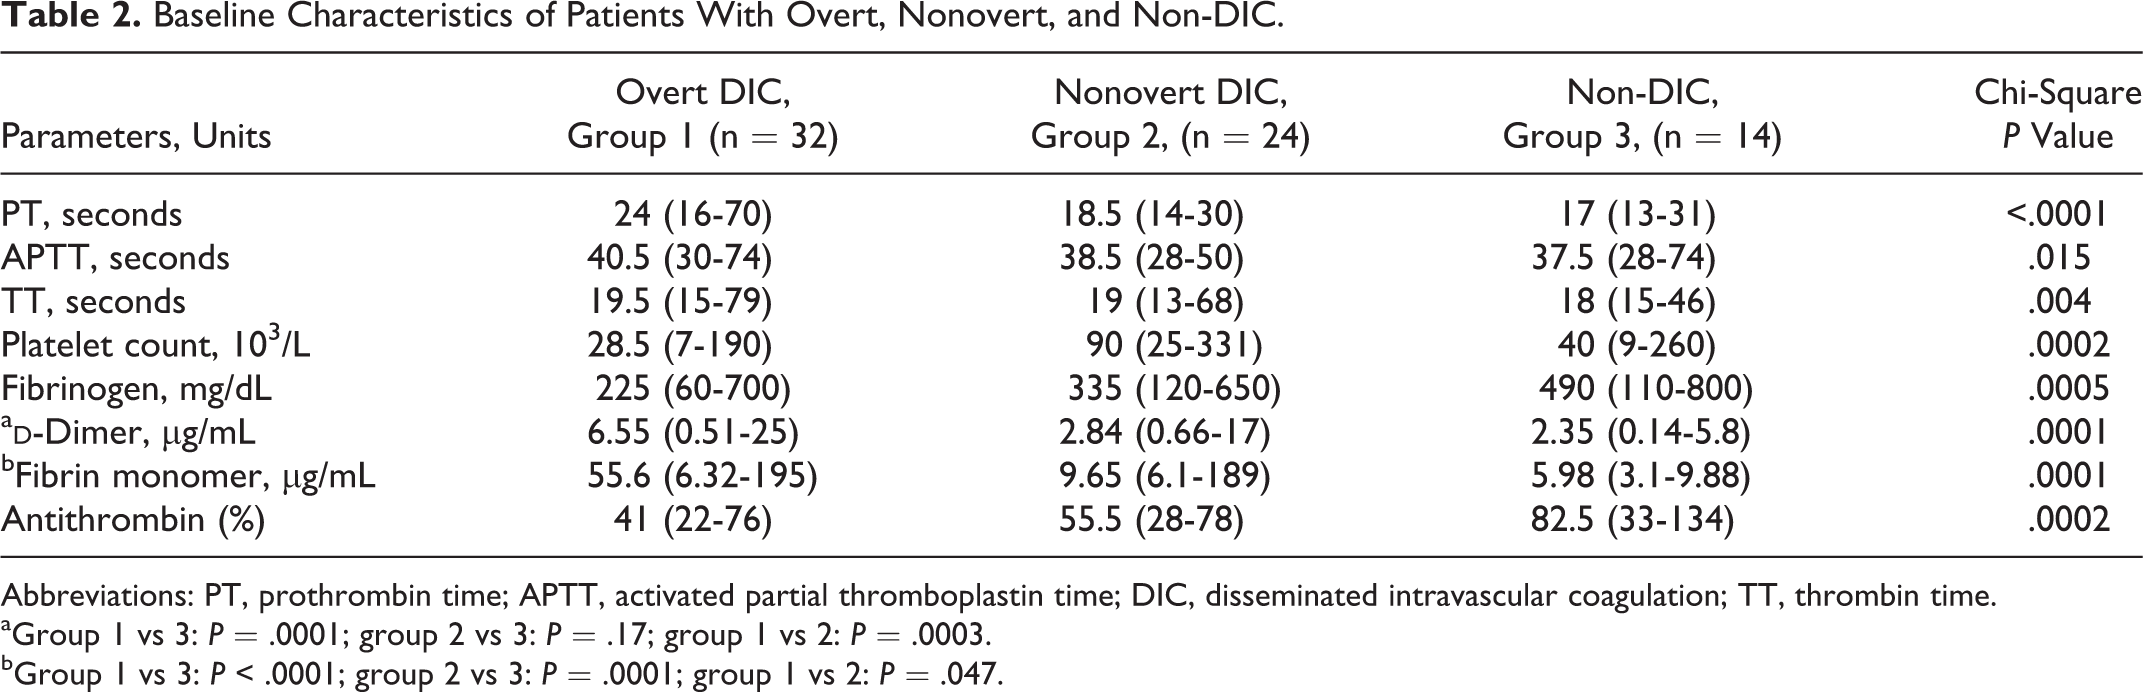
Abbreviations: PT, prothrombin time; APTT, activated partial thromboplastin time; DIC, disseminated intravascular coagulation; TT, thrombin time.
aGroup 1 vs 3: P = .0001; group 2 vs 3: P = .17; group 1 vs 2: P = .0003.
bGroup 1 vs 3: P < .0001; group 2 vs 3: P = .0001; group 1 vs 2: P = .047.
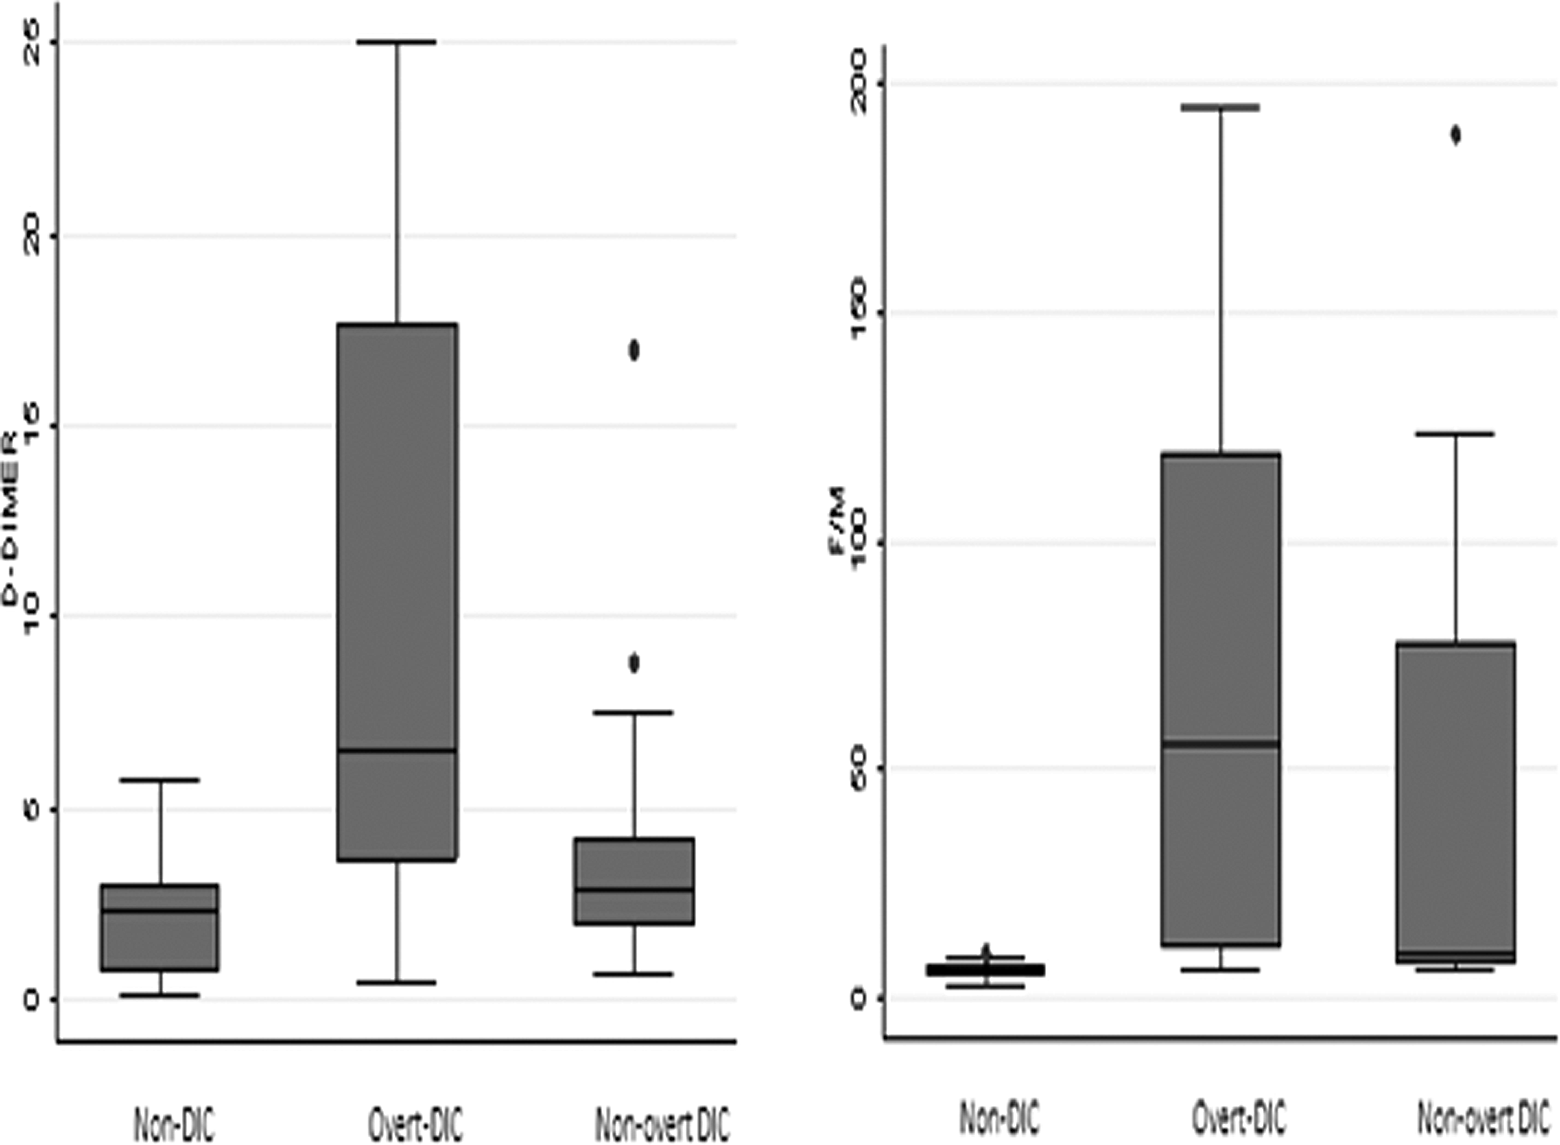
Box plots of the plasma concentration of
Diagnostic Performance of Fibrin-Related Markers.
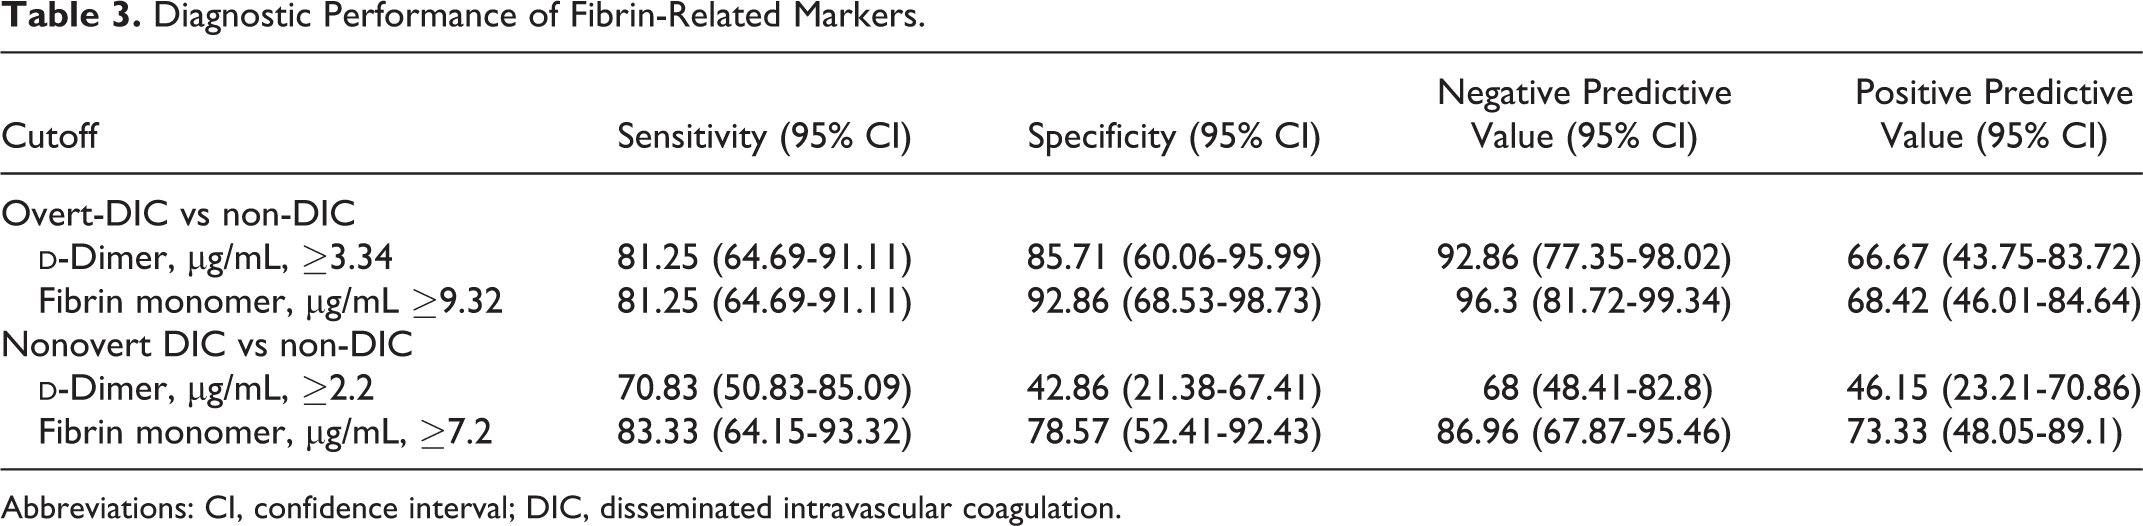
Abbreviations: CI, confidence interval; DIC, disseminated intravascular coagulation.
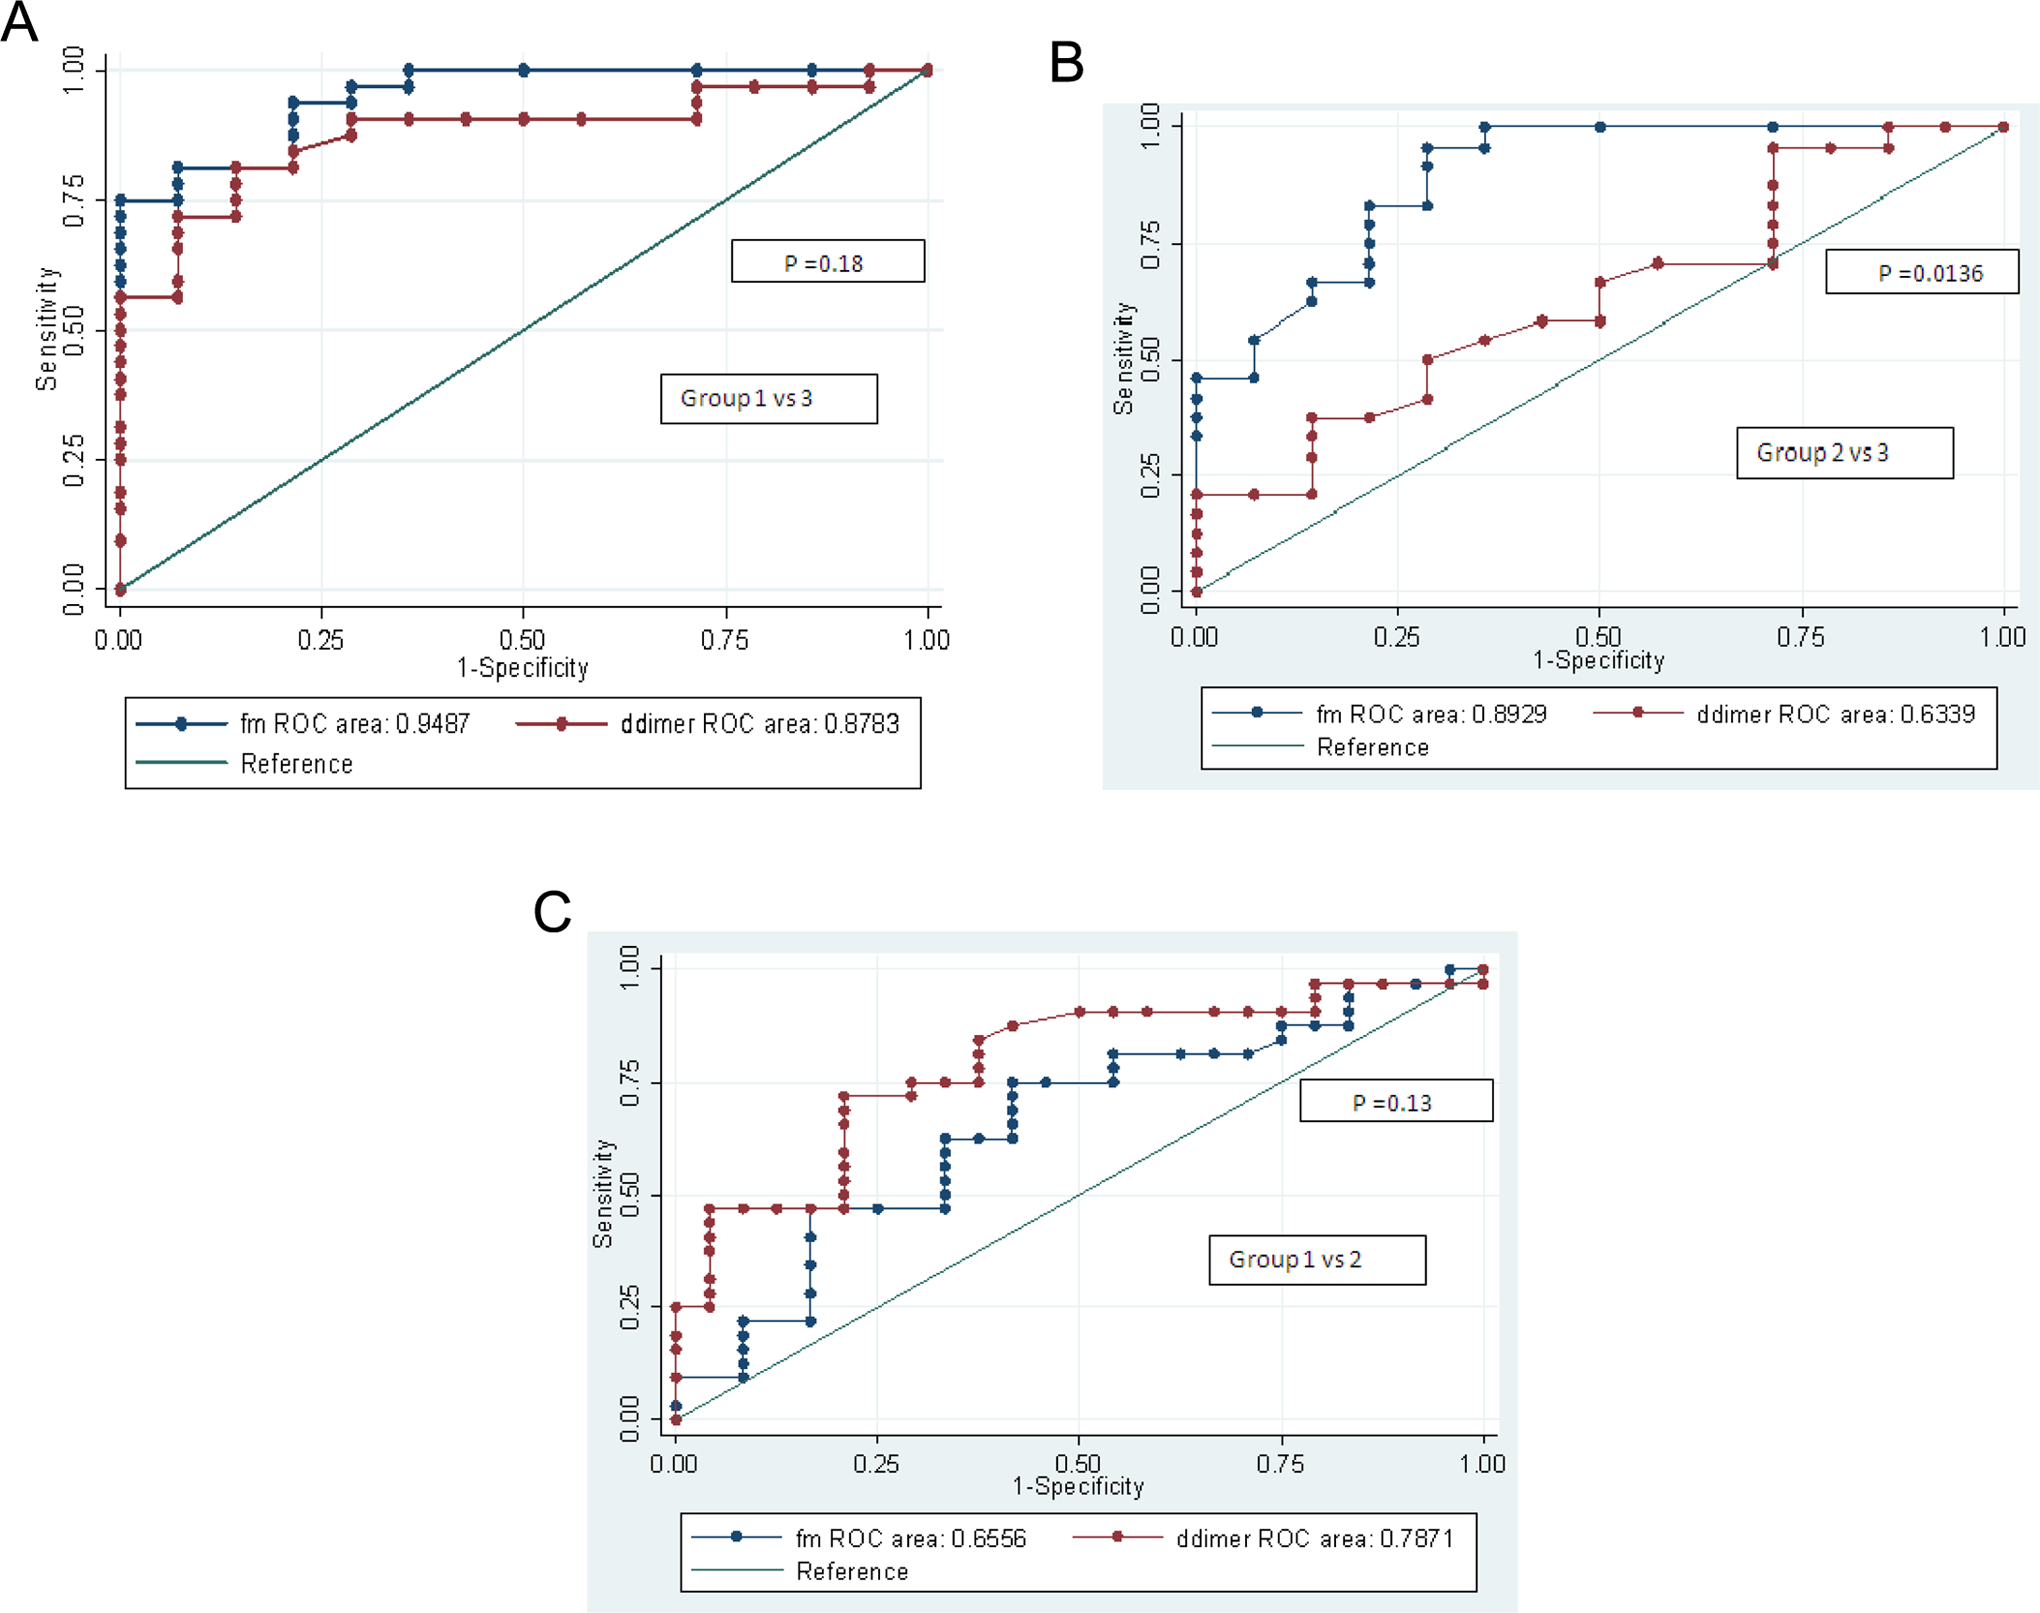
A-C, Receiver–operating characteristic (ROC) curves of
In the multivariate analysis involving all variables, only FM emerged as an independent predictive factor useful in differentiating patients with overt DIC from non-DIC patients (odds ratio [OR]: 43.3; confidence interval [CI]: 4.61-406.68; P value = .001) as well as in distinguishing patients with nonovert DIC from non-DIC patients (OR:18.3; CI 3.45-97.19; P value = .001).
Discussion
Disseminated intravascular coagulation is characterized by persistent intravascular thrombin generation and fibrin formation in the microvasculature, ultimately leading to depletion of coagulation factors and natural anticoagulants to produce a bleeding and/or thrombotic disorder. The FRMs include DD, fibrin degradation product, and SFMCs. Both
In this study, plasma FM assay had clearcut advantage over DD in differentiating overt and nonovert DIC from non-DIC patients in view of the results of the multivariate analysis and ROC curves. It can be attributed to the fact that DD is produced by secondary fibrinolysis of cross-linked fibrin in the postthrombotic phase, while FM is produced by release of fibrinopeptide A from fibrinogen by thrombin in the hypercoagulable state, even before the formation of DD. 17–18 These findings were in striking contrast to the observations of Park et al who compared the ROC curves for FM and DD in nonovert DIC patients and showed that FM was not a better indicator than DD in terms of sensitivity, negative predictive value and odds ratio. 12 They hypothesized that the discrepancy in the utility of FM and DD in overt and nonovert DIC could be due to the fact that FM is derived only from intravascular sources, while DD is obtained from both the intravascular and the extravascular sources.
Moreover, this study also corroborated well with the observations of Selim et al who proposed that SFMC may be used as an excellent marker for monitoring the magnitude of activation of coagulation in septic neonates. 19 However, they did not demonstrate the results of the DD assay to make any significant conclusions regarding the utility of SFMC over DD in patients with DIC. Some other studies have also shown variable results in terms of clinical relevance of DD or SFMC in comparison to each other. Dempfle et al and Wada et al proposed FM as a better fibrin-related marker than DD while the likes of Okamoto et al emphasized that FM had no role in differentiation of pre-DIC patients unlike DD. 10,14,16,20,21
Conclusion
Thus, it can be concluded that FM is a better indicator than DD in distinguishing patients with overt and nonovert DIC from non-DIC patients, raising the possibility for its diagnostic utility as a marker for impending overt DIC, aiding in early diagnosis and prompt therapeutic intervention. As the sample size is small and the pre-DIC patients could not be delineated from the non-DIC patients, more comprehensive studies are clearly required to validate these results.
Footnotes
Authors’ Note
NS conducted the study, collected the data, analyzed the results, and drafted the paper. HP, ST, and RS coordinated the study, provided valuable inputs, and reviewed the paper. AU performed statistical analysis. All authors read and approved the final manuscript.
Acknowledgement
We are thankful to Mr Suresh for his technical assistance in performing the tests.
Declaration of Conflicting Interests
The author(s) declared no potential conflicts of interest with respect to the research, authorship, and/or publication of this article.
Funding
The author(s) disclosed receipt of the following financial support for the research, authorship, and/or publication of this article: This project was funded by the Indian Council of Medical Research.