
Abstract
We evaluated the correlation between thrombin generation (TG) parameters with bleeding symptoms and disease severity in patients with hemophilia. In this cross-sectional study, 59 patients with hemophilia without inhibitors and regardless of their severity were randomly selected from southern Iran and TG assays were conducted. Bleeding score (BS) was calculated by performing a clinical evaluation using Tosetto questionnaire. Only lag time showed a statistically significant correlation with BS (rs = .316, P = .016). All TG parameters except peak showed association with disease severity (P < .05). Endogenous thrombin potential showed a significant correlation with factor activity level (rs = .459, P < .001). Both lag time and start tail showed significant negative correlations with factor activity level (rs = −0.488, P < .001 and rs = − .289, P < .026, respectively). Although most of the TG parameters evaluated were not significantly correlated with the BS of patients with hemophilia, the majority of TG parameters were significantly associated with factor activity level and disease severity.
Introduction
Hemophilia, with an incidence rate of about 1 in 5000 to 10,000 male births, is a congenital bleeding disorder (inherited X-linked recessive). It is caused due to a deficiency of factor (F) VIII or FIX. 1,2
Clinical severity of the disorder generally correlates with the factor activity level. According to the level of factor activity, patients are classified into 3 clinical categories, severe (<1.0 IU/dL), moderate (1.0–5.0 IU/dL), and mild (>5.0 IU/dL). 3,4 However, large clinical heterogeneity is observed with some patients especially in the severe type. 5,6
The first approach to the patient with bleeding disorder is collection of information on symptoms and bleeding history. It is recognized from clinical experience that in patients with these disorders, the relation between the results of plasma levels of deficient factor by conventional coagulation screening tests and bleeding tendency can vary markedly between deficiencies and between patients. 7
The laboratory diagnosis of hemophilia is currently executed by accurate measurement of the deficient clotting factor as well as coagulation screening tests such as the prothrombin time (PT), the activated partial thromboplastin time (aPTT), and the thrombin time (TT) undertaken by patients presenting with a clinical and family history of bleeding. 8 These screening tests cannot completely reflect all steps of hemostatic balance. Fibrinolysis and clot stabilization can’t be evaluated by PT or/and aPTT. Thrombin generation (TG), as a focal point and key process, is an important step in hemostasis and thrombosis. Recent evidence has indicated that TG assay is a better predictor of the coagulation capacity and subsequently overall assessment of hemostasis compared with traditional coagulation tests. The parameters of the thrombogram are helpful in the evaluation of bleeding or thrombotic risk and also in the management of these situations. 9 –12
Recently, a relationship has been observed between the TG assay and the clinical bleeding tendency in patients with hemophilia and rare inherited bleeding disorders. 5,13 Several authors demonstrated that clinical bleeding tendency is observed when TG decreases below 20% of the normal range. 11,13 Also, there are many reports indicating that TG assay can resolve the discrepancy between the routine coagulation tests and clinical severity in patients with coagulation disorders. 14
In this study, we aim to determine the correlation between TG parameters with bleeding symptoms and disease severity in patients with hemophilia. To our knowledge, no specific questionnaires are available for evaluation of bleeding score (BS) in patients with hemophilia. On the other hand, Tosetto questionnaire, which was designed for von Willebrand disease, 15 evaluates comprehensive bleeding symptoms in this group of patients. So we used this tool for the evaluation of BS in our patients.
Methods
Patients
In this cross-sectional study, 59 male patients with hemophilia without inhibitors were randomly selected regardless of their severity from those already registered at Shiraz Hemophilia Center of southern Iran, from February to December 2012. Also, 38 healthy age-matched men were considered as a control group from those referred for checkup. Informed written consent was obtained from all participants. The proposal was approved by the medical ethics committee of Shiraz University of Medical Sciences (Code 6215).
Disease severity was defined based on the activity level of deficient factor (severe <1%, moderate from 1% to 5%, and mild >5% IU/dL). None of the patients was on prophylaxis at the time of blood sampling. All patients received on-demand therapy with at least a 2-week washout period before blood sampling. The BS was calculated by performing a clinical evaluation using a modified questionnaire based on Tosetto et al questionnaire, 15 which was designed for von Willebrand disease. Patients were asked about the occurrence of any type of bleeding symptoms. Based on the presence or absence of each symptom as well as frequency and severity of each symptom, a score from 0 to 4 was considered for each item of bleeding symptoms. Final BS for each patient was calculated by summing all scores of bleeding symptoms.
Laboratory Evaluation
Coagulation screening tests
The aPTT was measured by SynthASil (HemosIL Cat. No. 0020006810; Instrumentation Laboratory, Italy) which contained a colloidal silica activator. The PT and TT were measured by PT-fibrinogen kit (HemosIL kit; Instrumentation Laboratory) and Thrombin time kit (HemosIL kit; Instrumentation Laboratory), respectively. All of these coagulation screening tests were performed on ACL IL9000 (Instrumentation Laboratory Company, Bedford, Massachusetts; Instrumentation Laboratory SpA, Milano, Italy).
Specific coagulation assay
The activity values of FVIII and FIX were measured by using factor-deficient plasma of each factor (HemosIL kit; Instrumentation Laboratory), that is, one-stage aPTT-based method.
Thrombin generation assay
Blood was collected by venipuncture into a tube containing 0.105 M trisodium citrate (ratio 9:1). Platelet poor plasma (PPP) was prepared by centrifugation at 2000g for 20 minutes at room temperature and was then snap frozen with liquid nitrogen and reserved at −80°C until testing (up to 2 weeks). The fluorogenic substrate (Fluo-substrate) was used. The measurement of TG in PPP was done using a mixture of phospholipids and tissue factor (PPP-Reagent LOW). The TG curve was plotted using Fluoroskan Ascent Microplate Fluorometer (Thermo scientific, the Netherlands) and Thrombinoscope software (Thrombinoscope BV, the Netherlands). Finally, the analysis program calculated all parameters of the thrombogram, which are characterized by the following main parameters: The lag time is the clotting time, the moment at which TG begins. The peak height, that is, the maximum thrombin concentration, in nanomolar thrombin. The time to peak (ttpeak), that is, the time to reach the maximum thrombin concentration. The endogenous thrombin potential (ETP), Area Under the Curve (AUC), the total amount of thrombin generated, in nanomolar minute. The start tail, time at which the TG came to an end, in minutes.
16
Statistical Analysis
Data were analyzed by SPSS (SPSS Inc, Chicago, Illinois) version 17. Normality of data was checked by Shapiro-Wilk test. All TG parameters as well as BS did not show normal distribution, so nonparametric tests were used for statistical analysis. Mann-Whitney U test and Kruskal-Wallis test were used for comparison of quantitative variables between the 2 groups and among 3 or more groups, respectively. Spearman’s r test was used for determination of correlation between quantitative variables. P value of less than .05 was considered statistically significant.
Results
The descriptive results of coagulation screening tests of the studied population are shown in Table 1. All patients had normal range of PT and TT. The disease was severe in 40 patients (68%) of the 59 patients with hemophilia (52 hemophilia A and 7 hemophilia B), it was moderate in 14 (24%) and mild in 5 (8%). On-demand therapy was used for all patients. Disease severity was associated significantly with BS as shown in Table 2 (P value < .001). Also, BS showed a significant negative correlation with factor activity level (rs = −.543, P < .001).
Comparison of the Results of Coagulation Screening Tests in Patients With Hemophilia Based on Disease Severity.
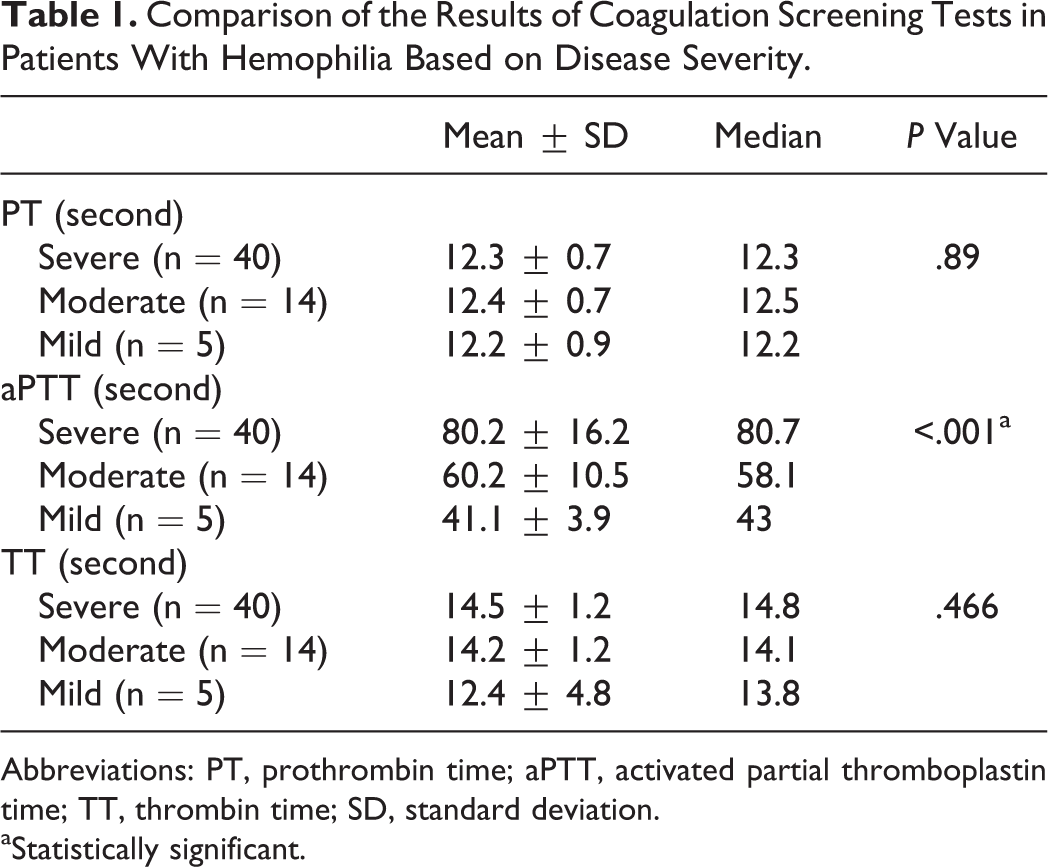
Abbreviations: PT, prothrombin time; aPTT, activated partial thromboplastin time; TT, thrombin time; SD, standard deviation.
aStatistically significant.
Comparison of bleeding score among different groups of hemophilia patients regarding disease severity.
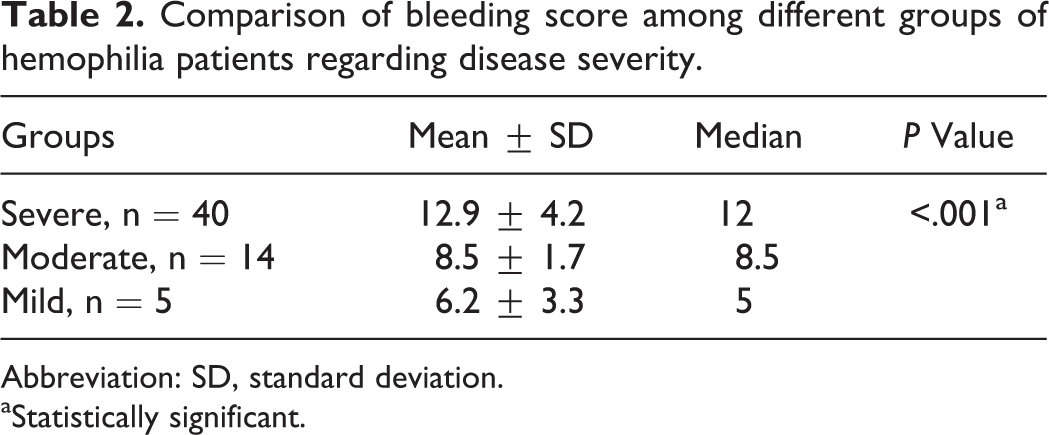
Abbreviation: SD, standard deviation.
aStatistically significant.
All TG parameters showed statistically significant differences between patients and healthy controls (P < .001; Table 3). Due to the heterogeneity of patients with hemophilia regarding disease severity in our study, we also stratified patients in 3 subgroups and compared TG parameters with controls in each subgroup. Comparison of all TG parameters yielded the same results between patients and controls in different subgroups of patients except for ETP in patients with mild hemophilia that was not significantly different between patients (mean ± standard deviation : 1155 ± 464; median: 1053; min: 711; and max: 1890) and healthy controls (P = .16).
Thrombin Generation Assays of 59 Patients With Hemophilia in Comparison With 38 Healthy Individuals.
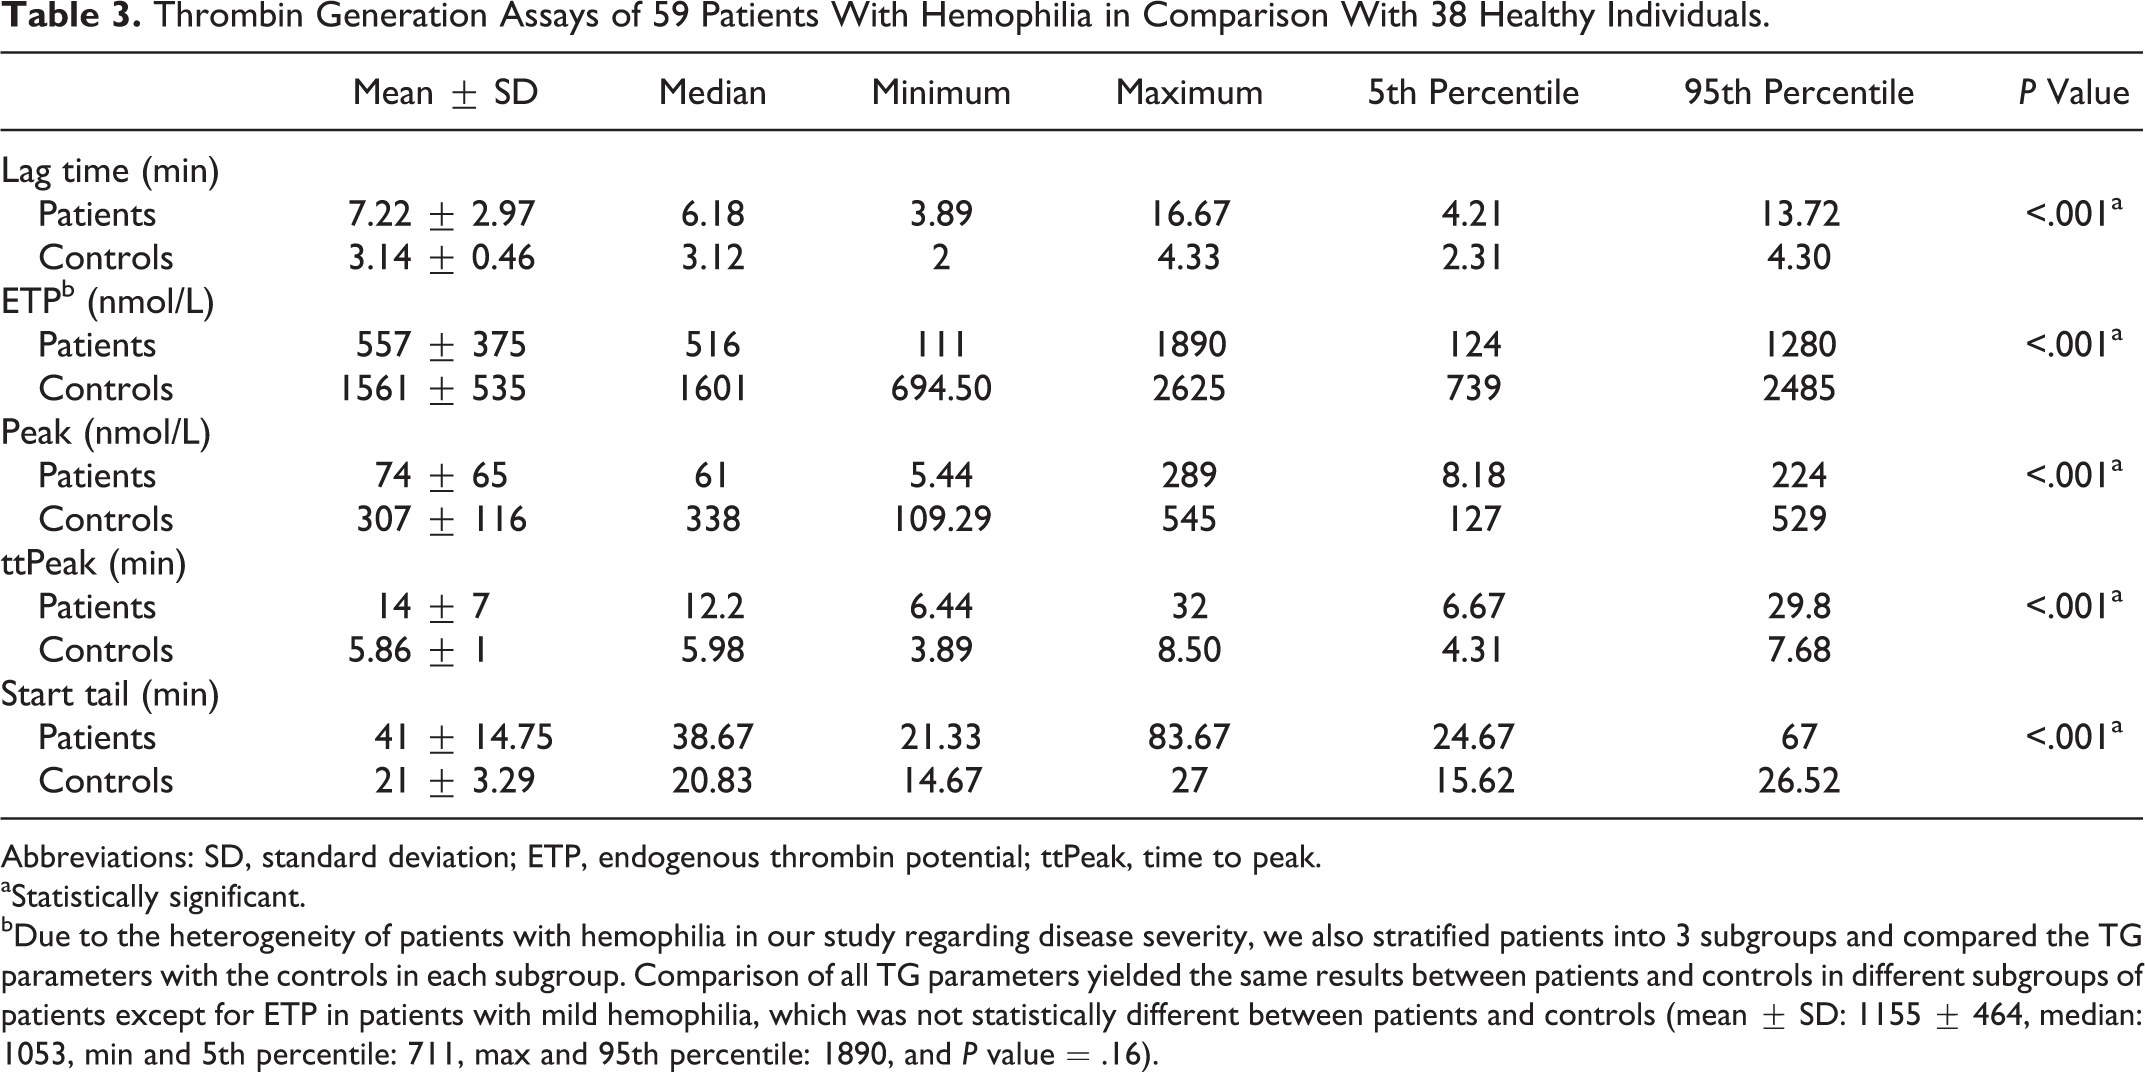
Abbreviations: SD, standard deviation; ETP, endogenous thrombin potential; ttPeak, time to peak.
aStatistically significant.
bDue to the heterogeneity of patients with hemophilia in our study regarding disease severity, we also stratified patients into 3 subgroups and compared the TG parameters with the controls in each subgroup. Comparison of all TG parameters yielded the same results between patients and controls in different subgroups of patients except for ETP in patients with mild hemophilia, which was not statistically different between patients and controls (mean ± SD: 1155 ± 464, median: 1053, min and 5th percentile: 711, max and 95th percentile: 1890, and P value = .16).
Correlation of TG assay parameters with BS in patients with hemophilia is shown in Table 4. A statistically significant positive correlation was found only between BS and lag time (rs = .316, P = .016). All TG parameters except peak showed significant association with disease severity (P < .05). In patients with severe disease, ETP was significantly lower, but the lag time, ttpeak, and start tail were significantly more prolonged than what was determined in the mild and moderate groups (Table 5). All TG parameters except ETP in patients with mild hemophilia were significantly less than those of the healthy controls (P values were .07 for ETP and <.001 for all other parameters).
Correlation of Thrombin Generation Assay Parameters With Bleeding Score in Patients With Hemophilia.
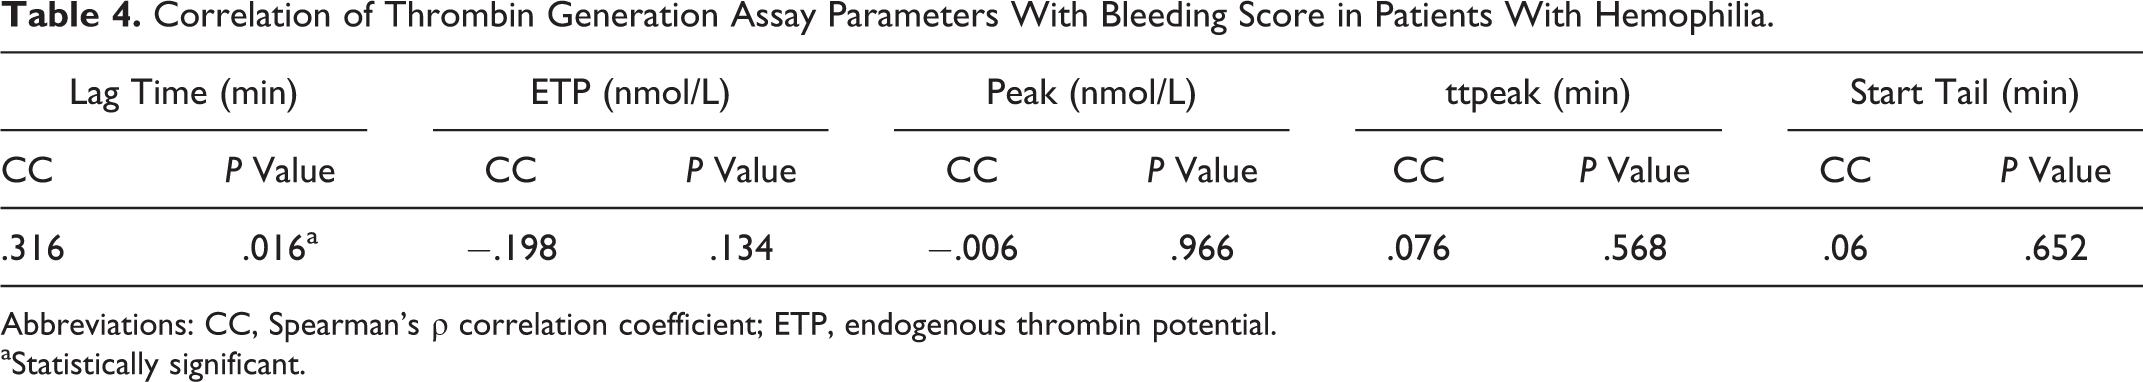
Abbreviations: CC, Spearman’s ρ correlation coefficient; ETP, endogenous thrombin potential.
aStatistically significant.
The Association of Thrombin Generation Parameters With Disease Severity in Patients With Hemophilia.
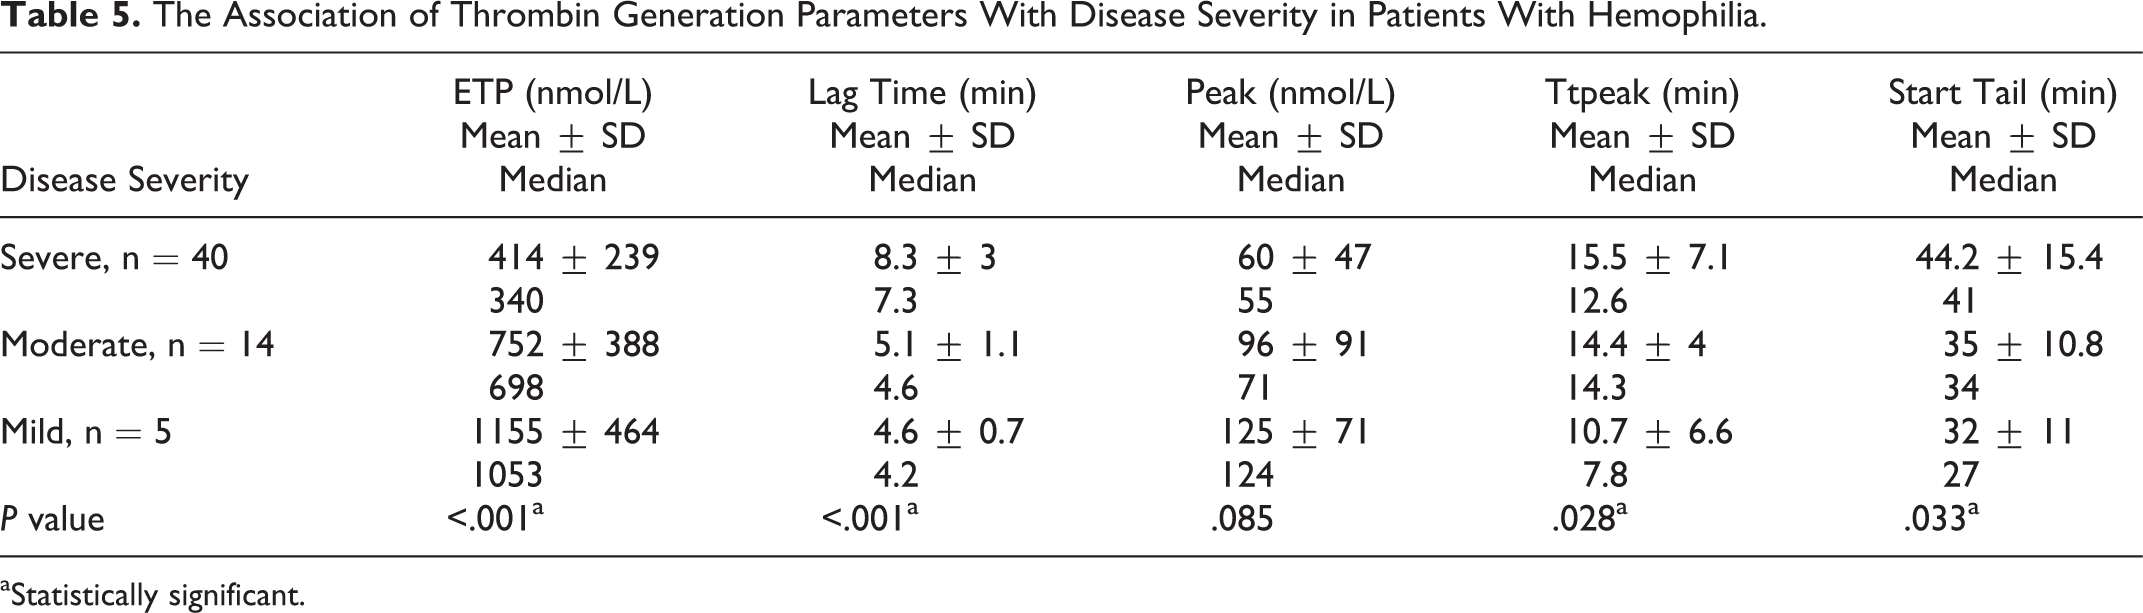
aStatistically significant.
In addition, correlation of each TG parameter was evaluated with factor activity level (Table 6). The ETP showed a significant positive correlation with factor activity level (rs = .459, P < .001). Both lag time and start tail showed significant negative correlations with factor activity level (rs = −.488, P < .001 and rs = −.289, P < .026, respectively).
Correlation of Thrombin Generation Assay Parameters With Factor Activity Level in Patients With Hemophilia.
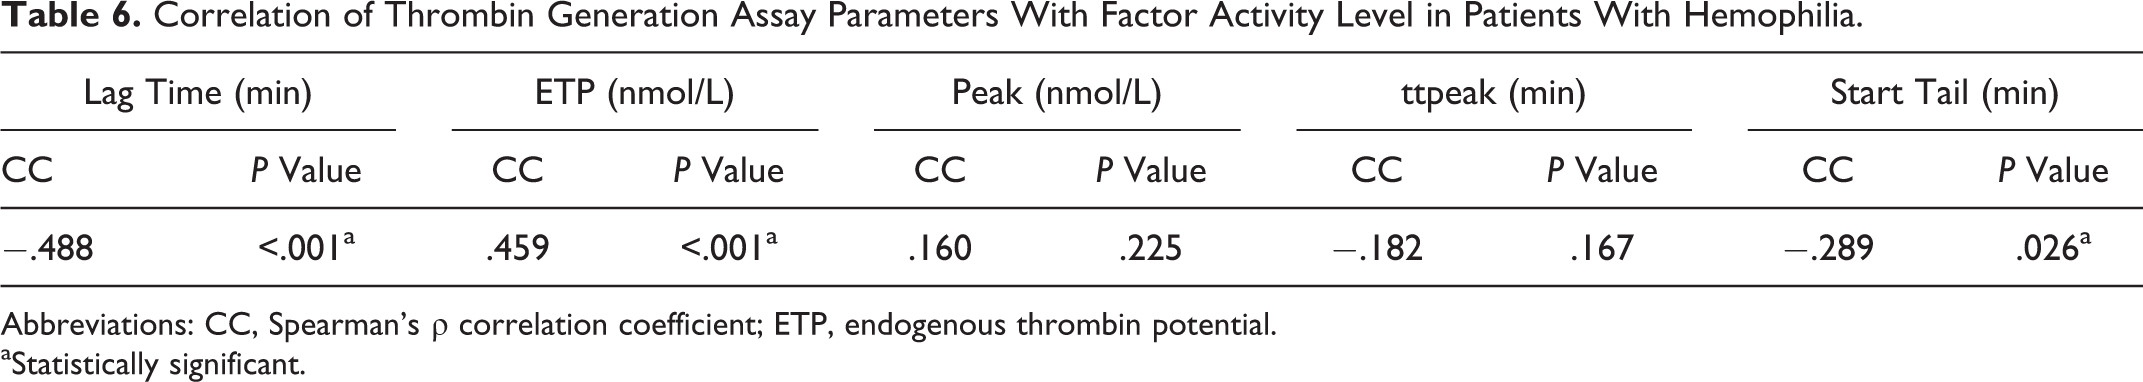
Abbreviations: CC, Spearman’s ρ correlation coefficient; ETP, endogenous thrombin potential.
aStatistically significant.
Discussion
The TG parameters were evaluated in comparison with healthy individuals in patients with hemophilia. Also, the correlation between TG assays with BS and disease severity in patients with hemophilia was determined.
Measuring the global hemostasis capacity rather than isolated factor level is the basis of the new efforts for evaluation of coagulation system in recent years. It is a well-known problem in clinical hematology that hemostasis screening test and the level of the individual clotting factors cannot accurately predict the severity of bleeding tendency in patients with coagulation factor deficiency. Based on the capacity of plasma to generate thrombin in vitro, TG assay can be used as a more precise and comprehensive method than clotting system function test. 5
As expected, compared to the normal controls, significantly lower levels of ETP and peak in patients with hemophilia were detected. On the other hand, significantly more prolonged durations of lag time, ttpeak, and start tail were determined in patients with hemophilia compared to healthy participants. Our results are supported by previous reports that demonstrated reduction in TG in all types of the hemophilias (VIII, IX) as well as in rare bleeding disorders. Also, bleeding tendency was shown to become more prominent when TG decreases by more than 20% of the normal range. 11,13,17,18 Surprisingly all TG parameters except ETP showed this significant pattern in patients with mild hemophilia compared with those of healthy individuals as well. However, we should consider the small number of patients with mild hemophilia in our population (n = 5).
Based on our results, from all TG parameters, only lag time significantly correlated with BS. Beltrán-Miranda et al 3 demonstrated that clinical BS significantly correlated with ETP and peak as these parameters significantly decrease with increasing severity of the disease. They classified clinical severity based on the frequency of hemarthrosis and severity of arthropathy. This discrepancy between our results and theirs may be due to different method of evaluating bleeding symptoms. As mentioned, Tosetto et al 15 questionnaire was used in our study for the evaluation of clinical BS. Tosetto et al evaluated the clinical usefulness of this tool to detect mild bleeding disorders in the general population and concluded that assuming a prevalence rate of 1%, the Negative predictive value (NPV) of BS ≤ 3 as the cutoff value for a normal score was 99.2%. 19 It seems that this questionnaire might not be an appropriate tool for the estimation of clinical BS in patients with hemophilia. Also, Beltrán-Miranda et al 3 stated that variation in disease phenotype might not consistently associate with TG parameters.
On the other hand, in our study all TG parameters except peak showed significant relationship with disease severity. In addition, all TG parameters except peak and ttpeak showed significant correlations with the factor activity level.
There are many reports indicating the association of TG parameters and factor activity level or disease severity. 4,11,20 Matsumoto et al 6 found that TG is useful for monitoring the coagulation function in patients with severe hemophilia A. In a study of TG assays to monitor hemophilia therapy, Váradi et al 21 showed that different factor doses are able to normalize the TG output. Beltrán-Miranda et al reported that peak and rate of TG are more correlated with the factor activity level. 3
Several authors suggested that because TG assays are well correlated with factor activity level and disease phenotype, they can be used more accurately in evaluating patients with hemophilia and better overcome the discrepancy between laboratory tests and clinical severity in these patients. 3,11,22 It can be a better predictor of disease phenotype and a more precise method for decision making regarding the management and prophylactic treatment. 5,23
In conclusion, based on our results, although most of the TG parameters evaluated were not significantly correlated with BS of patients with hemophilia based on Tosetto questionnaire, the majority of TG parameters were significantly associated with factor activity level and disease severity. In patients with hemophilia, plasma factor activity level has a poor predictive value in the evaluation of efficacy of treatment, but it seems that TG assay is an appropriate tool for assessment of global hemostasis and better reflection of clotting function in the management of patients with hemophilia.
Footnotes
Acknowledgments
We would like to thank Shiraz University of Medical Sciences for financial support. Also, we thank Sheryl Nikpoor for editing and improving the use of English in the manuscript .This manuscript is relevant to the thesis of Dr. Asghar Bazrafshan with project number 16215.
Declaration of Conflicting Interests
The author(s) declared no potential conflicts of interest with respect to the research, authorship, and/or publication of this article.
Funding
The author(s) disclosed receipt of the following financial support for the research, authorship, and/or publication of this article: The author(s) received financial support for the research, authorship from Shiraz University of Medical Sciences, and/or publication of this article.