
Abstract
Background:
An explicit approach to warfarin dose adjustment using computerized clinical decision support (CDS) improves warfarin management. We report metrics of quality for warfarin management before and after implementation of CDS in a large health care system.
Methods:
A total of 2591 chronically anticoagulated patients were eligible for inclusion. We compared interpatient time in therapeutic range (TTR) and international normalized ratio (INR) variability before and after implementation of CDS. We report outcomes of major bleeding, thrombosis, and health care utilization.
Results:
Implementation of CDS significantly improved TTR (from 63.99% to 65.13%; P = .04) and reduced out-of-range INRs (from 42.39% to 39.97%; P < .001). Venous thromboembolism (relative risk [RR] 0.41; P < .001) emergency department utilization (RR 0.62; P < .001), and hospitalization (RR 0.62; P < .001) were reduced after CDS implementation. Major hemorrhage was more frequent after CDS implementation (RR 1.42; P = .01).
Conclusion:
The CDS warfarin management was associated with improved TTR and decreased INR variability in a large cohort of chronically anticoagulated patients. Clinically relevant outcomes were broadly improved, although more bleeding events were observed.
Introduction
Warfarin is a difficult drug to manage with a narrow therapeutic window and multiple drug interactions. 1,2 Recent guidelines recommend adoption of a systematic and coordinated approach to warfarin management incorporating international normalized ratio (INR) testing, tracking, follow-up, and good patient communication of dosing decisions. 3,4 Computerized clinical decision support (CDS) improves time in therapeutic range (TTR) and reduces health care cost, 5,6 common markers of value. Broad variability in INR values, measured by the standard deviation of transformed INR (SDTINR) values, is another metric for overall anticoagulation quality. 7
Intermountain Healthcare is a not-for-profit, university-affiliated, integrated health care system with 22 hospitals and more than 150 clinics throughout Utah and Southeastern Idaho, which has been using CDS and electronic medical record (EMR) interrogation to aid in clinical decision making for over 25 years. 8 –10 The value attributable to using CDS for achieving favorable anticoagulation management has been reported by others, 5,11 –13 and we recently reported the broad clinical acceptance of alerts designed to guide optimal warfarin dosing among chronically anticoagulated patients. 14 The EMR for clinical care is known as “HELP2” and serves as the clinical interface to the electronic data warehouse (EDW), which is the comprehensive repository of clinical notes, laboratory results, and radiology studies and allows for clinical charting and real-time messaging. 15,16 Within HELP2 resides a CDS module for anticoagulation management, which is proprietary to Intermountain Healthcare and uses “Foresight” as its platform. 17 This module has been used by a dedicated anticoagulation clinic since 2000 and more contemporaneously by a dedicated clinical pharmacist anticoagulation service. An ongoing process improvement effort within Intermountain Healthcare has endeavored to provide CDS for warfarin management in all outpatient clinics. To date, implementation of the CDS logic has been adopted by over 39 clinics and is used for the routine warfarin management of more than 7000 anticoagulated patients. Because of the progressive adoption of CDS, we proposed that we would be able to identify patients enrolled in CDS and report outcomes of anticoagulation management before and after CDS implementation.
The primary aim of our study was to report a priori whether the adoption of CDS for warfarin management is associated with an improvement in TTR when analyzed in quartiles and a decrease in INR variability defined as the occurrence of INRs less than 1.4 or greater than 4.0. We secondarily wished to report whether CDS implementation affected adverse events, emergency department visits, and hospital admission.
Methods
We performed a retrospective nested cohort study among patients receiving chronic anticoagulation between January 1, 2002, and December 31, 2012, for any indication. Anticoagulation was longitudinally managed within the Intermountain Healthcare system. This study was approved by the Intermountain Healthcare institutional review board, and a waiver of informed consent was obtained. This research received no specific grant from any funding agency in the public, commercial, or not-for-profit sectors.
Patients
The Intermountain Healthcare EDW has over 80 billion rows of data and 9000 data tables, which facilitate comprehensive patient tracking and estimates of real-world efficacy and safety. Intermountain Healthcare’s EDW was queried for all adult patients (≥18 years of age) who received warfarin management and were enrolled in the CDS protocol as potentially eligible for inclusion. To assure that patients included were receiving active chronic therapeutic anticoagulation, all had to have been enrolled in CDS with an indication for chronic therapeutic anticoagulation identified. All patients were receiving warfarin management before and after the implementation of CDS within our system such that the experimental cohort was identical to the control cohort. We required that patients had at least 10 INRs during a minimum of 365 days in the pre-CDS period and at least 10 INRs present during the post-CDS period. Study design is displayed in Figure 1.
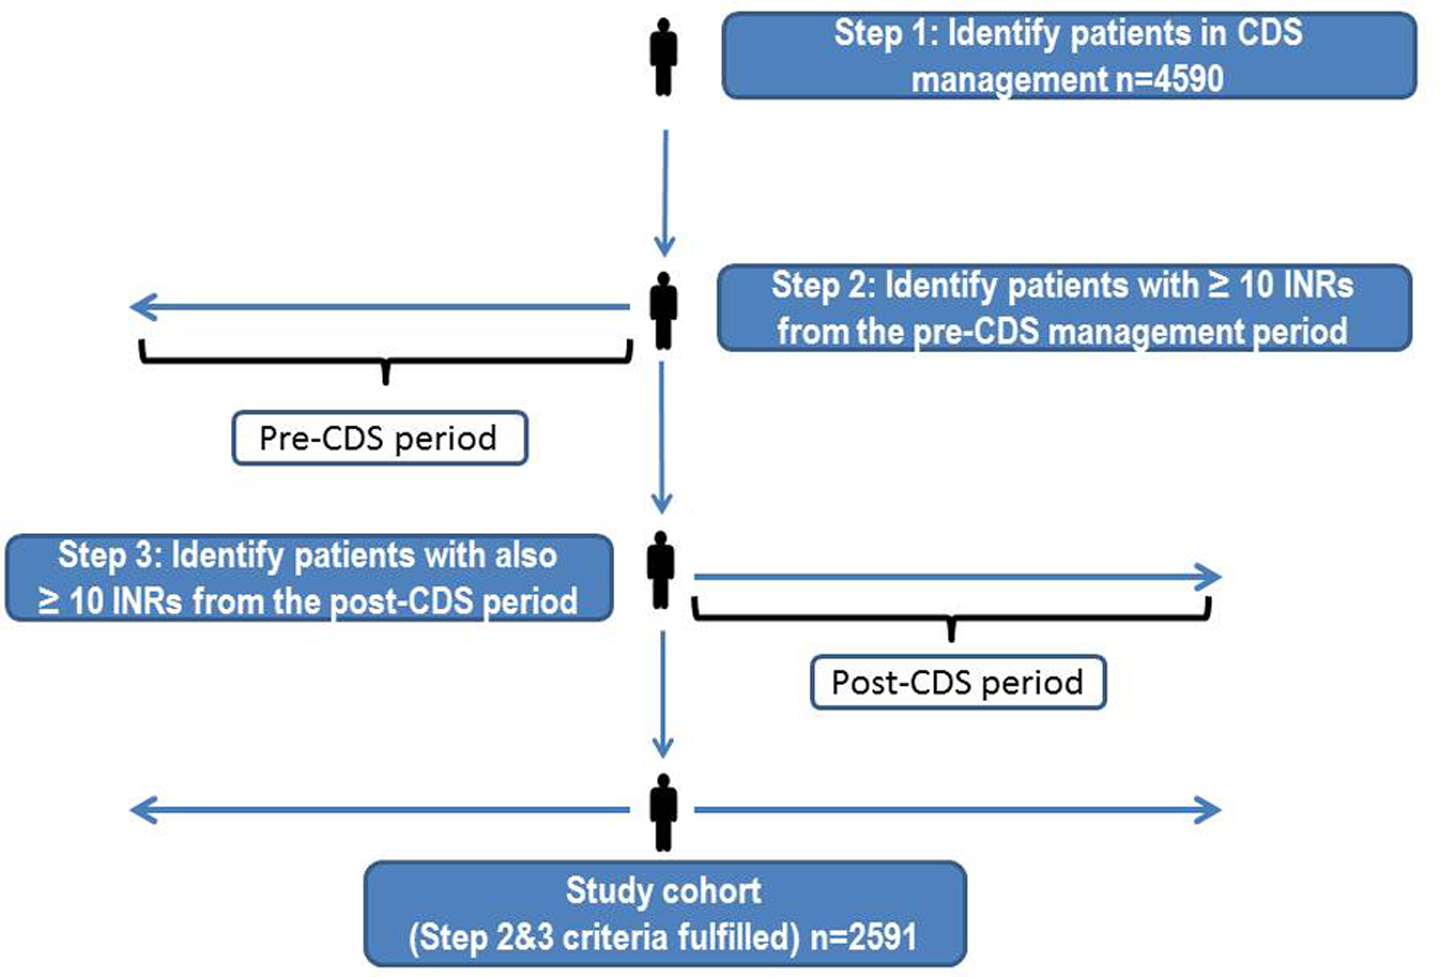
Study design. CDS indicates computerized clinical decision support.
Baseline patient demographics and the prevalence of thrombosis risk factors were determined using EMR interrogation for International Classification of Diseases, Ninth Revision (ICD-9) codes as we have described and previously published. 10 These were recorded if present in the patient medical history at the time of CDS enrollment and are reported in Table 1. The primary indication for anticoagulation and any secondary indications for anticoagulation were identified by EMR interrogation of the anticoagulant therapy note, which requires population of a coded data field to capture the reason anticoagulation is being initiated (Table 2).
Patient Demographics.a
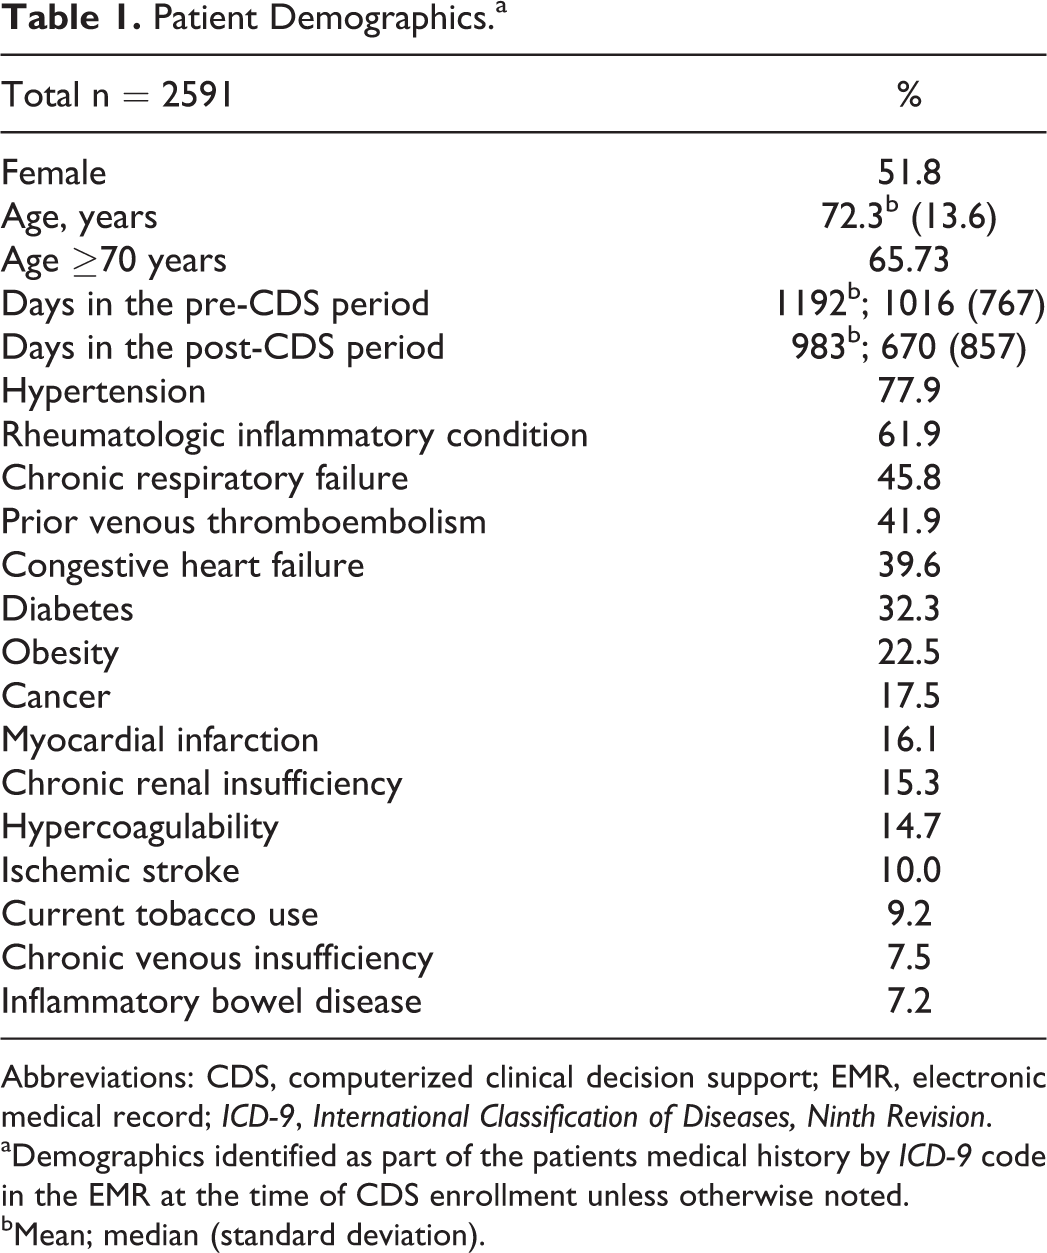
Abbreviations: CDS, computerized clinical decision support; EMR, electronic medical record; ICD-9, International Classification of Diseases, Ninth Revision.
aDemographics identified as part of the patients medical history by ICD-9 code in the EMR at the time of CDS enrollment unless otherwise noted.
bMean; median (standard deviation).
Indication for Anticoagulation.a
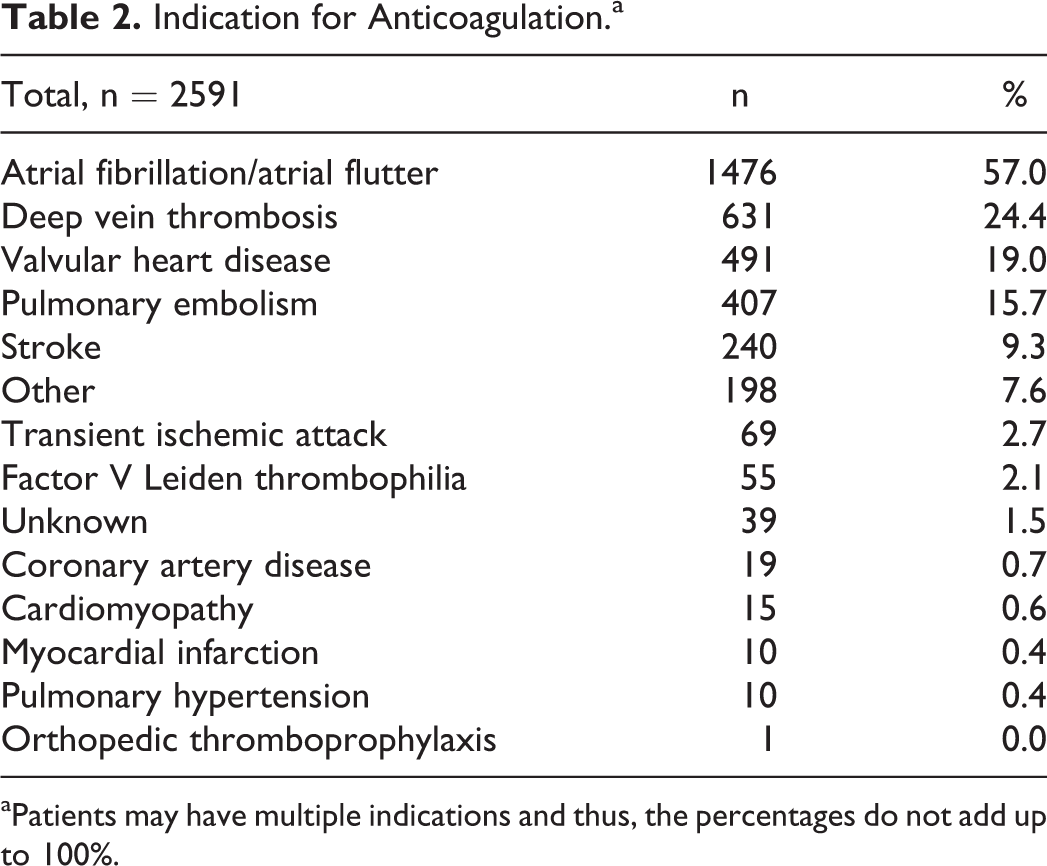
aPatients may have multiple indications and thus, the percentages do not add up to 100%.
A patient identified as requiring anticoagulation management was enrolled in the CDS module within the Intermountain Healthcare EMR. Once enrolled, any patient-specific event (INR laboratory result, failure to present during a predetermined window for a repeat INR assessment) would trigger an alert within the internal messaging system present in the EMR. Each INR would trigger protocol rules every time a new INR resulted with recommendations regarding warfarin dose adjustment and timing for follow-up INR testing based upon the current INR value, the prior INR values, and any interval changes in health status (eg, addition of any new medications or interruption of anticoagulation for a procedure). Follow-up intervals were recommended using embedded logic and predicated upon the INR being in a desirable treatment range (“green zone”) or not (“yellow zone” or “red zone”), and the preceding INRs being in a desirable treatment range or not. 14 Our primary outcome was quality of INR management. We defined quality using 2 metrics. First, we calculated the TTR using the method of linear interpolation described previously. 18 Second, we defined INR variability as the occurrence of INRs less than 1.4 or greater than 4.0 comparing before and after CDS implementation. As such, we are reporting the presence or absence of an INR <1.4 or >4 as a categorical variable (being present or absent). The TTR was calculated during the pre-CDS period beginning with the first INR identified after which all subsequent INRs occurred within 180 days of each other. The post-CDS period was defined as all concomitant INRs beginning 28 days after the patient was enrolled in the CDS to report data attributable to chronic stable warfarin management. Enrollment in the CDS requires a target INR goal be specified. Although patients had different target INR ranges (eg, target INR 2.5; range 2-3 or target INR 3.0; range 2.5-3.5), we were able to report TTR based on individual patient goal ranges. To report INR variability, we identified all INR values < 1.4 or > 4.0 and separated them based on whether they were observed before or after CDS implementation. We chose a priori to report the TTR in quartiles, and variability of INR as a continuous variable. For all study participants with at least 365 days in the post- and pre-CDS period, we report the average aggregate daily frequency of out-of-range INRs defined as the average number of INRs outside the target range on any given during the pre- and post-CDS period.
Secondary outcomes included adverse events meaningful to warfarin management including major bleeding, clinically overt thrombosis, emergency department visits, and hospital admissions identified upon EMR interrogation as we have previously reported. 19 We defined major bleeding by ICD-9 code as bleeding into a critical space including the spinal cord, brain, eye, retroperitoneum, pericardium, or clinically overt bleeding that was associated with the transfusion of ≥2 units of packed red blood cells. 19
To report venous thromboembolism, we applied a natural language-processing program to department of radiology reports for text identifying venous thrombosis using a technique we validated and described. 20,21 To assure that we did not inadvertently capture the incident event that led to application of anticoagulation as recurrent VTE, we applied interrogation for VTE events 7 days after the initial INR was obtained for the pre-CDS period. All VTE events occurring 30 days after the implementation of the CDS logic were attributed to the post-CDS period.
To identify patient presentation to the emergency department and hospital admission, we electronically cross-referenced all patients of interest with the case mix summary that logs every unique patient’s emergency department visit and hospitalization in the EDW. The EDW is where any emergency department visit or hospitalization within the Intermountain Healthcare system can be found.
Statistical Methods
Summary statistics were computed using frequencies and proportions for categorical variables and means, medians, and standard deviations to describe continuous variables within the study population. Change scores for each outcome parameter (including TTR%, number of out of range INRs, and total number of INRs performed per year) were compared among the pre- and post-CDS periods by paired t test. It was determined that the number of INRs <1.4 or >4.0 was not normally distributed due to many patients having zero INRs outside these thresholds. Due to this skewed distribution, a Wilcoxon signed rank test was utilized to compare differences in INR variability defined as the occurrence of INRs <1.4 or >4.0 during the study periods. A McNemar test was used to compare proportional differences among TTR% thresholds (TTR 0%-29%, 30%-49%, 50%-59%, and ≥60%). Incidence rates (#events/100 patient-years) and corresponding 95% confidence intervals were utilized to test the association of CDS and adverse events within the study period. A relative risk (RR) ratio was computed to determine the probability of an event occurring during the post-CDS period in comparison to the pre-CDS period. All statistical tests were performed using Stata 12.0 (StataCorp, College Station, Texas).
Results
Patient demographics are reported in Table 1. Among the 2591 patients enrolled in our study, 67 473 INR tests were performed. Patients spent a mean duration of 3.3 years in the pre-CDS period and 2.7 years in the post-CDS period. The mean TTR during the pre-CDS period compared with the post-CDS period was 63.99% versus 65.13%, respectively (P < .04; Figure 2). The TTR differed significantly between the pre-CDS and post-CDS periods for the lowest (19.3% vs 5.2%) and third (4.7% vs 15.5%) quartiles of patients (Figure 3). The number of per-patient INRs <1.4 or greater than >4.0 during the pre-CDS period was greater than that observed during the post-CDS period (0.9 vs 0.8; P < .02; Table 3). For all study participants with at least 365 days in the pre- and post-CDS period, the average aggregate daily frequency of out-of-range INRs was 105.07 ± 26.81 for the pre-CDS period and 86.71 ± 22.45 during the post-CDS period (P < .0001; Figure 4). That is to say, during the year prior to the implementation of CDS, the average number of INRs outside the target range for the study cohort on any given day was 105, whereas during the post-CDS period this number was 87.
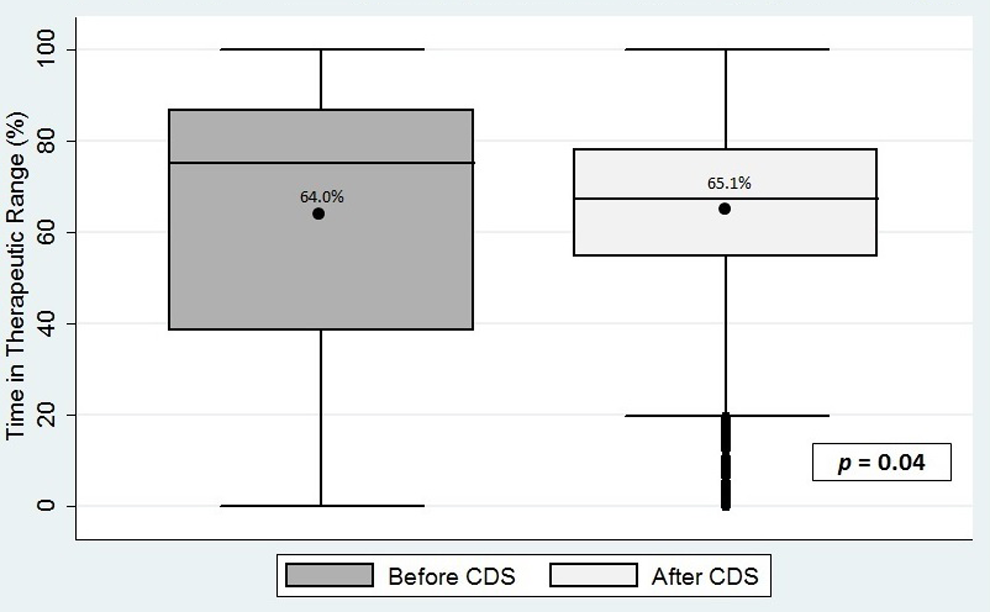
Time in therapeutic range before and after implementation of computerized clinical decision support. *Dot within rectangle indicates the mean; top of rectangle indicates 75th percentile; bottom of the rectangle indicates the 25th percentile; horizontal line within rectangle indicates the 50th percentile; whiskers extending from the top or bottom of the rectangle indicate the maximum and minimum values respectively; dots below whiskers indicate outliers, which are numerically distant from the rest of the data; P = .04 reflects the difference between the mean TTR reported; pre-CDS median TTR = 75.1%; post-CDS median TTR = 67.4%. CDS indicates computerized clinical decision support; TTR, therapeutic range.
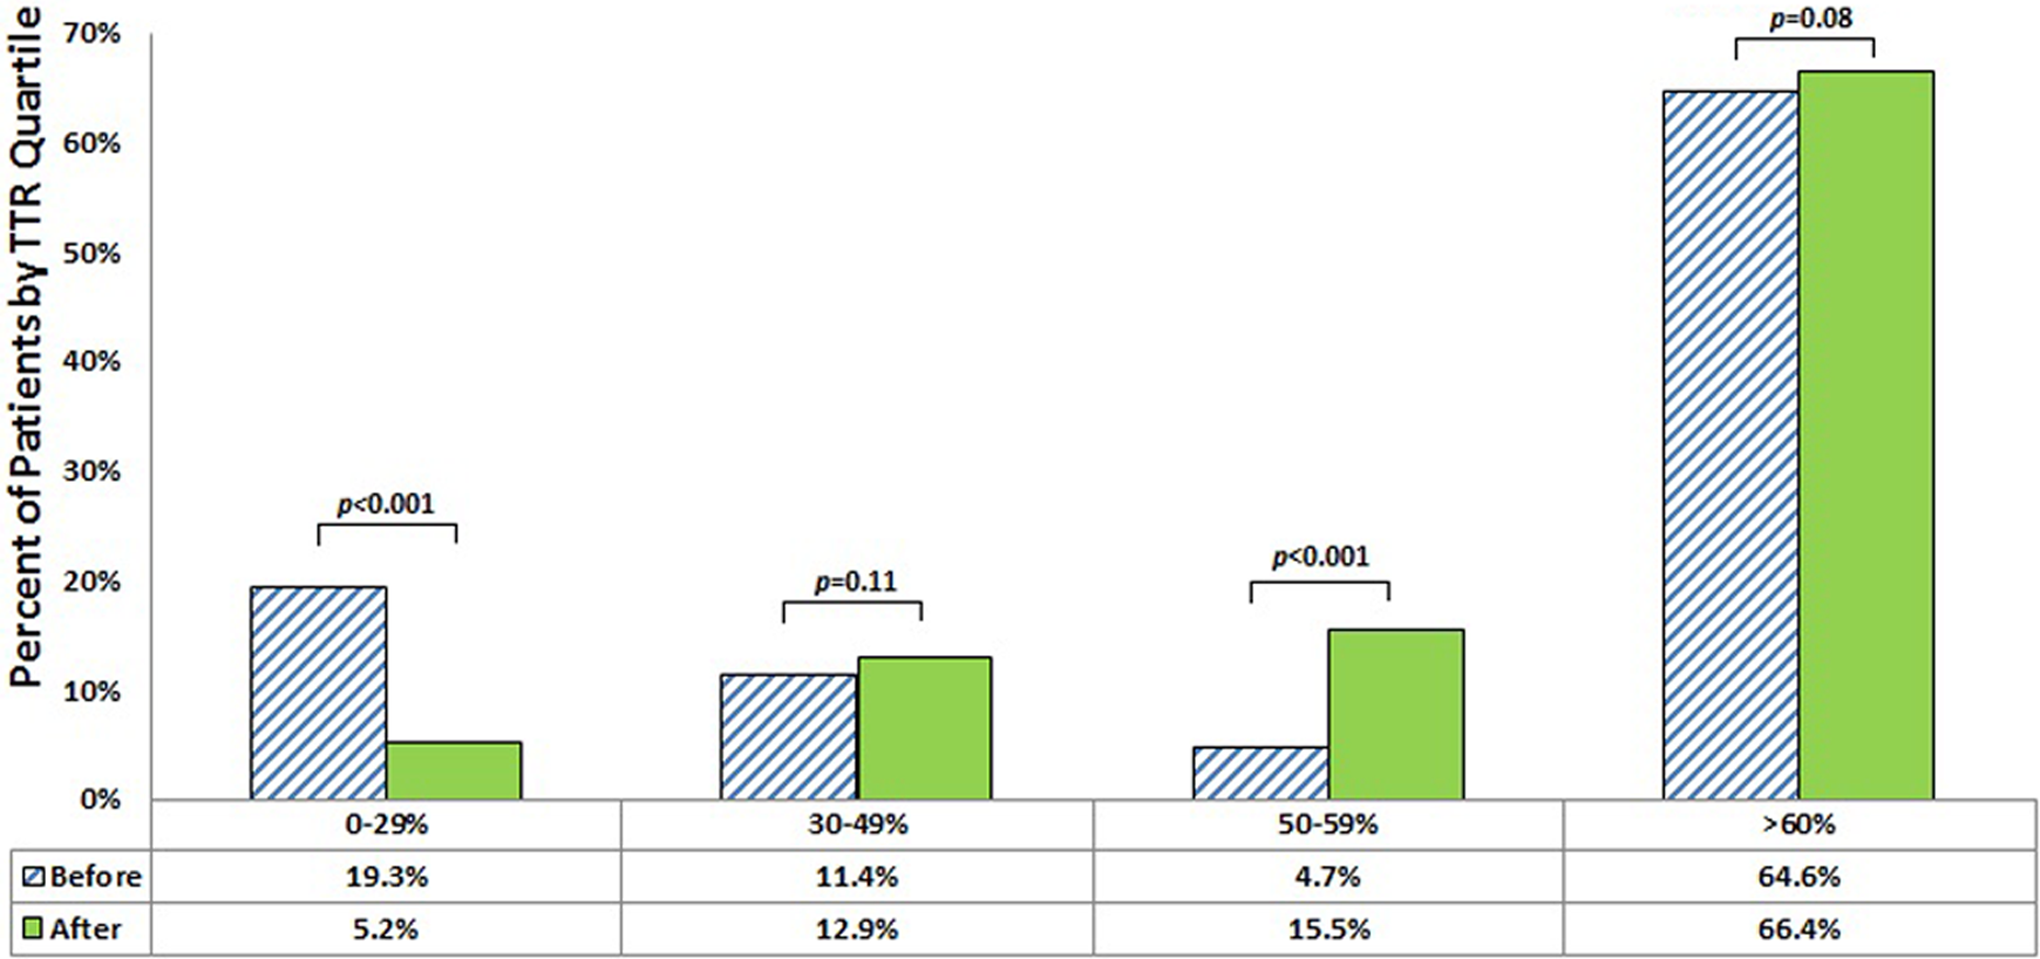
Distribution of patients by quartile of time in therapeutic range before and after implementation of clinical decision support.
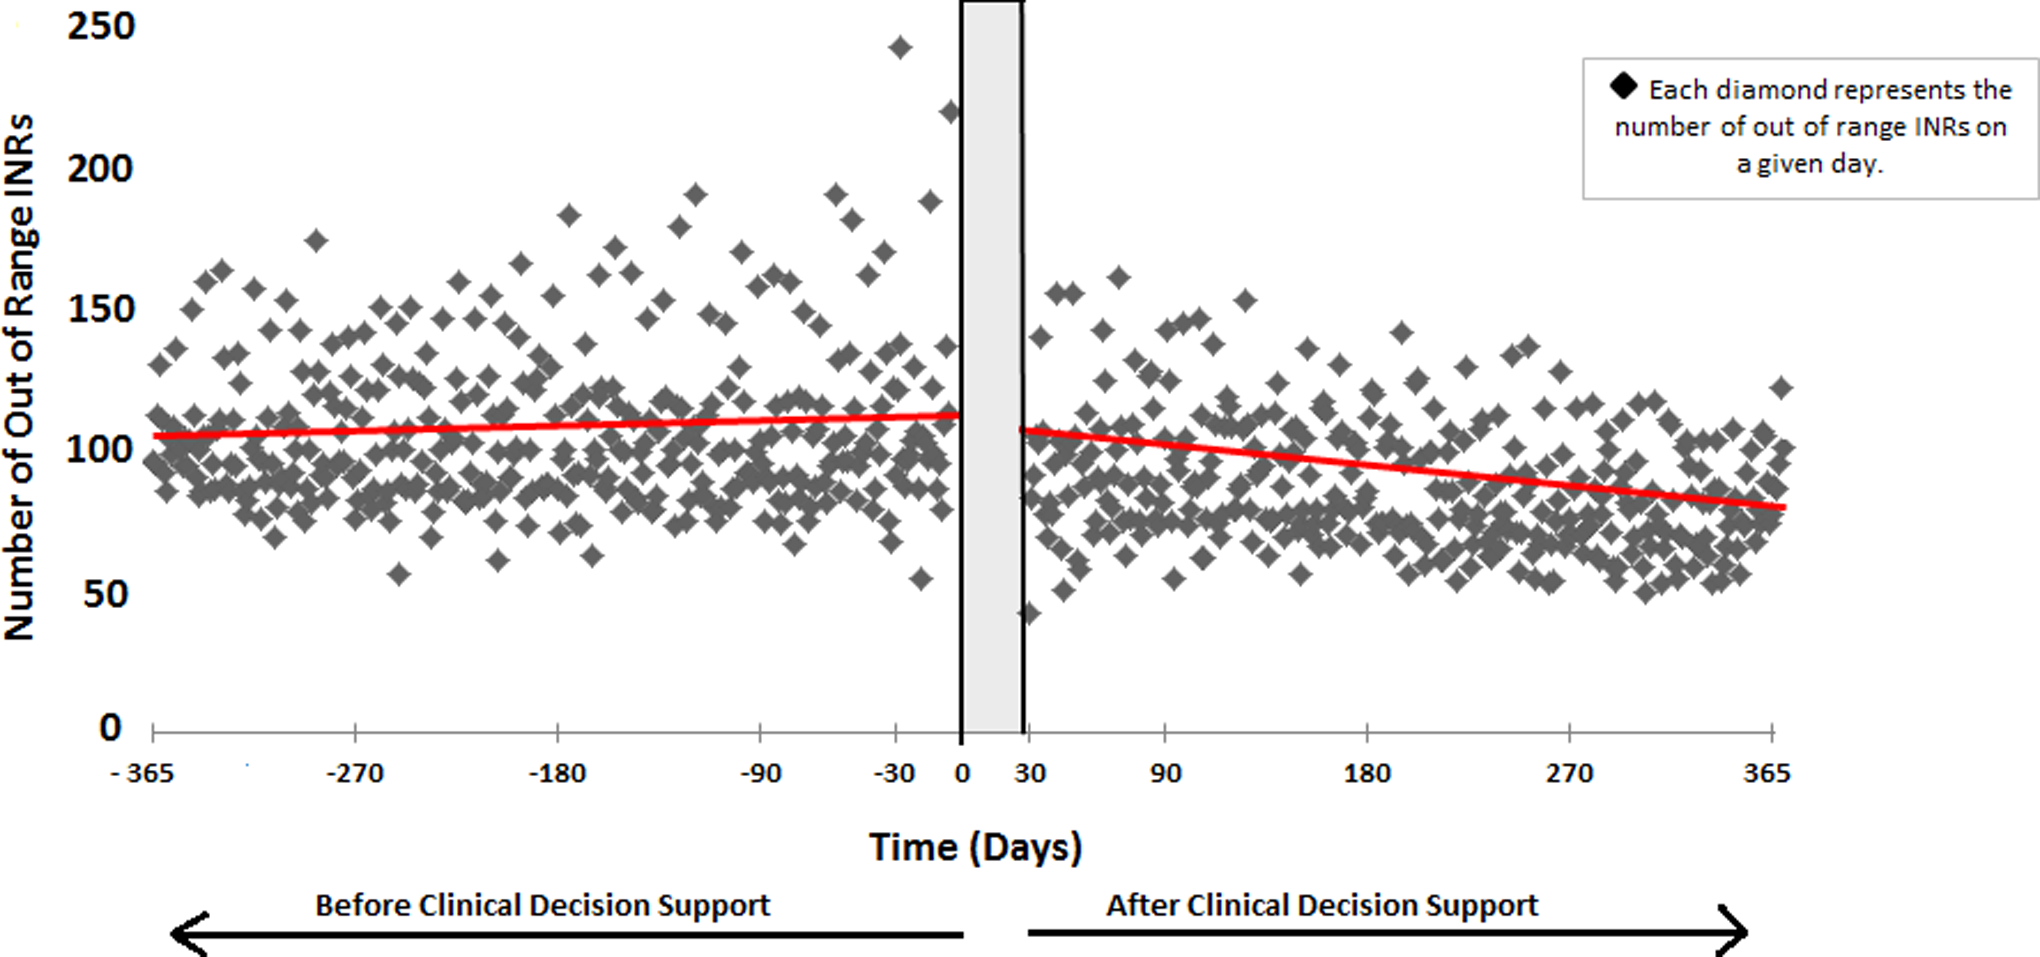
Average aggregate daily frequency of out-of-range INRs for 1 year before and after implementation of computerized clinical decision support. The line represents the slope of out of range INRs graphically displayed over time. INR indicates international normalized ratio.
Outcome Comparison of Pre-CDS With Post-CDS period.
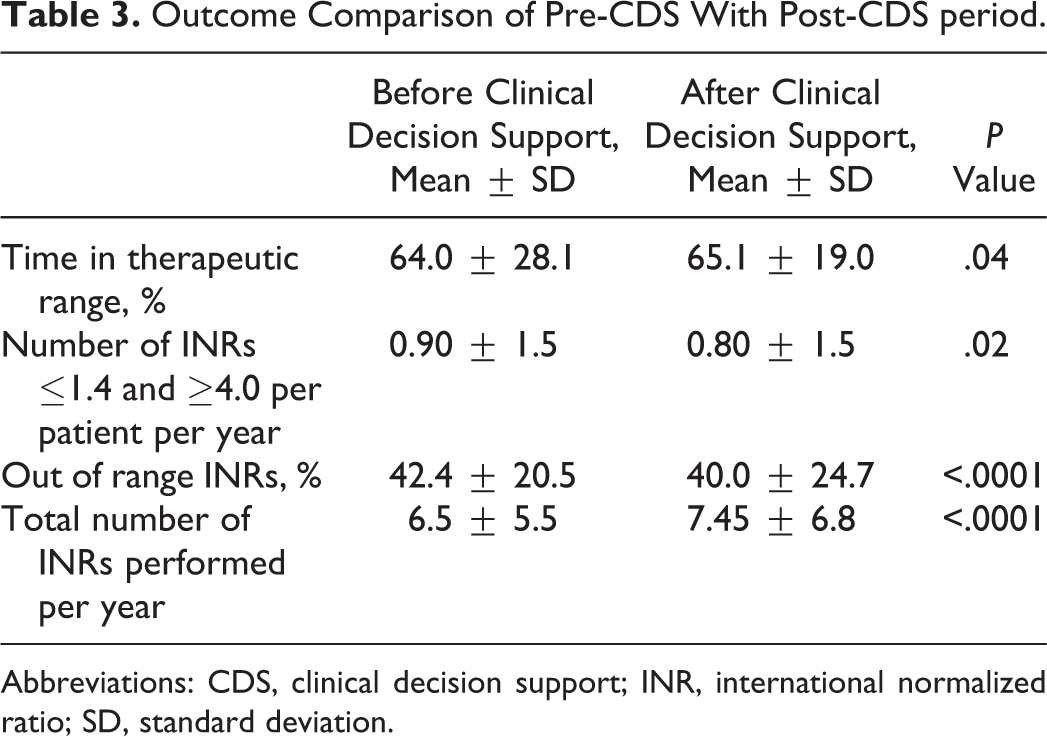
Abbreviations: CDS, clinical decision support; INR, international normalized ratio; SD, standard deviation.
Secondary outcome results are found in Table 4. All secondary outcomes are reported in events per 100 patient-years. Fewer outcomes of venous thromboembolism, emergency department visits, and hospitalizations occurred during the post-CDS period compared with the pre-CDS period. The RR of venous thromboembolism was 0.41; P < .001. The RR of pulmonary embolism was 0.32; P < .001. The RR for an emergency department visit for any reason was 0.62; P < .001. The RR for hospitalization for any reason was RR 0.62; P < .001. The RR for major bleeding during the post-CDS period compared with the pre-CDS period was 1.43; P = .01.
Secondary Outcomes.
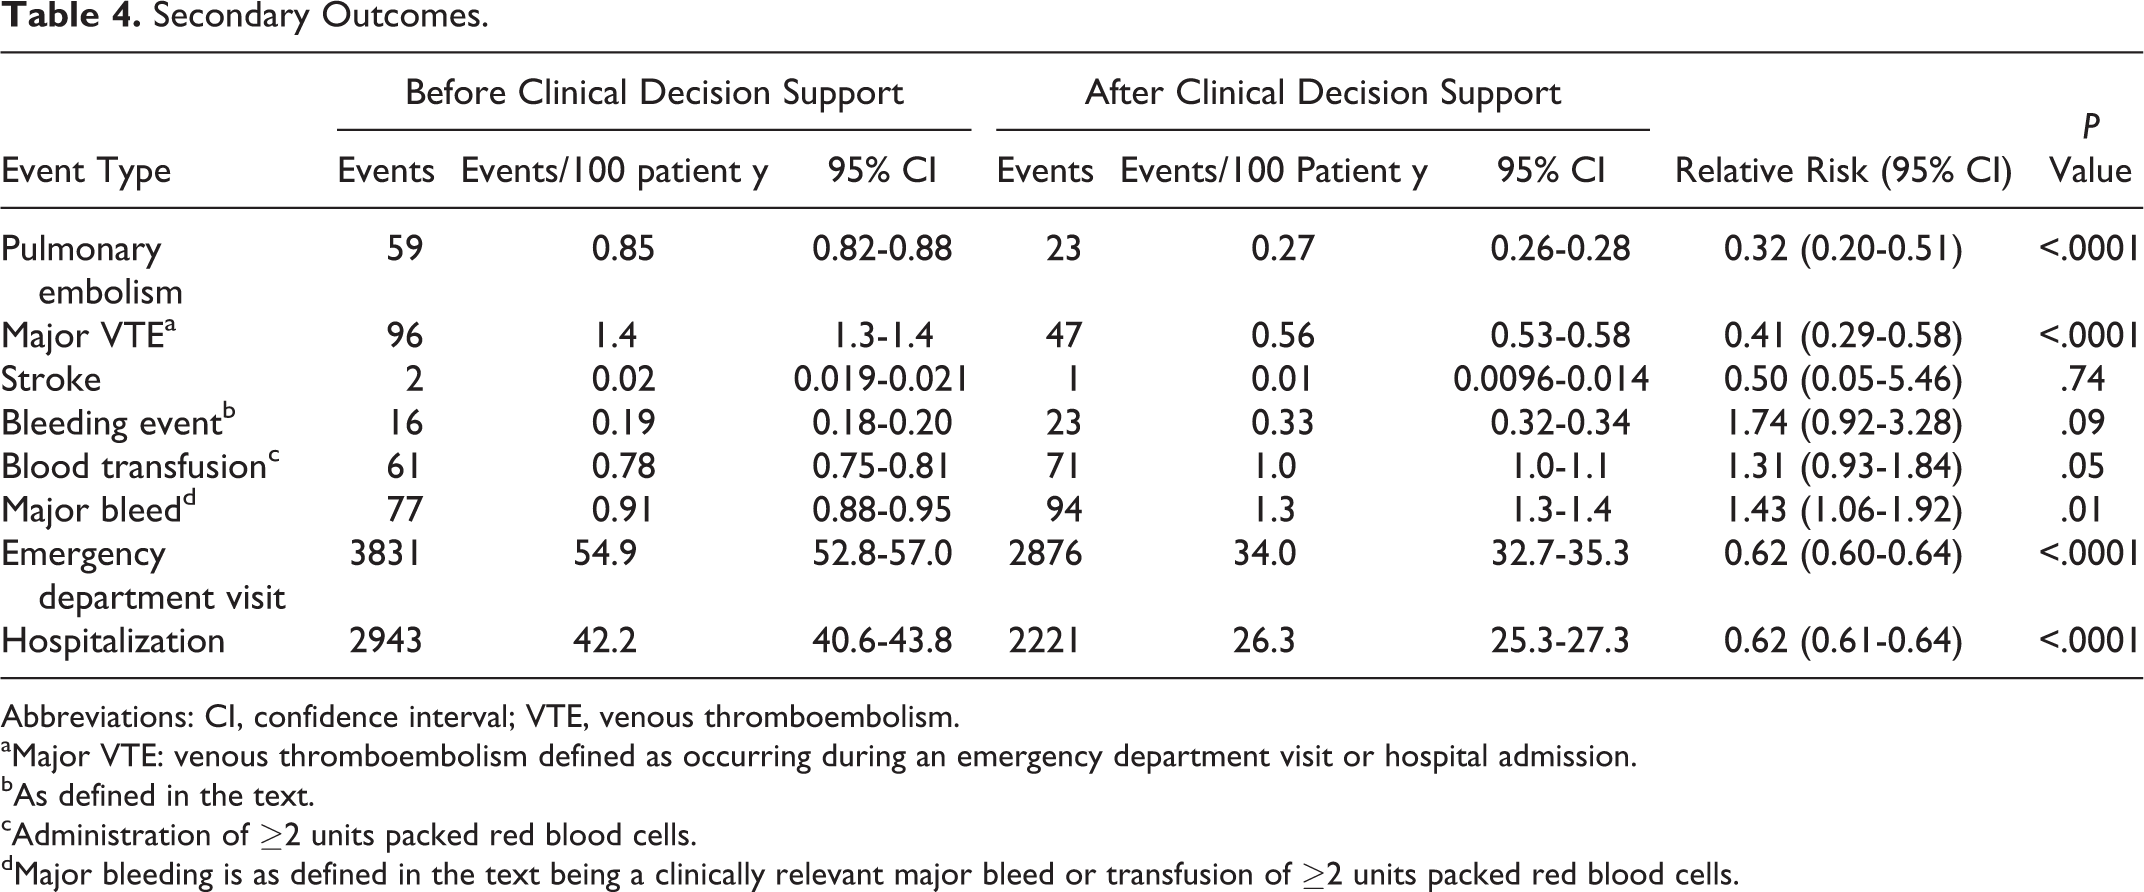
Abbreviations: CI, confidence interval; VTE, venous thromboembolism.
aMajor VTE: venous thromboembolism defined as occurring during an emergency department visit or hospital admission.
bAs defined in the text.
cAdministration of ≥2 units packed red blood cells.
dMajor bleeding is as defined in the text being a clinically relevant major bleed or transfusion of ≥2 units packed red blood cells.
Discussion
We observed that the introduction of computerized CDS improved TTR and decreased INR variability among chronically anticoagulated patients. The pre-CDS cohort included patients who would be broadly characterized as already receiving stable warfarin therapy, therefore a limited effect as we observed would not be unexpected upon implementation of a CDS rule. We also acknowledge that for a time prior to the implementation of CDS (early 2000 through January 1, 2002), a paper-based CDS algorithm was used in our dedicated chronic anticoagulation clinic to provide standardized warfarin dose adjustment, which likely enhanced TTR and decreased INR variability during the pre-CDS period. Although we observed a modest effect on TTR with an absolute increase of 1.14% (P = .04) among the cohort as a whole, an important improvement occurred among those patients for whom INR control was poorest in the lowest quartile (TTR 0%-29%; Figure 3). So too, intrapatient INR variability was significantly decreased as visually represented in Figure 4. This is meaningful, given evidence suggesting that variability in patient INR values is associated with unfavorable clinical outcomes. 7
Secondary outcome observations include a significant reduction in all-cause venous thromboembolism and pulmonary embolism. The 68% and 59% relative risk reductions in pulmonary embolism all-cause VTE, respectively, are highly favorable. Our observations are consistent with the reports that suggest better warfarin management reduces recurrent thrombosis. 22,23 Although we identified few major bleeding events, an overall major bleeding event rate (in both the pre- and post-CDS groups) that was significantly lower than the rate recently reported in the warfarin arm of a study comparing warfarin to dabigatran etexiliate, 24 and no difference in the rate of discreet bleeding events, we did observe a significant increase in the composite outcome of major bleeding (bleeding events in addition to transfusion of packed red blood cells) in the post-CDS period. This is probably due in part to a significantly greater proportion of patients being more effectively anticoagulated as demonstrated in the first column of Figure 3. So too, the explicit follow-up promoted by the CDS protocol likely led to a heightened vigilance and reporting of bleeding events (reporting bias). This observation of a higher rate of bleeding in the setting of a greater proportion of the population being anticoagulated is not unexpected and is described by others. 25 –27 However, we acknowledge that uncertainty exists regarding our interpretation of the observed increase rate of bleeding in the post-CDS period.
We report a 38% reduction in both emergency department visits and hospitalizations. Routine follow-up provides an opportunity for patients to express symptoms of disease that may lead to an outpatient evaluation and obviate an emergency department visit or hospitalization. We hypothesize this observation is attributable to routine clinical follow-up promoted by the CDS, although we cannot assure that this is not due in part to a secular trend. Historically, it has been difficult to capture the cost savings attributable to superior warfarin management because of the difficulty in identifying savings from prevented adverse events. Should these preliminary observations be confirmed in a prospective controlled study, one collateral benefit to CDS warfarin management may be cost savings from reducing costly emergency department visits and hospitalizations.
Strengths of this study include our ability to include only patients for whom pre-/post-CDS INR data were reliably available over a long period of time, our study cohort serving as the control, our use of a comprehensive EDW to identify outcomes of interest, and the large number of patients included. Weaknesses of our study include those inherent in the retrospective design, the influence of secular trends on the observed event rates, and our inability to report the indications for emergency department visits and indications for hospitalization. We also acknowledge limitations of the pre/poststudy design exist including the possibly of carryover bias and residual effect bias effecting outcomes observed, although we did employ a “wash-out period” including data only 1 month after adoption of the CDS in an effort to mitigate to possible carryover bias and residual effect bias.
Conclusion
In a large cohort of chronically anticoagulated patients, we observed that the adoption of CDS warfarin management improved TTR and decreased INR variability. We observed CDS management was associated with a significant reduction in venous thromboembolism and costly resource utilization including emergency department visits and hospitalization, although more bleeding events occurred. Because CDS warfarin management is part of routine work flow and housed within our EMR, it occurs per routine clinical care at a minimal additional cost.
Footnotes
Declaration of Conflicting Interests
The author(s) declared no potential conflicts of interest with respect to the research, authorship, and/or publication of this article.
Funding
The author(s) received no financial support for the research, authorship, and/or publication of this article.