
Abstract
Background:
Enzyme-linked immunosorbent assay (ELISA) for antiplatelet factor 4 (anti-PF4)/heparin antibodies is expressed in terms of optical density (OD). Previous studies have shown correlation between OD and heparin-induced thrombocytopenia (HIT) diagnosis. However, these were mainly laboratory based.
Objective:
Retrospective correlation of clinical HIT to ELISA OD.
Patients/Methods:
We conducted a retrospective study involving 104 patients with a positive ELISA for anti-PF4/heparin antibodies between 2008 and May 2012. For each patient, a clinical diagnosis was adjudicated based on different features including “4T scores,” laboratory results, and a 3-month clinical follow-up.
Results:
In this study, 28.8% of the patients were HIT positive, and 71.2% HIT negative. Patients with positive diagnosis had significantly higher mean OD (2.15 ± 0.76 vs 0.83 ± 0.62). Patients with OD <1.0 only had 3.4% positive diagnosis versus 45.5% for OD 1.0 to 2.0 and 78% for >2.0 units.
Conclusion:
This study is a clinical confirmation that ELISA OD results are correlated with the probability of a clinical diagnosis of HIT.
Background
Heparin remains widely used. However, it is associated with a serious complication, heparin-induced thrombocytopenia (HIT). Heparin-induced thrombocytopenia is an immune-mediated process secondary to the formation of antibodies that recognize platelet factor 4–heparin (PF4/heparin) complexes. 1 –8 This leads to platelet activation and is associated with a very strong risk of thrombotic events. It has been shown that approximately 8% of medical patients exposed to heparin will develop antibodies against PF4/heparin complexes, 9 but this can be as high as 15% to 20% in cardiac surgery patients. 10,11 About 1% to 5% of patients exposed to heparin will develop thrombocytopenia, rates being higher for unfractionated heparin than low-molecular-weight heparin. 12 –19 Of all patients diagnosed with HIT, 20% to 50% will have venous or arterial thrombosis. 9,20 –22 The clinical diagnosis of HIT is challenging as hospitalized patients can develop thrombocytopenia from a diversity of causes.
Heparin-induced thrombocytopenia diagnosis is primarily based on the clinical criteria (“4T score”) 23 and several laboratory tests, such as the enzyme-linked immunosorbent assay (ELISA) for anti-PF4/Heparin antibodies. Functional assays, which include the serotonin-release assay (SRA) and the heparin-induced platelet aggregation, are also commonly used. 24,25 Serotonin-release assay is considered a gold standard among the diagnostic tests. It has been validated in randomized trials, and its specificity and sensitivity have been shown to be very strong. 9,26,27 However, it is associated with high cost and is technically very demanding. Thereby, the SRA is not widely available, mostly being performed in specialized centers. In addition to SRA, an ELISA immunoassay can be used to detect anti-PF4/heparin antibodies in the patient’s serum. The results are expressed in terms of optical density (OD), which corresponds to the antibody’s concentration. The positive threshold of this test in most commercially available kits is usually in the vicinity of an OD of 0.4 units. The ELISA is an easy and widely available technique. The sensitivity of the test is very good, varying from 91% to over 97% in the previous studies. 28 –31 However, its positive predictive value has been shown to be as low as 50% in some series. 24,29,32,33
Several studies have shown that higher OD results were more likely to be associated with platelet-activating antibodies, as defined by the SRA. 24,25,30,34 However, these were mainly laboratory based. Warkentin et al have correlated the level of OD with the likelihood of a positive SRA result. 35 According to their results, an OD below 1.0 indicated a low probability of HIT (less than 5% of positive diagnosis). In addition, the probability of HIT reached 50% only when OD was above 1.40. Baroletti et al 13 examined the risk of developing thrombosis in 318 patients with suspected HIT and positive ELISA. The authors showed that incidence of thrombosis increased from 19% to 32% with OD thresholds above 1.0 and 2.0, respectively.
The goal of this study is to correlate OD levels with the probability of clinical HIT diagnosis. In contrary to the previous studies where the diagnosis of HIT was based on laboratory findings, we have defined HIT based on the strength of the original diagnosis, the retrospective adjudication performed by 1 or 2 clinicians familiar with HIT diagnosis, the absence of thrombosis, and the absence of a clearly identified alternative diagnosis for the thrombocytopenia.
Methods
This retrospective study was approved by the CHUM (Montreal University Hospital Center) ethic and scientific boards. A database from the CHUM’s hemostasis laboratory was utilized in order to identify all the patients between January 2008 and May 2012 who tested positive for anti-PF4/heparin antibodies. The assay was prospectively performed as clinically indicated using a commercial, nonimmunoglobulin G specific, ELISA kit (Asserachrom HPIA-IgG (Cat. Nr. 00624) Stago, France) throughout the study period. According to this technique, the OD threshold measurement varies slightly with every run and is based on the values obtained with control samples. The positive threshold thus varies from 0.4 by approximately ±10%. This threshold value is thus defined as the baseline threshold (BT) throughout this article.
The decision to test each patient was made at the discretion of the treating physician during hospitalization. For patients who were tested more than once during their medical admission, only the initial test result was included in this study. This study included only patients who were hospitalized at the CHUM. An extensive chart review was performed from the day of admission and for a period of 3 months following the positive ELISA. Data from inpatient and outpatient progress notes were included in the analysis. No direct contact was made with the patients. Data collected from the medical records included medical service, reason of admission, new medication that can cause thrombocytopenia, platelet count at the admission, date of platelet count decline, platelet count nadir, date of positive ELISA, date and types of heparin administration, thrombotic event, bleeding, and immunological reaction associated with heparin administration. Follow-up data were also collected, including venous and arterial thrombosis, pulmonary embolism, amputation, platelet count increase and normalization, whether or not the patient was treated with another anticoagulant, whether or not heparin was stopped or restarted and what happened with the platelet count in this situation, death and cause of death. All documented cases of venous thrombosis were confirmed by radiological testing. A clinical suspicion of thrombosis alone was not considered positive. The final diagnosis (HIT positive or HIT negative) received from the treating team was noted. When available, confirmatory tests using SRA were also included in the data collection but were not used as a criterion to define clinical HIT.
Data Analysis
For each patient that was included in the study, 2 pretest probability scores (“4T score” and HIT expert probability scores) were calculated. To be considered as a possible HIT, patients had to meet clinical criteria consistent with the “4T score”: platelet count fall of at least 30%, onset after day 5, or within 24 hours with prior heparin exposure, thrombotic event, or systemic reaction during heparin injection, and the absence of other definite cause of thrombocytopenia.
Other criteria that were consistent with HIT included time of platelet count decrease and its nadir, improvement in platelet count recovery after heparin withdrawal, time point when ELISA was performed, absence of other cause of thrombocytopenia or thrombosis that was identified during the admission, and positive SRA. When HIT was of low probability and another cause of thrombocytopenia was judged to be more plausible, the patient was considered as HIT negative.
According to the 3-month clinical evolution and the laboratory results, a final, clinical, retrospective diagnosis was made for each patient (which was either HIT positive or HIT negative).
During the process of data collection, the result of anti-PF4/heparin antibody assay was documented only after the final diagnosis was made. For patients in whom the diagnosis was unclear, a second review was performed. In this situation, the OD result was hidden from the second examiner. The medical record was then reviewed, and a final diagnosis was adjudicated.
Study Power and Statistical Analysis
With a presumed ratio of HIT negative/positive of 4:1 (ie, approximately 20% of patients with positive ELISA are HIT positive), at least 35 patients were needed in order to have 85% power to demonstrate a difference in OD of 1.4 between the 2 groups. These numbers were based on the data from the previous studies. However, the goal of this study was to include every eligible patient between January 2008 and May 2012.
Optical density differences between our study groups where calculated using the unpaired t test. A linear regression curve was performed using the values of OD and “4T score.” A receiver–operator curve (ROC) between OD and clinical diagnosis was used in order to estimate specificity and sensitivity of the anti-PF4/heparin assay.
Results
A total of 104 patients were included in this study. By definition, all these patients had a positive ELISA for anti-heparin/PF4 antibodies. Of these, 30 (28.8%) were considered as HIT positive, and 74 (71.2%) as HIT negative. A majority (51%) of patients were hospitalized in medicine or general surgery wards. In all, 28 (26.9%) patients came from cardiac surgery units and 23 (22.1%) from intensive care units. Other demographic and clinical parameters can be seen in Table 1. Patients who had a cardiac surgery during their admission had a much higher mean OD than other patients (1.76, standard deviation [SD] ± 0.96 vs 1.02, SD ± 0.77, P < .001).
Characteristics of Patients According to Different Demographic and Clinical Parameters.
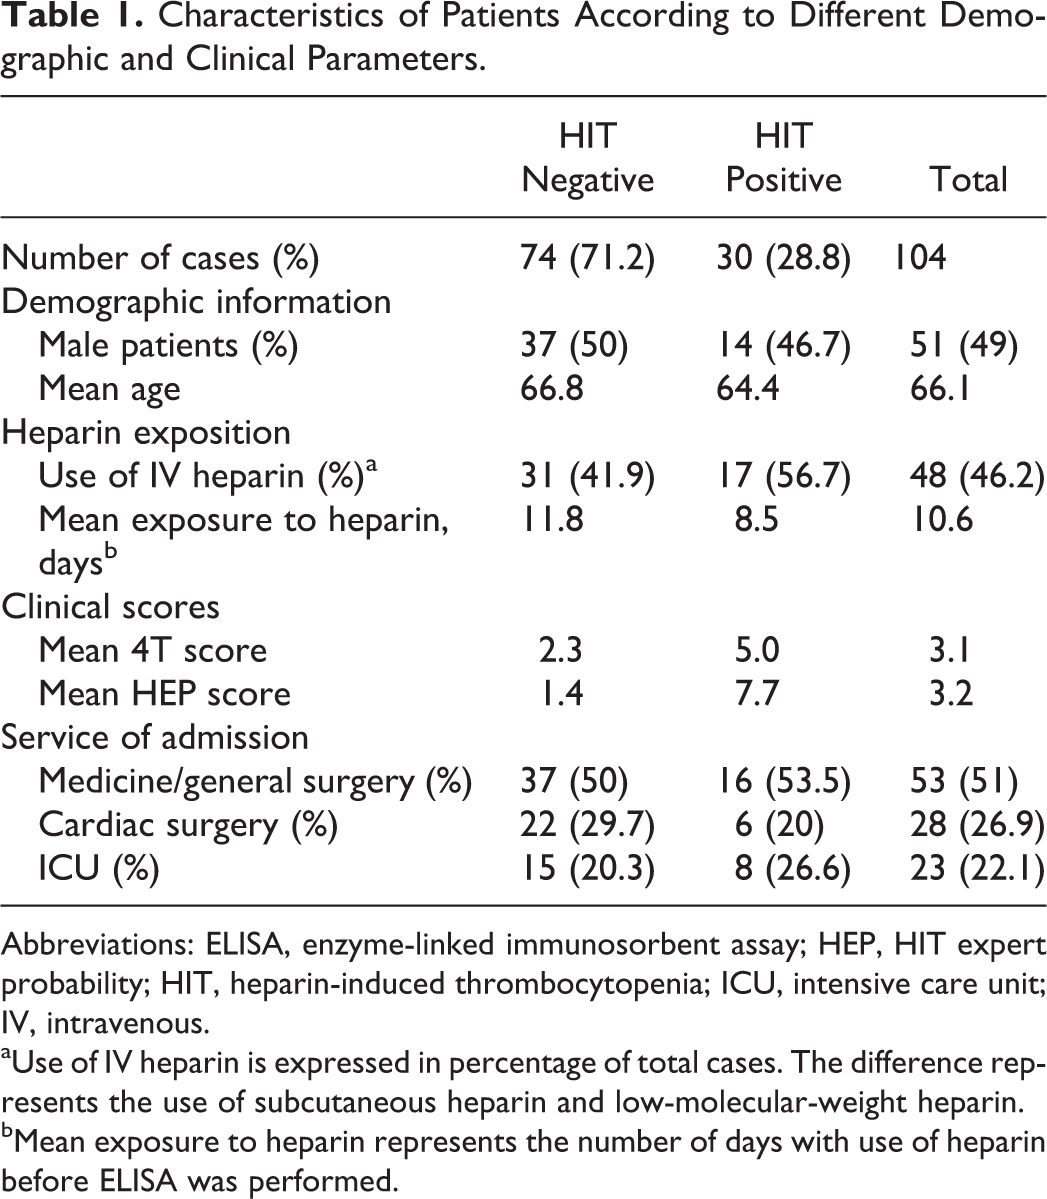
Abbreviations: ELISA, enzyme-linked immunosorbent assay; HEP, HIT expert probability; HIT, heparin-induced thrombocytopenia; ICU, intensive care unit; IV, intravenous.
aUse of IV heparin is expressed in percentage of total cases. The difference represents the use of subcutaneous heparin and low-molecular-weight heparin.
bMean exposure to heparin represents the number of days with use of heparin before ELISA was performed.
Figure 1 shows mean OD for HIT-positive and HIT-negative patients as well as the distribution of the individual results. The mean OD was significantly lower for HIT-negative patients (0.83, SD ± 0.62) compared to the HIT-positive patients (2.15, SD ± 0.76; P < .001). There was no significant difference in terms of age, sex, and reason for admission between these 2 groups, as it can be seen in Table 1.
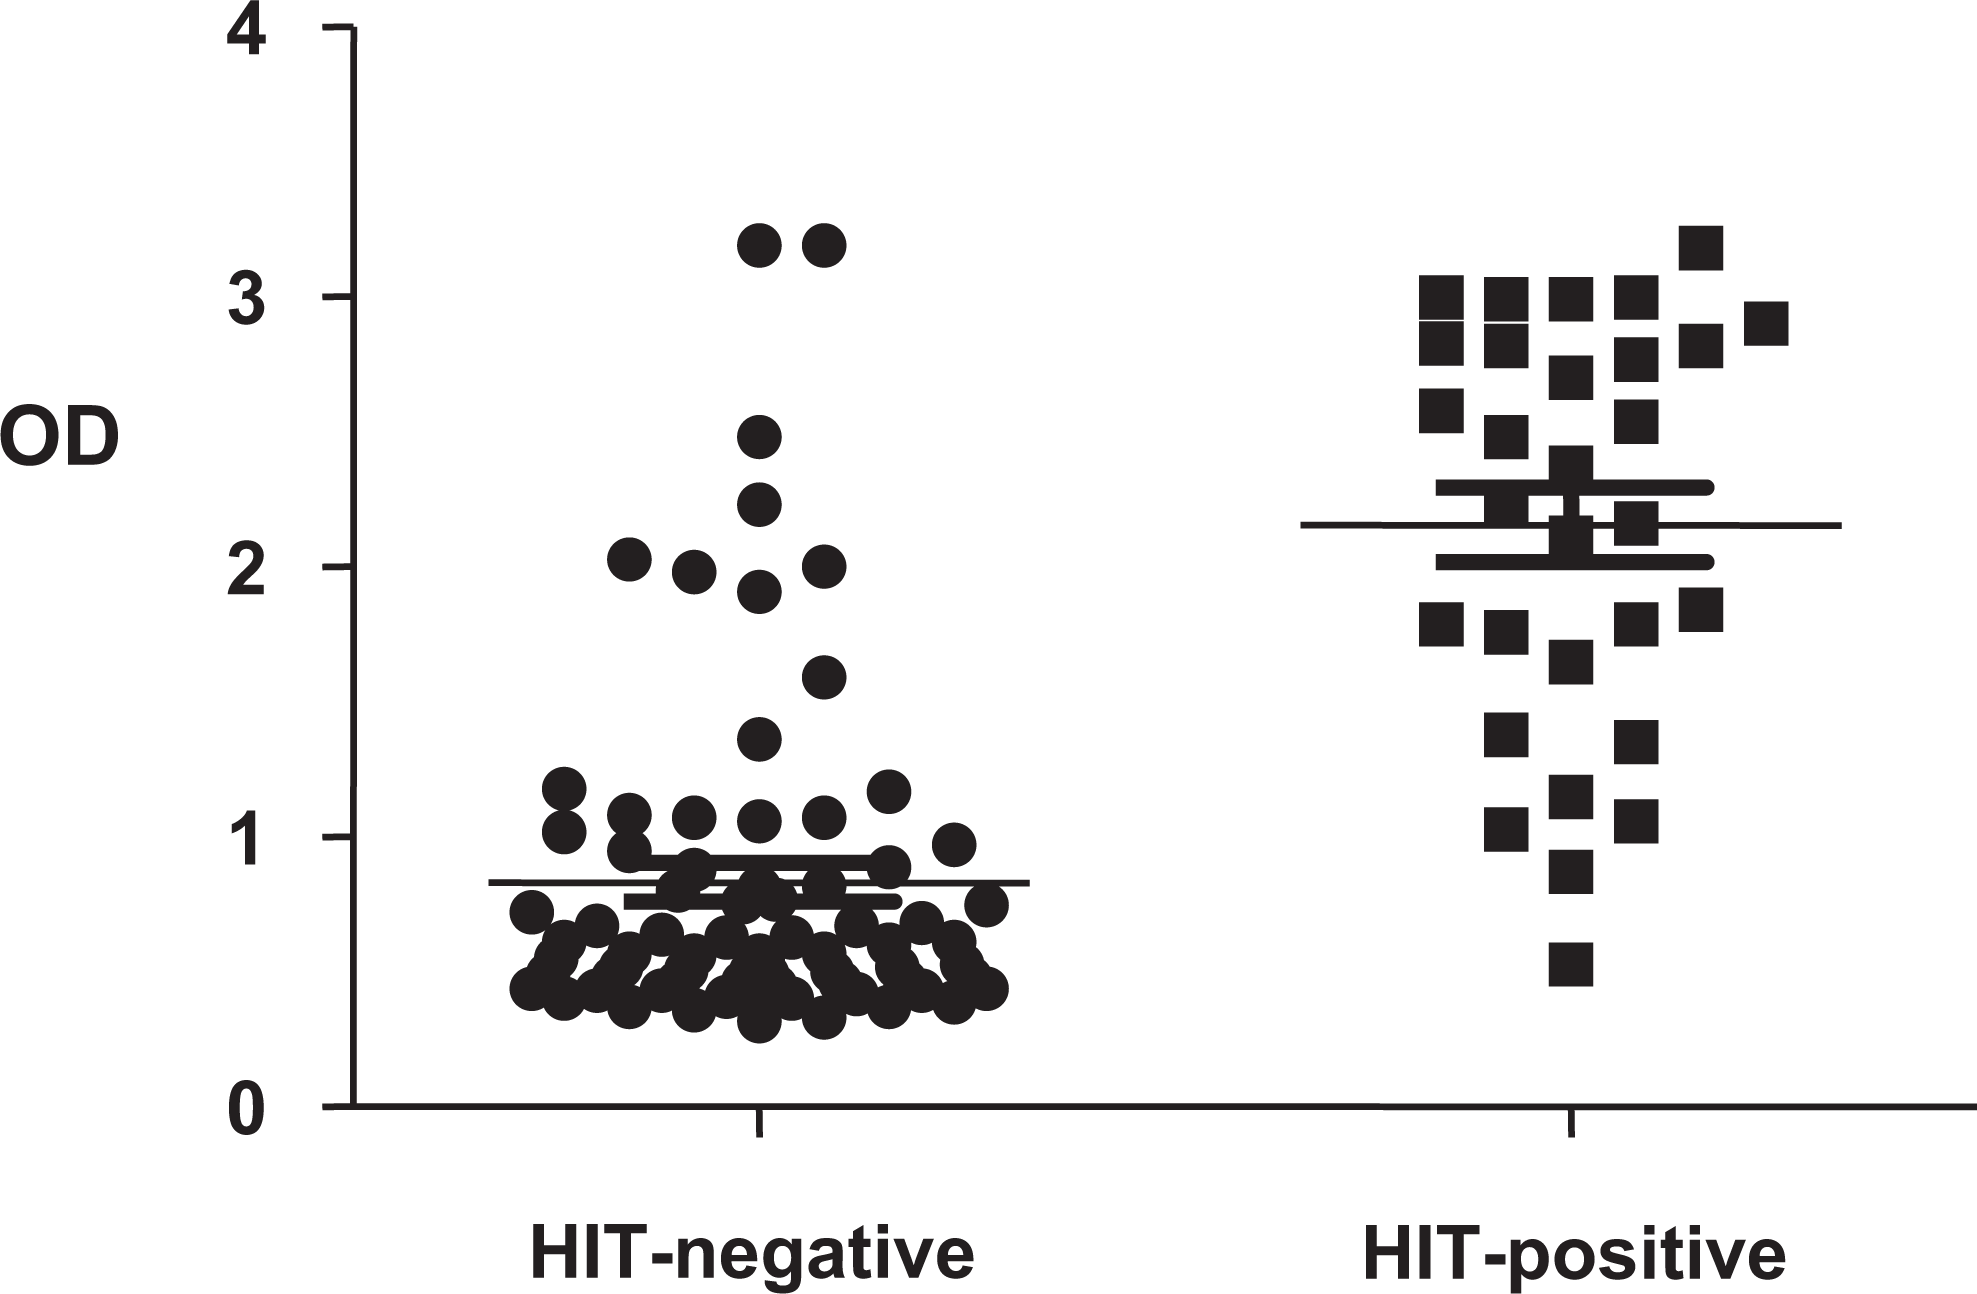
Distribution of all cases according to final diagnosis and individual OD result. Horizontal lines correspond to mean optic densities for each group. HIT-positive patients had higher mean OD than HIT-negative patients (2.15 ± 0.76 vs 0.83 ± 0.62, P < .001). HIT indicates heparin-induced thrombocytopenia; OD, optical density.
In this study, there was a direct correlation between clinical score and OD result. Patients without cardiac and orthopedic surgery were divided into 3 different groups according to their “4T scores”: low (score 0-3), intermediate (4-5), and high clinical probability scores (>5). These groups of patients had an increasing mean OD correlated with higher scores: 0.76 (SD ± 0.59), 1.24 (SD ± 0.83), and 1.89 (SD ± 0.81), respectively. There was a significant difference between the first 2 groups (P = .0093) but not between the last 2 groups (P = .0627). However, a linear progression curve between “4T score” and OD for all the cases showed a correlation that was statistically significant with a P value of less than .01. These results were similar when patients with cardiac and orthopedic dieasewere included in the analysis.
Figure 2 shows a distribution of patients according to “4T score” and final diagnosis. In patients with low clinical probability, HIT-positive patients had statistically higher mean OD than HIT-negative patients (3.0 ± 0.14 vs 0.66 ± 0.36, P < .01). This was also true for patients with intermediate probability score (1.88 ± 0.78 vs 0.67 ± 0.29, P < .01). In high probability patients, there was only 1 patient with negative diagnosis. Those with positive diagnosis had mean OD of 1.88 ± 0.31.
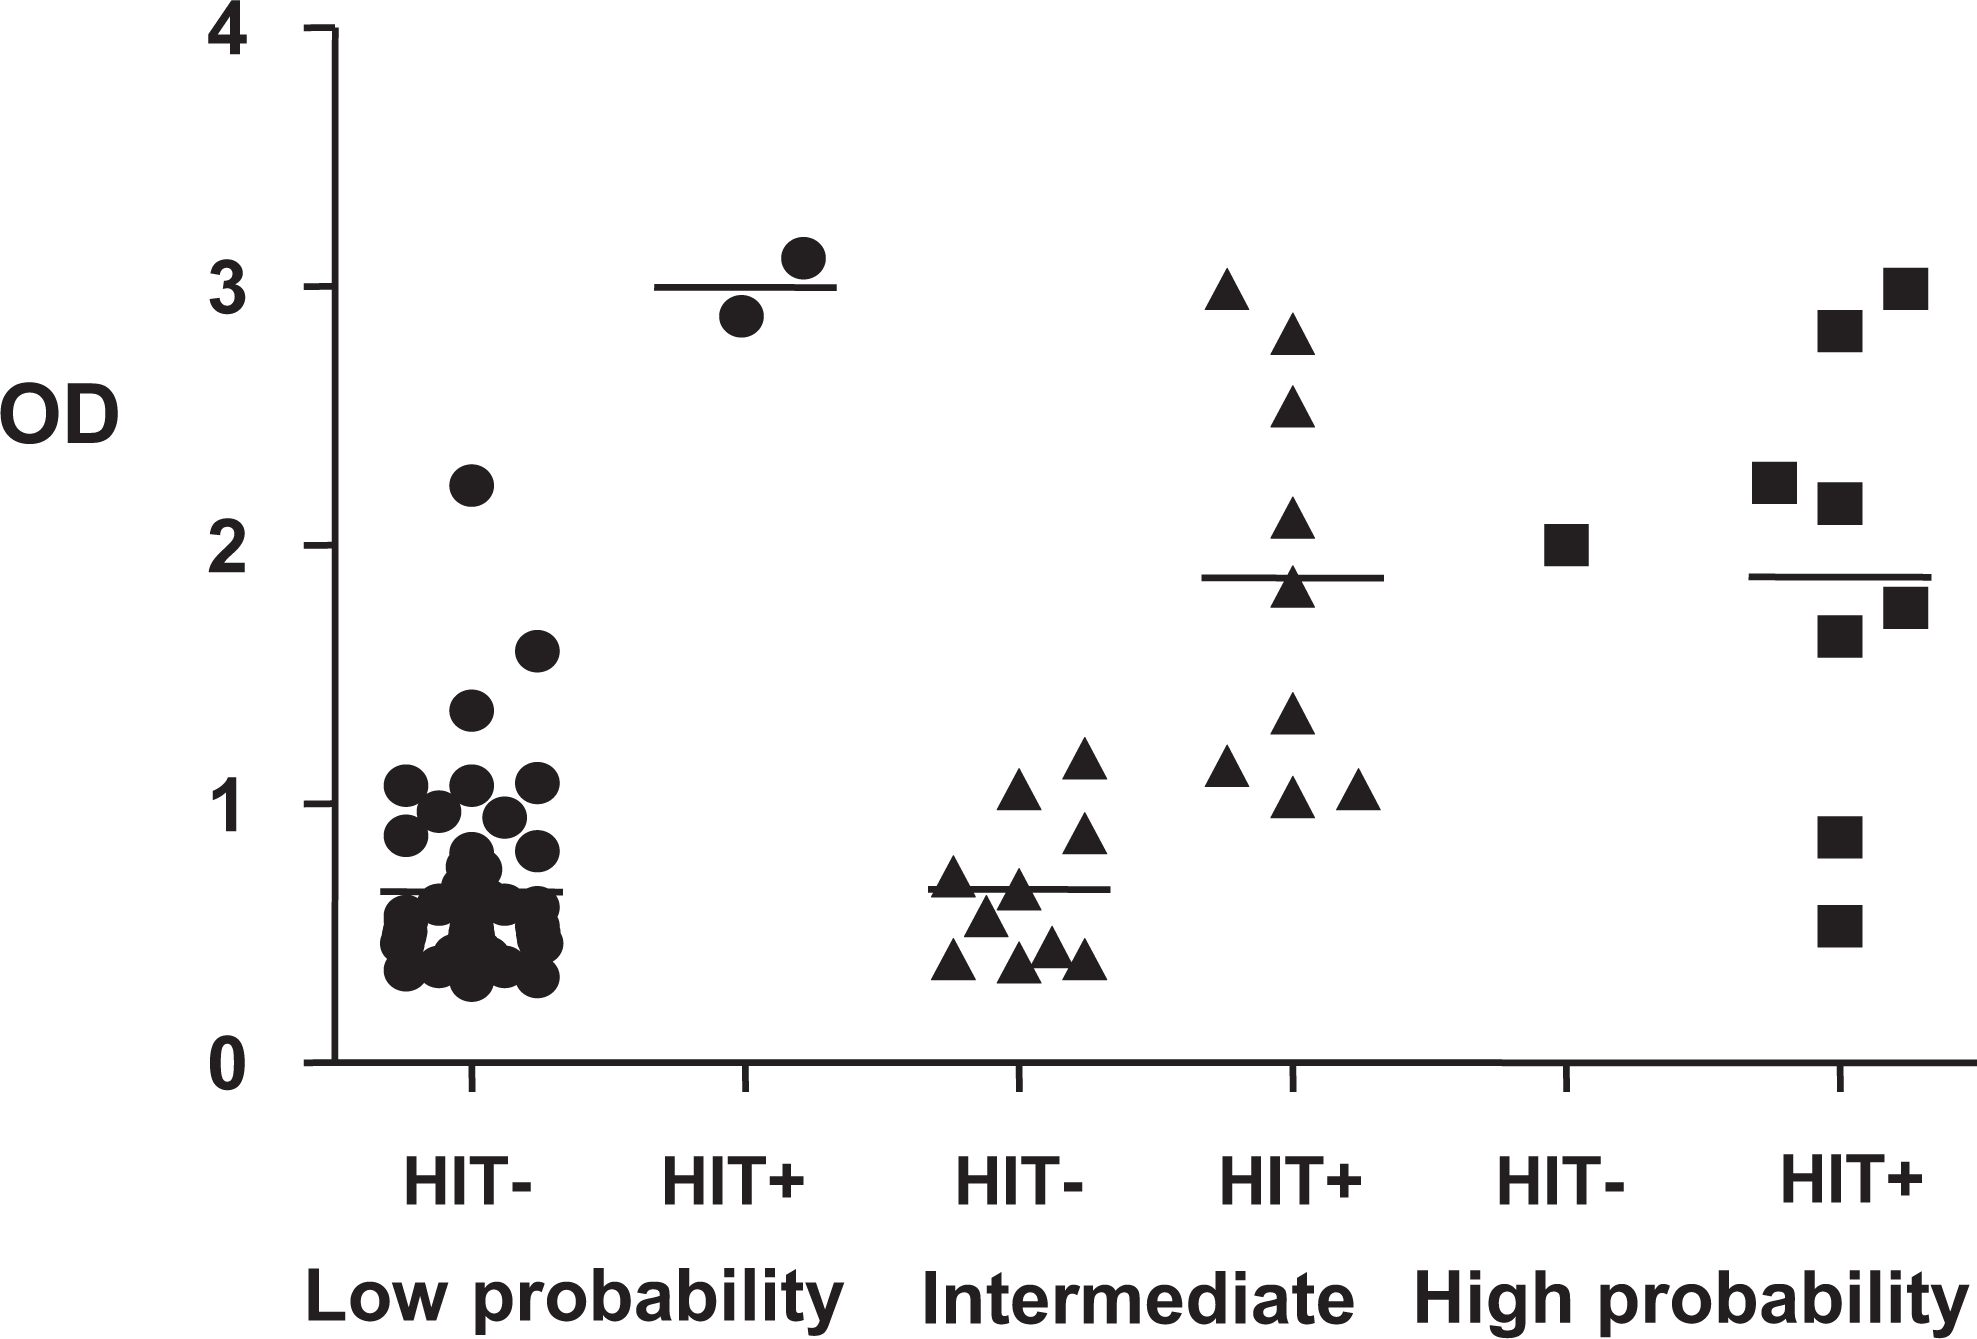
Distribution of cases without cardiac surgery according to 4T score and final diagnosis. In patients with low clinical probability, HIT-positive patients had statistically higher mean OD than HIT-negative patients (3.0 ± 0.14 vs 0.66 ± 0.36, P < .01). This was also true for patients with intermediate probability score (1.88 ± 0.78 vs 0.67 ± 0.29, P < .01). In high probability patients, there was only 1 patient with negative diagnosis. Those with positive diagnosis had mean OD of 1.88 ± 0.31. HIT indicates heparin-induced thrombocytopenia; OD, optical density.
The statistical properties of the ELISA test were analyzed across varying levels of threshold definitions. The patients were divided into 3 groups according to their level of OD: (1) BT-1.0, (2) 1.0 to 2.0, and (3) more than 2.0 (Table 2). There were 59 patients who had an OD of less than 1.0. Of these, only 2 (3.4%) were HIT positive. These 2 patients had moderate and high clinical suspicions (“4T scores” of 5 and 6, respectively). In comparison, the percentage of HIT-positive patients was 45.5% (10 patients of 22) for the group with OD 1.0 to 2.0, and 78.2% (18 of 23) when OD was more than 2.0. An ROC between OD and clinical diagnosis (Figure 3) shows that the specificity of the test increased from 28% (95% confidence interval [CI]: 18%-39%) to 78% (95% CI: 67%-87%) when the cutoff for OD was moved from BT to 1.0. With a threshold of 1.0, the sensitivity was decreased only to 93% (95% CI: 78%-99%). When the cutoff was increased to 1.5, specificity was improved to 88% (95% CI: 78%-94%) but sensitivity decreased to 77% (95% CI: 57%-90%). Other results according to different threshold can be seen in Figure 3.
Number of HIT-Positive and HIT-Negative Patients According to Different OD Ranges.
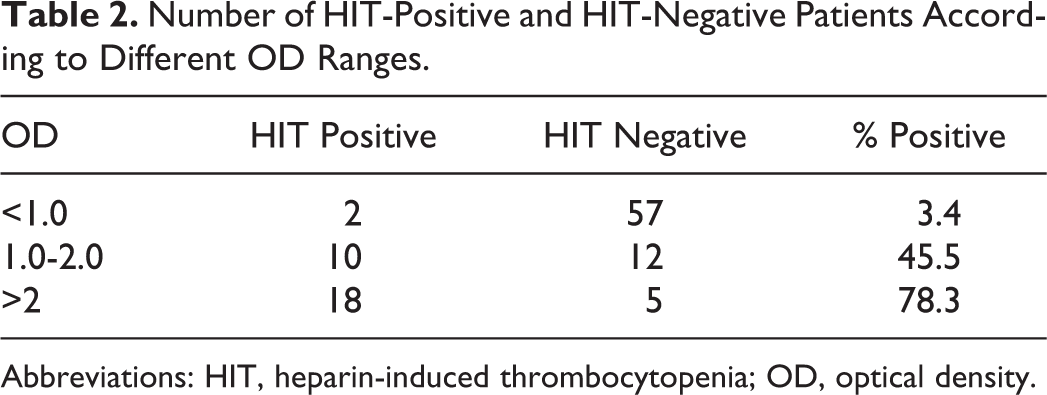
Abbreviations: HIT, heparin-induced thrombocytopenia; OD, optical density.
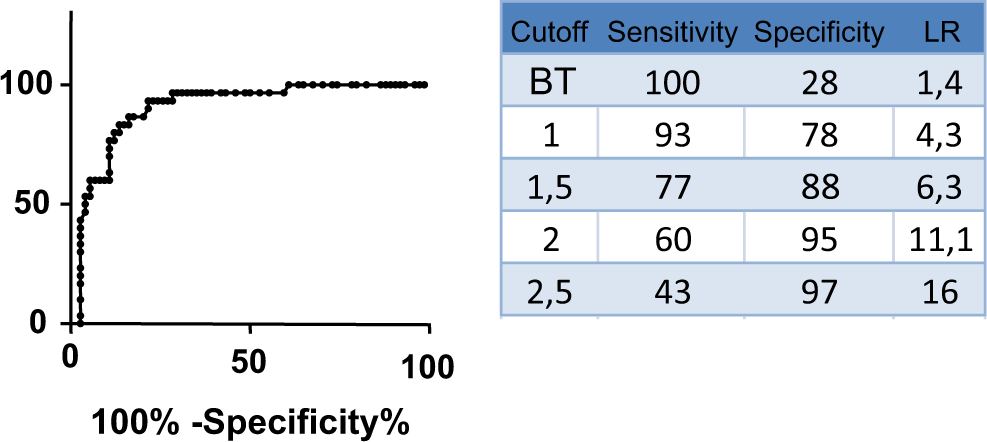
Receiver–operator curve (ROC) of OD according to clinical diagnosis of heparin-induced thrombocytopenia (HIT). As defined by the study protocol, all patients had an OD above BT (baseline threshold). Therefore, this study was not designed to calculate sensitivity of the BT, and the value of 100% should be used as a reference number for other values. OD indicates optical density.
Among the 30 HIT-positive patients, 6 (20%) patients have been diagnosed with venous or arterial thrombosis during their hospitalization. In comparison to other HIT-positive patients, those who had thromboembolic complications had higher OD, but the difference was not statistically significant (2.46, SD ± 0.23 vs 2.08, SD ± 0.82; P = .28; Figure 4).
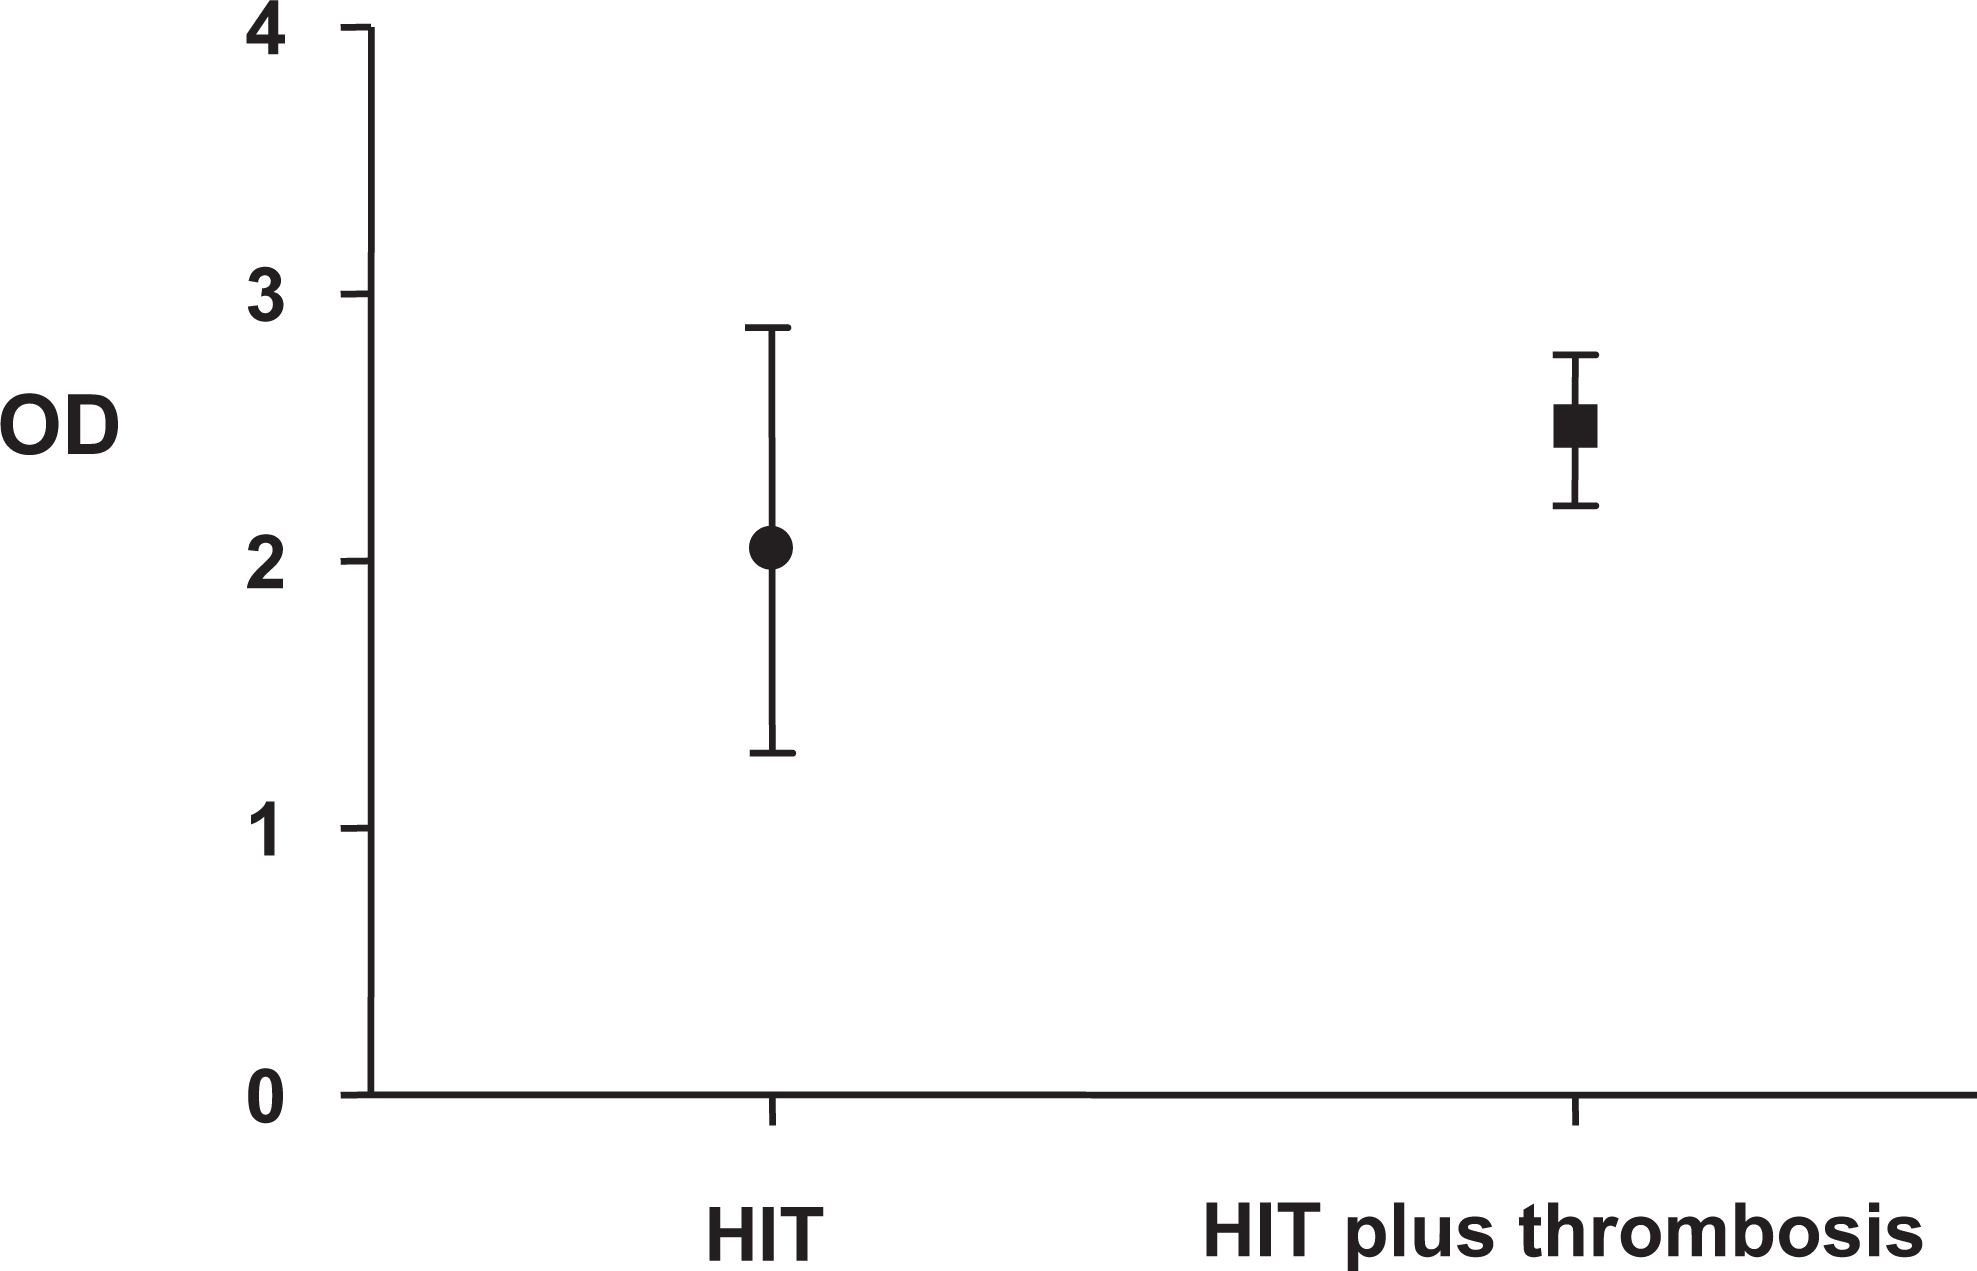
Mean OD in patients with HIT plus thrombosis versus HIT without thrombosis. In comparison to patients without thrombosis, those who had thrombotic complications had slightly higher OD but difference was not statistically significant (2.46 ± 0.23 VS 2.08 ± 0.82, P = .28). HIT indicates heparin-induced thrombocytopenia; OD, optical density.
A confirmatory test using SRA was performed for 24 (23%) patients. Of these, 5 were positive and 19 were negative. Interestingly, all SRA results matched the final HIT diagnosis based on the clinical criteria.
Discussion
Our retrospective study of 104 patients with positive ELISA results for anti-PF4/heparin antibodies found that patients with clinical HIT had higher mean OD results than patients with clinical evolution incompatible with HIT. As previously published, 13,35 an OD result less than 1.0 was poorly correlated with HIT. Only 3.4% (2 of the 59) of these patients were diagnosed with HIT, and those 2 patients had moderate-to-high clinical suspicion. Therefore, an OD result of less than 1.0 was for most cases an evidence against clinical HIT. Optical density between 1.0 and 2.0 had good correlation with clinical HIT (45.5% HIT positive) and OD more than 2.0 was strongly associated with HIT diagnosis (78.3% HIT positive).
Furthermore, this study showed that OD results are useful when used in addition to the clinical scores. In fact, OD could discriminate between positive and negative diagnosis in patients with low and moderate clinical probability according to the “4T score.” This could not be shown in patients with high clinical scores since only one of these patients turned out to be HIT negative as judged by the clinical evolution of this case.
The statistical properties of ELISA were further assessed in this study. The use of a BT was associated with a very low specificity and positive predictive value for HIT diagnosis. By increasing the threshold to 1.0, the specificity was increased to 78.4% at the price of decreasing the sensitivity to 93.3%.
In our study, the main weakness was associated with data interpretation and clinical diagnosis. In fact, it was not always possible to stay blinded to OD results as they were sometimes included in the progress notes. However, this was the case in only a minority of patients. In this situation and in more challenging clinical cases, a second review was performed, and the OD result was hidden from the reviewer. Therefore, we think that this diagnostic bias only had a minimal effect in our data interpretation.
Conclusion
Our study shows that antiheparin/PF4 ELISA OD results correlate with clinically defined HIT. These results are similar to other studies, which define HIT based on the laboratory data. Based on our results, it appears that OD values help in the decision process toward HIT diagnosis. A confirmatory procedure (such as the SRA) 24,34,35 is still recommended before a final diagnosis of HIT, particularly in clinically challenging cases.
Footnotes
Declaration of Conflicting Interests
The author(s) declared no potential conflicts of interest with respect to the research, authorship, and/or publication of this article.
Funding
The author(s) received no financial support for the research, authorship, and/or publication of this article.