
Abstract
Management of pulmonary embolism (PE) is still unclear. We summarized 16 kinds of evaluation factors of PE severity and prognosis, and we analyzed the single and joint value for short-term and long-term prognosis. Among them, biomarkers such as brain natriuretic peptide or N-terminal probrain natriuretic peptide, troponin, and heart-type fatty acid-binding protein are the best indicators of PE severity and short-term prognosis. They might replace imaging detections in evaluating PE severity. But the positive predictive value of all the biomarkers is low, and we need to improve each value through joint detection. The PE severity index and simplified PE severity index are more suitable for evaluating the overall risk and long-term prognosis. They could be used as complements of indicators of the PE severity, especially in identifying low-risk group. Integrated risk stratification and strategies of management should be established based on the 2 aspects mentioned previously.
Pulmonary embolism (PE) has a high morbidity of 0.5‰ to 1‰ cases/year in Europe and America. 1 –3 Although technology of diagnosis and treatment continues to improve, the mortality rate remains high. More than 10% of the nosocomial death is related to PE. 3,4 The PE has a very wide spectrum from less than 2% short-term mortality in nonmassive PE to 95% mortality in massive PE which needs cardiopulmonary resuscitation. 5 –8 This means that the management of PE is very complicated and hard. Hence, we need to make an accurate judgment of PE severity and prognosis. It is a consensus that patients with massive PE, which is characterized by hemodynamic instability, have high short-term mortality rate and indications of aggressive treatments such as thrombolysis from which they can benefit. 9 –13 But the hospital mortality of hemodynamically stable patients with PE accompanied by increased right ventricular (RV) afterload is up to 5% to 15.1%. 7,8,13 What’s more, their denomination, diagnostic criteria, and strategy of treatments are still unclear. 10,11 Although the Scientific Statement From the American Heart Association: Management of Massive and Submassive PE in 2011 (hereinafter referred to as 2011 American Statement) has given quantitative recommendations of RV dysfunction (RVD), myocardial damage, and indications of thrombolytic therapy in submassive PE, 11 many parameters except hemodynamic status are still controversial. Now, we will make a review of evaluation factors of PE severity and prognosis and analyze the risk stratification and management strategies of PE based on the results.
Evaluation Factors of PE Severity and Prognosis
Basic Conditions and Comorbidities
In some studies of PE prognosis, we interestingly find that age, malignancy, chronic heart, and lung diseases often have higher values than some laboratory parameters.
Both Miniati et al 14 and Conget et al 15 found that early death of patients with PE had a close relationship to PE-related complications, but long-term prognosis has a close correlation with concomitant diseases such as cancer and heart failure. In their over 1-year follow-up research, Dellas et al 16 and Lankeit et al 17,18 found that malignancy and heart failure were the most crucial predictors. Hence, we can conclude that age and comorbidities have strong correlation with long-term prognosis of PE.
Age and comorbidities could also indicate short-term prognostic value. 19 In Chin’s study, Charlson comorbidity index, which comprises myocardial infarction, chronic lung disease, cancer, and so on, was the most important prognostic factor of nosocomial and long-term death for patients with PE. 20
What’s more, age and comorbidities occupy a great proportion in some prognostic models that have been widely verified such as PE severity index (PESI) 21,22 and simplified PESI (sPESI). 23,24 The validation of these prognostic models further illustrates that age and comorbidities have great impact on PE prognosis.
According to these studies, we can draw a conclusion that age and comorbidities such as malignancy, chronic heart, and lung diseases are all significantly related to prognosis of PE, 7,15 –24 especially the all-cause 7,19,20 and long-term prognosis. 14,16 –18,25
Clinical Scoring Models
We have clarified the correlation between comorbidities and prognosis of PE, but different diseases have different values. Many clinical and laboratory parameters showed close correlation with prognosis of PE. So it is feasible to establish an integrated scoring model for evaluating PE prognosis. The PESI and sPESI are major prognostic scoring systems.
Aujesky et al made PESI by screening 11 factors that correlated with 30-day death (see Table 1). The PESI is entirely composed of historical and clinical parameters. The PESI could stratify PE accurately and exclude patients with poor prognosis effectively because of its excellent negative predictive value (NPV, 98%). But its positive predictive value (PPV, 16%) was low. 21 And then PESI was widely approved for validation. All studies suggested that its NPV (98%-100%) was high but PPV was low. 21,22,26 –28
The PESI and sPESI.a
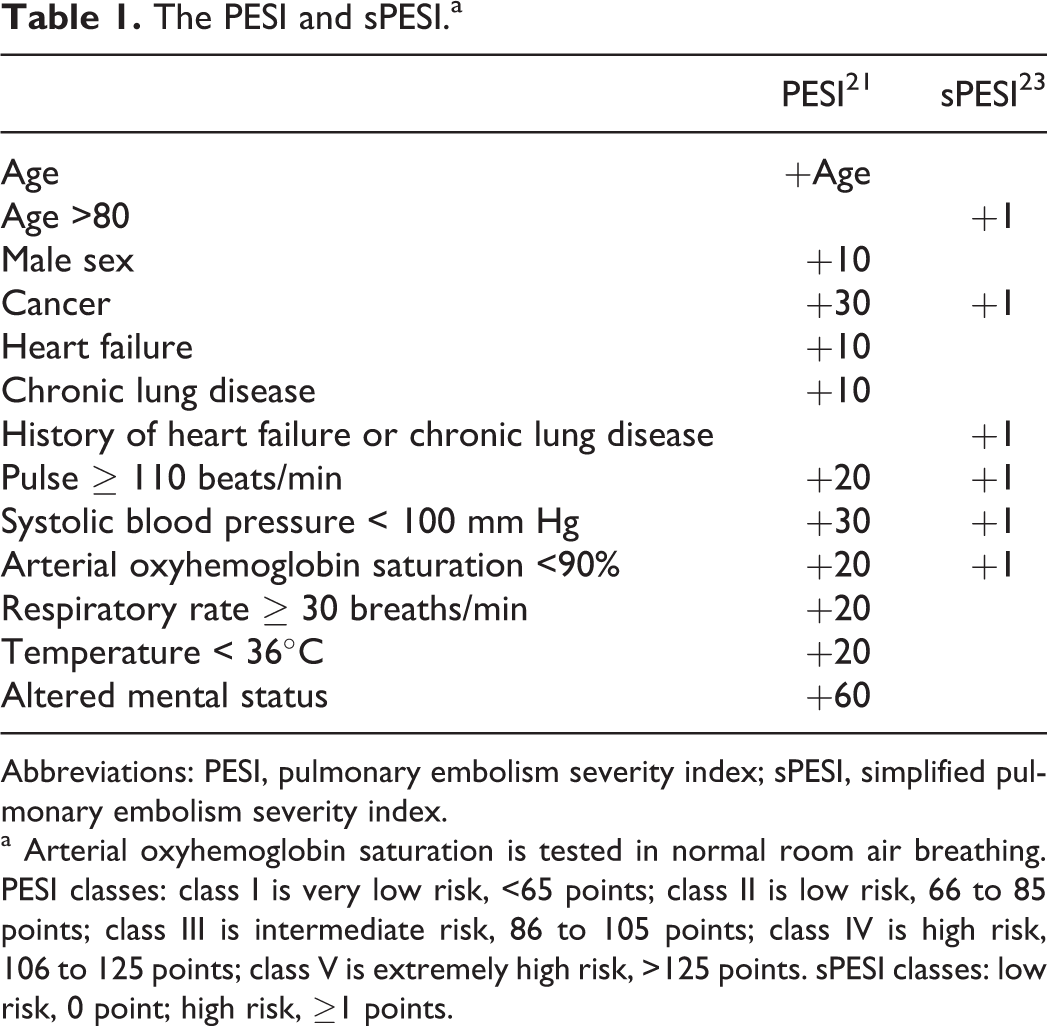
Abbreviations: PESI, pulmonary embolism severity index; sPESI, simplified pulmonary embolism severity index.
a Arterial oxyhemoglobin saturation is tested in normal room air breathing. PESI classes: class I is very low risk, <65 points; class II is low risk, 66 to 85 points; class III is intermediate risk, 86 to 105 points; class IV is high risk, 106 to 125 points; class V is extremely high risk, >125 points. sPESI classes: low risk, 0 point; high risk, ≥1 points.
The PESI shows good prognostic value, but it is too complicated. Jiménez et al established sPESI based on PESI. It is comprised of 6 parameters (see Table 1). The 30-day, low-risk group mortality was 1.0%, while the high-risk group mortality was 10.9% in the derivation study. 23 Sam et al, 24 Venetz et al, 29 and Spirk et al 30 verified good prognostic value of sPESI, respectively (see Table 2).
Mortality of Low-Risk and High-Risk Groups in sPESI Cohorts.a
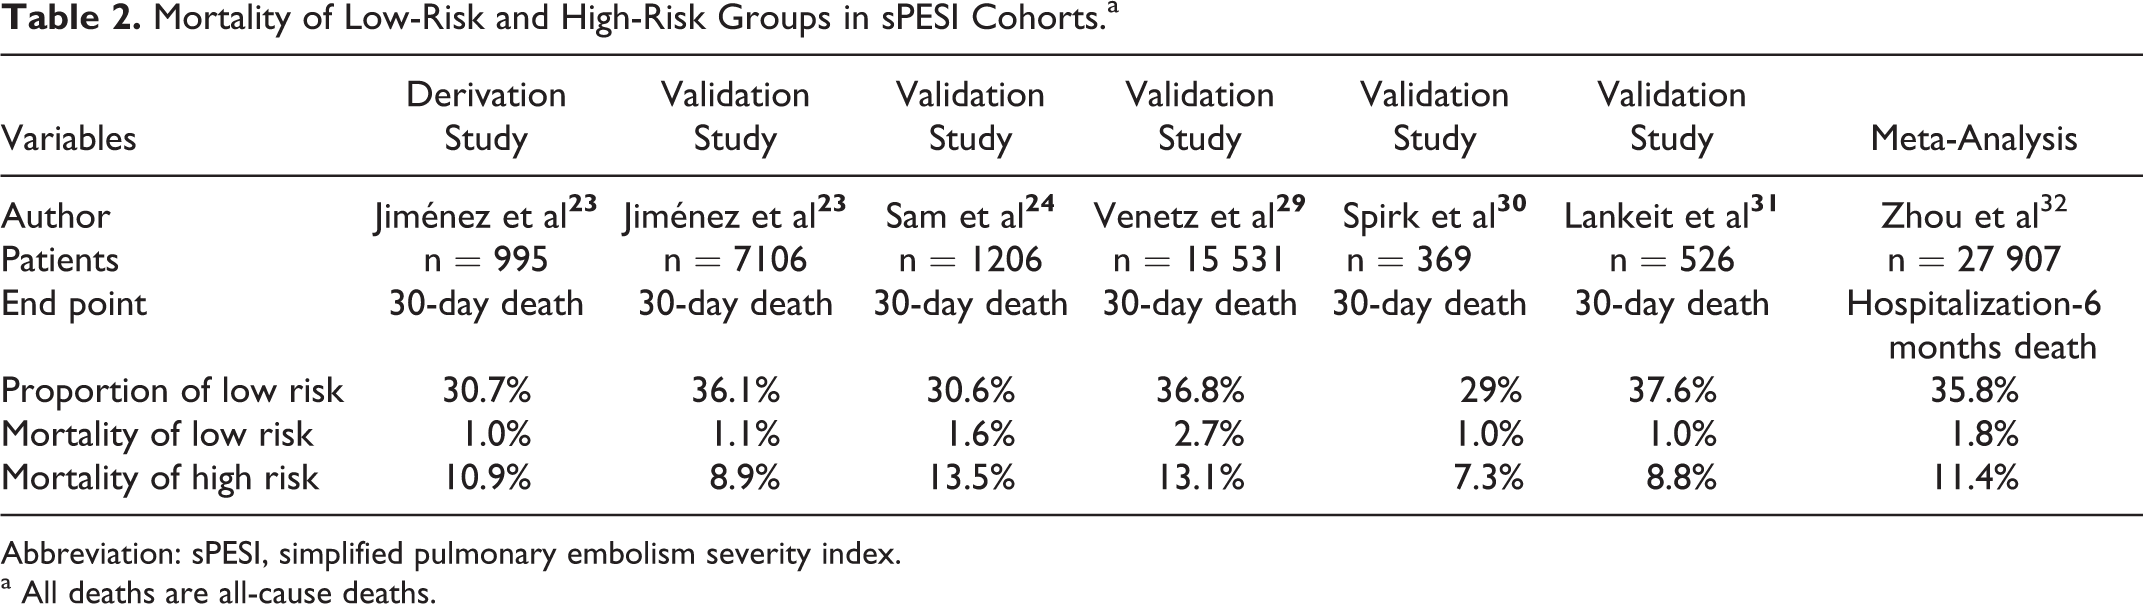
Abbreviation: sPESI, simplified pulmonary embolism severity index.
a All deaths are all-cause deaths.
Zhou et al did a pooled meta-analysis of PESI and sPESI. Both sPESI and PESI had high NPV (97%-98%) and low PPV (13.2%-25.2%) for all-cause death. 32
The PESI and sPESI have been widely used and can be accessed quickly and easily. Their derivation and validation studies were all built on large samples, and they could stratify patients with PE accurately. 19,21,22,23,24,26,28,30,32,33,31 The sPESI is simpler, and its accuracy is not reduced. 23,24,29,30,32,33,31 It is similar to PESI (1) they have high value in identifying low-risk group and can even be used to screen patients for outpatient treatment because of excellent NPV. But PPV is low in both PESI and sPESI. 19,21,22,23,24,26,28,30,32,33,31 ; (2) score involves several parameters about the basic status.This makes them more suitable to reflect the overall status rather than the severity of PE. 26 ; (3) they also have a good predictive value for long-term prognosis 22,26,32,31 ; and (4) they can further improve each predictive value when combined with laboratory and instrumental detections. 27,30,31
Imaging Abnormalities
Abnormalities in Echocardiography
It is the most popular view that the presence of RVD in echocardiography implicates the severity and poor prognosis of PE. The main abnormal morphologies in echocardiography of PE are RV dilatation (increased RV diameter or RV/left ventricular (LV) diameter ratio without RV hypertrophy), RV free wall hypokinesis (McConnell sign), and paradoxical septal motion (the interventricular septum flat or bowing leftward).
Kostrubiec et al found that RV afterload in echocardiographycorrelated with PE-related death. 34 Sanchez et al 35 and Frémont et al 36 found that increased RV/LV diameter ratio in echocardiography was an independent predictor of short-term death. Goldhaber et al 7 and Kucher et al 37 found that RV wall hypokinesis also significantly correlated with short-term prognosis. However, in some other studies, RVD in echocardiography was not an independent predictive factor for either PE-related or all-cause death. 38,39
In Coutance et al’s meta-analysis, RVD in echocardiography correlated with short-term death. It showed a good value to identify low-risk patients, especially in PE-related death. 40 In Sanchez et al’s meta-analysis, RVD in echocardiography was also associated with short-term death. 41
Most researchers demonstrated that manifestations of RVD in echocardiography were not only closely related to the degree of pulmonary artery occlusion and pulmonary artery pressure 42 but also related to mortality. 7,8,34,35,36,37,40,41,43,43 Because most studies were about short-term prognosis 35,36,37,40,43 and manifestations of RVD in echocardiography had stronger correlation with PE-related adverse events, 34,40 they can better reflect the severity of PE and short-term prognosis. But most studies demonstrated their low PPV. 34,37,40 Hence, except for patent foramen ovale 43 and right heart emboli, 44,45 other positive performance cannot be used as thrombolytic indications. And the complicated morphologies, dependence on some subjective factors such as experience of operators and poor repeatability, further limit their value.
The Presence of RVD in COMPUTED TOMOGRAPHY
There is no definite standard of presence of RVD in computed tomography (CT) yet. The current study focused on RV dilation and paradoxical septal motion.
Quiroz et al found that RV/LV > 0.9 in CT was an independent predictor of short-term adverse events. 46 This view was consistent with some other studies. 47,48,49 Aviram et al found that the automatic analysis of heart chamber volume ratio in CT was closely related to poor 30-day prognosis, showing better prognostic value than RV/LV diameter ratio. 50 It is similar to some other studies. 51,52 Araoz et al 53 and Philip 54 found that paradoxical septal motion correlated with PE severity and short-term death.
In Coutance et al’s meta-analysis, although RV/LV in CT was not an independent predictor of all-cause and PE-related death, it still showed a high NPV (93%-99%) in identifying low-risk patients. 40
Although most studies have shown that RV dilatation and paradoxical septal motion correlated with short-term prognosis, 43,46,48,49 some studies had different results. 40,50,54 What is more, RV/LV ratio could not be used as a reliable indicator of thrombolytic therapy because of its low PPV. 40,47,48 Automatic analysis of heart chamber volume ratio in CT showed a better prognostic value, but it lackseffective verification of large samples. 50,51,52
Pulmonary Artery Obstruction Index in CT
McIntyre and Sasahara 55 and Delcroix et al 56 found that the hemodynamic impairment was more significant when pulmonary vascular bed was blocked >30% to 50%. These studies demonstrate that the degree of pulmonary artery occlusion closely correlates with the severity of PE.
There are 2 main score models of pulmonary artery obstruction index (PAOI). (1) Qanadli score: each lung is regarded as having 10 segmental pulmonary arteries, normal = 0, partial occlusion = 1, complete occlusion = 2, a total of 40 points. 57 Both Shokoohi et al 58 and Rodrigues et al 59 have found that Qanadli score closely correlated with PE severity indicators such as RVD and blood pressure. (2) Mastora score: 5 mediastinal, 6 lobar, and 20 segmental arteries, 0 = 0%, 1 = 1% to 24%, 2 = 25% to 49%, 3 = 50% to 74%, 4 = 75% to 99%, 5 = 100%, a total of 155 points. 60 Mastora score also had close relationships with RVD 61 and short-term death. 42
Some studies had different results. Philip 54 and Ghuysen et al 62 did not find significant correlation between PAOI and short-term death. Subramaniam et al found that Qanadli score was not an independent prognostic factor for 12-month death. 63
Among these score models of PAOI, Qanadli score has been applied more comprehensively. Almost all studies found that PAOI significantly correlated with RVD 47,57,59,60,42 and myocardial damage (troponon [cTn]) 58,59 These correlations demonstrate that PAOI can reflect the severity of PE in a degree. Although there is great difference in evaluating death and prognosis, some studies showed the association between the extent of occlusion and prognosis, 47,59,42 but other studies drew a different conclusion. 54,62,63 So it cannot be directly associated with short-term death and be used as an evidence of thrombolysis.
Biomarkers of RVD and Myocardial Damage
Troponin
The cTn is the most sensitive and specific biomarker of irreversible myocardial injury. It has been comprehensively recognized in diagnostic and prognostic evaluation of myocardial infarction and heart failure. In recent years, it has been applied in risk stratification and prognostic evaluation of PE.
Kostrubiec et al, 34 Giannitsis et al, 61 Konstantinides et al, 64 Zhu et al, 65 and Sánchez et al 33 found that cTn significantly correlated with severity of PE, and it was an independent predictive factor for short-term prognosis.
In Becattini et al’s meta-analysis, elevated cTn significantly correlated with short-term death, especially PE-related death, and the correlation was still obvious in hemodynamically stable subset. 66 In Jiménez et al’s meta-analysis, elevated cTn implicated 4.26 times risk of all-cause death. 67
The cTnT and cTnI have similar values in studies of PE, while the value of high-sensitivity cTn needs to be illustrated by more researchers. 18,31 Elevated cTn had close ties with PAOI and RVD. 64,68,69 Most studies have shown that the elevated cTn significantly correlated with short-term prognosis 61,64,65,33,66,67 and PE-related prognosis. 34,33,66,70 These may implicate that cTn is suitable to evaluate the severity of PE instead of overall status. The cTn had similar value in hemodynamically stable patients. 34,66,67 However, cTn cannot be used as a reliable indicator of thrombolytic and outpatient treatment because of its unsatisfying NPV, PPV, and high overlap. 64,65,33,66,67 And obviously, the limited detection time window further reduces the predictive value of cTn. 16,71,70
Brain Natriuretic Peptide or N-terminal pro-BNP
Brain natriuretic peptide (BNP) and N-terminal pro-BNP (NT-proBNP) are mainly generated by ventricular cells and released into blood after a few hours of incremental ventricular tension or heart failure. In recent years, they have been widely used in risk stratification of PE.
The BNP or NT-proBNP could reflect the degree of RV afterload and RVD in some studies of PE. 72,73,68 Meanwhile, Sanchez et al, 35 Pruszczyk et al, 72 Vuilleumier et al, 74 and Kucher et al 75 found that BNP or NT-proBNP was an independent predictor of short-term prognosis with very high NPV but unsatisfied PPV. In addition, Jeffrey found that BNP could predict long-term death of 6 months. 69 However, Dellas et al found that BNP was not an independent predictor of either short-term or long-term prognosis. 16
Frederikus’s meta-analysis found that both NT-proBNP and BNP significantly correlated with RVD in echocardiography and adverse outcome. 76 In Coutance et al’s meta-analysis, BNP or NT-proBNP also significantly correlated with all-cause and PE-related death, and the correlation was still obvious in hemodynamically stable subgroup 40,77 (see Table 3).
Meta-Analysis of BNP and NT-proBNP in Patients With PE.
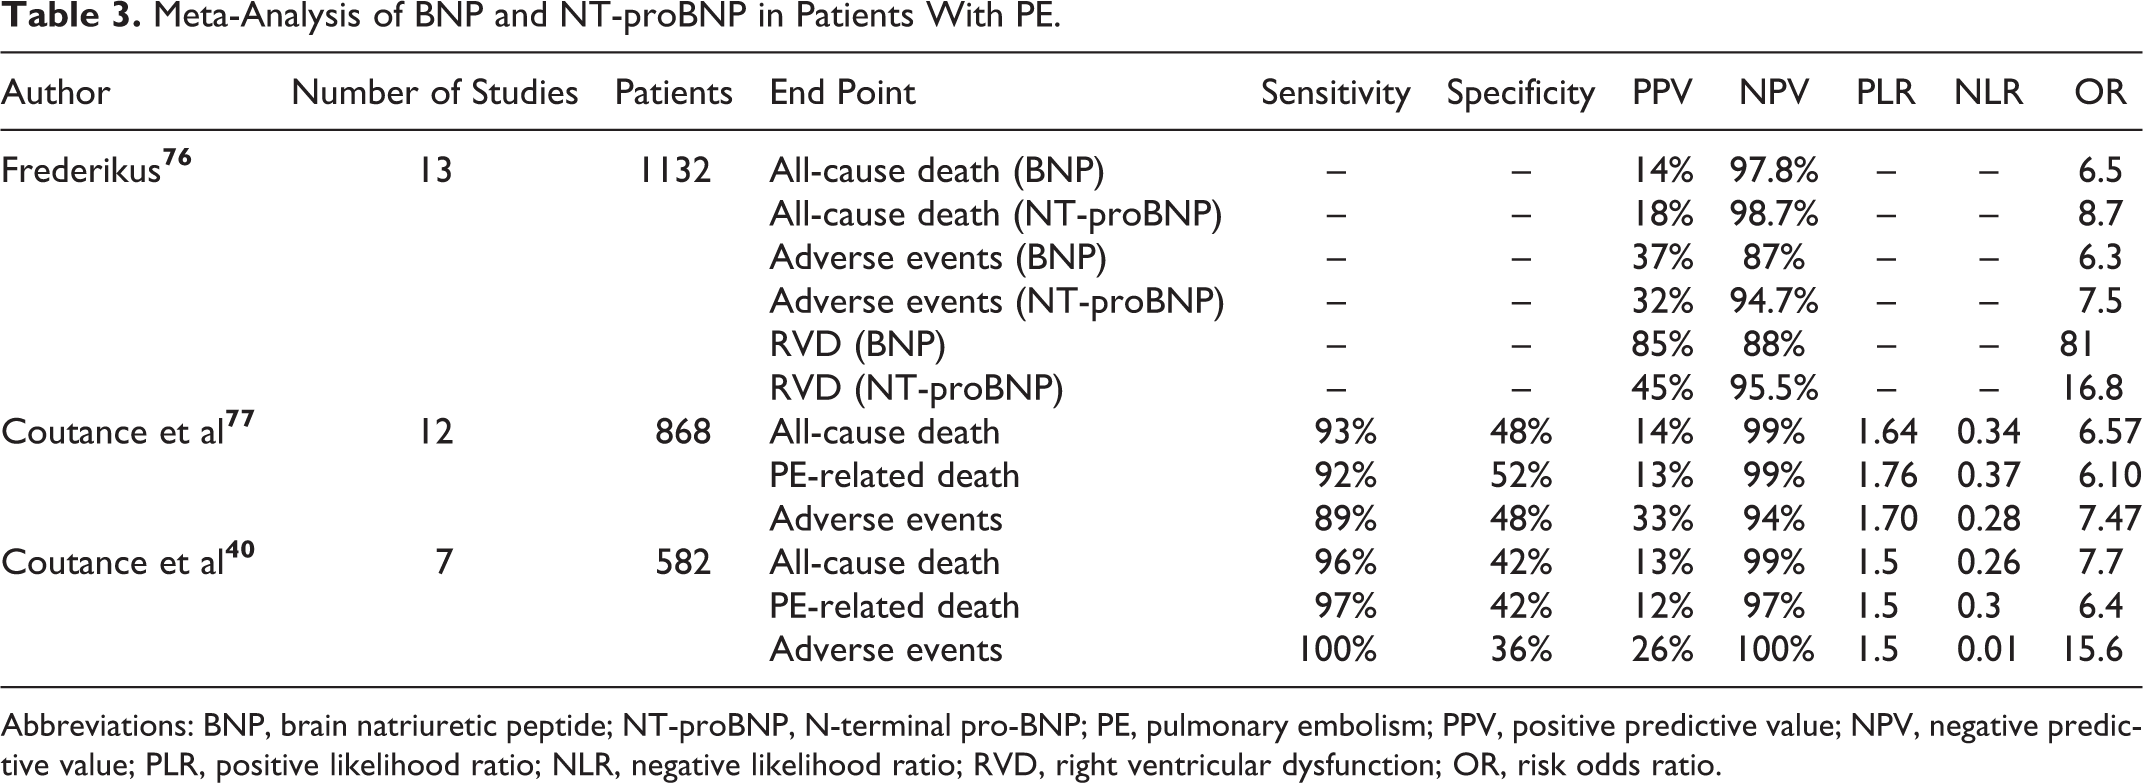
Abbreviations: BNP, brain natriuretic peptide; NT-proBNP, N-terminal pro-BNP; PE, pulmonary embolism; PPV, positive predictive value; NPV, negative predictive value; PLR, positive likelihood ratio; NLR, negative likelihood ratio; RVD, right ventricular dysfunction; OR, risk odds ratio.
Elevated BNP or NT-proBNP in patients with PE significantly correlates with RVD, 34,51,72,73,68,76 and it is possible for them to substitute the evaluation role of imaging detections. Most studies have shown significant correlation with short-term death 35,40,41,72,75,76,77 and PE-related death. 34,40,77,70 Studies in hemodynamically stable subgroup had similar conclusions. 18,40,41,74,69 The BNP and NT-proBNP demonstrate excellent value in identifying low-risk patients which is better than cTn. 18,34,74 They may even be used as candidate indicators for outpatient treatment because of their high NPV. 18,34,40,72,74,75,76,77 However, they cannot serve as thrombolytic indicators separately because of low PPV (10%-30%). 18,34,40,72,74,76,77,70
Heart-Type Fatty Acid-Binding Protein
The heart-type fatty acid binding protein (H-FABP) is a relatively small molecule cytoplasmic protein. It is mainly distributed in the myocardium, skeletal muscle, and distal renal tubular cells, and its highest concentration is in myocardial cells. 78 They play an extremely important role in the myocardial metabolic balance. 79 In normal physiological conditions, H-FABP concentration in the blood is very low but they are released into blood circulation more rapidly than cTn after myocardial cell damage. Blood concentration begins to rise after 90 minutes of injury, peaks within 6 hours, and returns to normal after 12 to 24 hours. 80 These properties make H-FABP an excellent marker in heart diseases. Recent studies have found that H-FABP also has a good value in adjudicating the severity and prognosis of PE.
In Lankeit et al’s study, positive H-FABP implicated 7 times the risk of adverse events. 81 Kaczyñska et al, 82 Boscheri et al, 83 and Puls et al 70 found that H-FABP was the only independent predictor of short-term death in multivariate analysis. In Dellas et al’s study, H-FABP was an independent predictor not only of 30-day death but also of long-term prognosis. 16 The H-FABP showed excellent NPV (99%-100%) and PPV (28%-71%) in all studies. 16,82,83,70 And both Dellas et al and Puls et al found that no patient had initial negative H-FABP after 24 hours, the value is positive. 16,70 Only Vuilleumier et al found that H-FABP was not an independent prognostic factor in multivariate analysis but the end events in this study such as dyspnea might influence the result. 74
In almost all of the relevant studies, H-FABP could independently predict short-term prognosis, and it had better predictive effect than cTn, BNP, echocardiography, and CT. Its main advantages are better observation time window, 16,70 very low overlap, 16,83,70 similar NPV but higher PPV, 16,82,83,70 complementary value when combined with other parameters, 16,81,70 convenience, and objectivity. And the similar predictive value in normotensive patients perhaps provides great help in screening patients for thrombolytic therapy in submassive PE. 16,81,83 These features let it have the possibility to become one of the best indicators of PE prognosis. But the current studies of the relationships between H-FABP and PE are still rare and lack comprehensive verification.
Growth Differentiation Factor 15
Growth differentiation factor 15 (GDF-15) is one of the members of the transforming growth factor superfamily. 84 Blood concentration of GDF-15 will rise rapidly to respond to inflammatory response in conditions of some pathological statuses such as myocardial ischemia and heart failure. 85 Considering its good value in heart diseases, some researchers introduced it to prognostic evaluation of PE.
In Lankeit et al’s study, GDF-15 was an independent predictor of 30-day adverse events. The PPV and NPV was 52% and 95%, respectively. Predictive values were significantly improved when GDF-15 was combined with other biomarkers or echocardiography. And GDF-15 was an independent predictor of long-term prognosis. 17
The GDF-15 has potential value in PE prognostic evaluation. It demonstrated higher PPV than BNP and cTnT, while NPV was not reduced. And GDF-15 showed excellent value in evaluating long-term prognosis and joint assessment. 17 But it has not been comprehensively verified, and its detection methods and cutoff values are still unclear.
Indicators of Respiratory Function
Pathological damage in PE mainly contains 2 aspects of cycle and respiratory dysfunction. The possible mechanisms of respiratory dysfunction are (1) ventilation/perfusion mismatch, (2) reduction in respiratory membrane area caused by pulmonary infarction and atelectasis, (3) diffusing dysfunction, and (4) increased oxygen consumption.
Piirilä found that the CO diffusing capacity and the diffusing capacity of membrane significantly decreased in patients with PE and negatively correlated with the degree of PE.
86
In Pruszczyk et al’s study, sulfur dioxide (SO2) was the unique independent predictor of hospital mortality in multivariate analysis.
72
In the derivation study of PESI, Pa
Electrocardiogram
Electrocardiogram (ECG) is a simple, noninvasive, repeatable, and low-cost method. It has been widely used in the aided diagnosis of PE, but the value is still controversial in the assessment of PE severity and prognosis. The most frequent ECG abnormal morphologies in acute PE are sinus tachycardia, emerging atrial arrhythmia, SIQIIITIII, new onset of right bundle branch block, and ST-T segment changes in leads V1-4.
Geibel et al found that abnormal ECG was an independent predictor of 30-day death. 87 Kostrubiec et al established a ECG scoring model and found it closely correlated with pulmonary hypertension and RVD. 88 However, Escobar et al’s study revealed that ECG abnormalities as a whole was not an independent prognostic factor of PE. 89 Ryu et al found that ECG score correlated with RVD and NT-proBNP rather than cTnI and mortality. 90
The ECG abnormalities as a whole mainly reflect RV dilatation and RVD. 88,90 But its PPV for RVD was generally low. 88,89 There was no clear correlation between ECG and poor prognosis. 63,89,90 The ECG score is too complicated and it lacks uniform standard. These limit the application of ECG in prognostic evaluation of PE. The ECG can be used as an auxiliary tool in diagnostic and prognostic judgments of PE rather than as an independent predictive factor, let alone as a thrombolytic indication.
Shock Index
Blood pressure significantly correlates with the severity of PE. Meanwhile, the systolic blood pressure is closely related to shock index (SI). So SI may have connection with the severity of PE. The 2011 American statement recommended SI > 1 as an indicator of thrombolysis in submassive PE. 11
In Sam et al’s study, although SI had the prognostic value lower than sPESI, it was also related to 30-day death. 24 Otero et al analyzed 6599 patients with PE. They found that SI > 1 was an independent predictor of short-term prognosis and had decreased specificity but had similar PPV and NPV with systolic blood pressure. 91
The SI is related to short-term prognosis. Although there are only a few studies about it, it does not show excellent prognostic value. 24,91 The evidence of using it as a thrombolytic indicator is not adequate.
Some Other Biomarkers
Dimerized plasmin fragment D
Dimerized plasmin fragment D (
Ghanima et al found that
The
Serum Sodium Abnormality
Patients with PE may often be accompanied with malnutrition because of the advanced age and comorbidities. Right heart dysfunction and myocardial injury may cause abnormal secretion of catecholamines and neurohormone. These reasons may lead to serum sodium abnormality.
Chin’s study revealed that plasma sodium significantly correlated with nosocomial death and long-term prognosis. 20 Aujesky et al 21 and Scherz et al 97 found that abnormal serum sodium was an independent predictor of 30-day death in each study.
Abnormal serum sodium demonstrates a certain correlation with short-term 21,97 and long-term 20 prognosis of PE, but its mechanism remains unclear and it has not been widely verified yet.
Indicators of Renal Function
Patients with PE are often accompanied with hemodynamic compromise. Meanwhile, the hypoperfusion may lead to kidney damage. Additionally, the lack of oxygen and the persistent contraction of renal artery, which results from imbalance of catecholamines, may also cause kidney damage. Therefore, patients with PE may merge renal impairment.
Aujesky et al found that blood urea nitrogen >11 mmol/L was an independent predictor of 30-day death in the original study of PESI. 21 In Kostrubiec et al’s study, acute kidney damage also correlated with poor 30-day prognosis in patients with PE. 98 And the correlation was more significant when renal dysfunction was over 72 continuous hours. 99 Uhm et al found that creatinine >1.2 mg/dL significantly correlated with poor long-term prognosis in unprovoked patients with PE. 25
Indicators of renal function correlated with PE severity, 98 and they are valuable in evaluating short-term 9,21,98,99 and long-term 25 prognosis. They have potential advantages in the assessment of PE severity, because they may reflect microcirculation dysfunction more sensitively than blood pressure. But now we expect more researchers to verify their value in PE.
C-Reactive Protein
C-Reactive protein (CRP) is a nonspecific indicator of pathological states, but whether it can reflect severity of PE still remains unclear.
In Uhm et al’s study, CRP >5 mg/L significantly correlated with poor long-term prognosis in unprovoked patients with PE. 25 While in Jeffrey’s study, CRP did not demonstrate an excellent predictive value for RVD and long-term death. 69 Abul also drew a similar conclusion. 100
There is considerable controversy in current studies about the correlation between CRP and PE prognosis. 69,25,100 Elevated CRP is not an excellent indicator of the severity and prognosis of PE, let alone being a thrombolytic indication.
Multiparameter Joint
The above-mentioned studies have shown the complexity of prognostic evaluation of PE, and we have not yet found other single good indicator of prognosis and thrombolysis except hemodynamic status. These make joint detection necessary.
In Kostrubiec et al’s study, the combination of NT-proBNP and cTnT significantly improved the prognostic value of each indicator alone. 34 Ozsu et al also found that such joint was the best predictor of 30-day death. Its PPV was even up to 64%. 101 Zhu et al, 65 Kucher et al, 102 and Kang et al 52 found that PPV was further improved, but NPV was unaffected when cTn was combined with imaging detections.
Dellas et al, 16 Lankeit et al 81 , and Puls et al 70 found that the combination of H-FABP and some other indicators could significantly improve each PPV and hazard ratio.
Singanayagam et al, 27 Spirk et al, 30 and Lankeit et al 31 found that the combination of sPESI or PESI and cTn further improved each prognostic value alone.
Appropriate joint detection could further improve the prognostic value of various parameters, especially increased PPV significantly and left NPV unaffected. 16,30,34,65,31,81,70,101,102,52 Current major joint approaches are the combinations of BNP and cTn, 34,101 BNP and imaging detections, or the combination of cTn and imaging detections. 65,102,52 The H-FABP and GDF-15 demonstrate excellent value in joint detection as emerging biomarkers, 16,17,81,70 but they need to be verified by more studies. The PESI and sPESI seem to be able to complement biomarkers or imaging parameters. Such combinations improve prognostic values, especially the value of all-cause and long-term prognosis. 27,30,31 But the best joint method is still unclear and it lacks effective verification of large samples.
Results
We summed up a total of 16 prognostic factors of PE and divided them into 9 categories. Each parameter has different prognostic value, respectively.
Among these parameters, the basic status, PESI or sPESI, RVD in echocardiography or CT, BNP or NT-proBNP, cTn, H-FABP, Pa
The RVD in echocardiography or CT, BNP or NT-proBNP, cTn, and H-FABP can reflect circulation dysfunction in a degree, and all significantly correlate with short-term prognosis. The Pa
But echocardiography and CT have complex morphologies and are easily influenced by subjective factors such as experience of operators. There are very close correlations between BNP, cTn, H-FABP, and imaging presence of RVD. And these biomarkers demonstrate more significant relationships with short-term prognosis than imaging detections do. So imaging the presence of RVD maybe replaced by these biomarkers in evaluating PE severity. However, BNP or NT-proBNP, cTn, and H-FABP, especially BNP or NT-proBNP, have low PPV. The cTn is obviously affected by detection time window. The combination of BNP or NT-proBNP, cTn, and H-FABP did not reduce NPV but significantly improved PPV even up to the mortality of massive PE. Hence, the combination of these biomarkers is the most excellent candidate indicator of short-term prognosis and thrombolysis.
Indicators that are more suitable to reflect overall status and long-term prognosis are basic status, PESI, or sPESI score. The PESI and sPESI are convenient and noninvasive. They can be used as complements of indicators of PE severity such as BNP and cTn to evaluate all-cause and long-term prognosis, but it is not appropriate to use them as thrombolytic indications. The PESI and sPESI have excellent value in identifying low-risk group even being as indicators of outpatient treatment because of their very high NPV.
Discussion
The prognosis of PE is influenced by both the severity of PE and the base case. Severity of PE largely influences PE-related events and short-term prognosis, 13,14,15 but the overall risk and long-term prognosis significantly correlate with concomitant diseases. 14,16 –18 So we should evaluate prognosis of PE based on 2 aspects. In fact, both the 2008 ESC guidelines and the 2011 American Statement stratified PE are based on mere severity and short-term prognosis. They cannot reflect the overall and long-term risk. 10,11
We should take heparin and aggressive treatments such as thrombolysis according to the severity of PE. Meanwhile, we also need to take integrated managements including treatment of comorbidity and intensive monitoring measures for overall risk.
Since short-term deaths are mainly influenced by the mere severity of PE and treatment programs, we should first grade patients according to the severity of PE. We should still identify massive PE based on hemodynamically unstable status, because these kind of patients have a very high mortality rate. 7,9,10,12 And then we should divide other patients into submassive PE and nonmassive PE.
As we have summarized, RVD in echocardiography or CT, BNP or NT-proBNP, cTn, and H-FABP could better reflect the mere severity of PE. But echocardiography and CT have complex morphologies and difficult manipulation. There is an extremely close relationship between BNP, cTn, H-FABP, and imaging presence of RVD and myocardial damage. 16,34,51,64,72,73,68,69,76,80,83,70 Compared with imaging detections, these biomarkers demonstrate higher value in predicting short-term prognosis. Patients with negative biomarkers but positive imaging presence still had very low risk, because 3 biomarkers all had very high NPV and they did not show lower PPV than imaging detections. Meanwhile, they are more convenient and objective. So we suggest BNP or NT-proBNP, cTn, and H-FABP as the most excellent indicators of mere severity and short-term prognosis of PE. They might replace imaging detections in evaluating PE severity. Echocardiography and CT can be mainly used to identify primary heart diseases and discover patent foramen ovale and right heart emboli. 43,44,45
Patients with all negative results of BNP, cTn, and H-FABP can be safely divided into nonmassive PE, because their NPVs are very high. Patients between massive and nonmassive PE are submassive. This part of patients still have a relatively high mortality, 13,7,8 while thrombolysis is facing the risk of bleeding. 13,7,8,15 So management of this part of patients is the most difficult issue. Since all of BNP, cTn, and H-FABP do not have satisfying PPV, we cannot use a single biomarker as the indication of thrombolysis. The combination among the 3 biomarkers significantly improved PPV even up to mortality of massive PE and might serve as indicators of thrombolysis. 16,34,81,70,101 So in submassive PE, patients who have only 1 positive performance among BNP or NT-proBNP, cTn, and H-FABP should be classified into nonsevere submassive subgroup; and patients who have any 2 or all 3 positive results should be classified into severe submassive subgroup and be considered as thrombolytic candidates. Additionally, we should detect cTn after 6 to 8 hours symptom onset to improve accuracy because of its detection time window. 16,71,70
The PESI and sPESI score may reflect the overall risk and long-term prognosis. They can be used as complements of indicators of the PE severity. 27,30,31 What is more, their NPV is very high, which means that they have excellent value in identifying low-risk group. 19,21,22,23,24,26,27,28,30,32,33,31 In order to further stratify low-risk and high-risk subgroups and decide the comorbidity treatment and intensive care based on each subgroup, we may integrate PESI or sPESI into risk stratification of massive, submassive, and nonmassive PE.
So PESI or sPESI can further stratify nonmassive PE. Patients in low-risk subgroup according to PESI or sPESI can even be considered as outpatient treatment candidates, while high-risk patients should still stay in hospital. We can also further divide submassive patients into subgroups of low risk and high risk except for nonsevere and severe submassive subgroups. So we hypothesize that patients with submassive PE can be divided into 4 subgroups according to BNP, cTn, H-FABP, and PESI or sPESI: A = nonsevere low-risk submassive subgroup, B = nonsevere high-risk submassive subgroup, C = severe lowrisk submassive subgroup, and D = severe high-risk submassive subgroup (see Table 4).
Subgroups of Patients With Submassive Pulmonary Embolism.
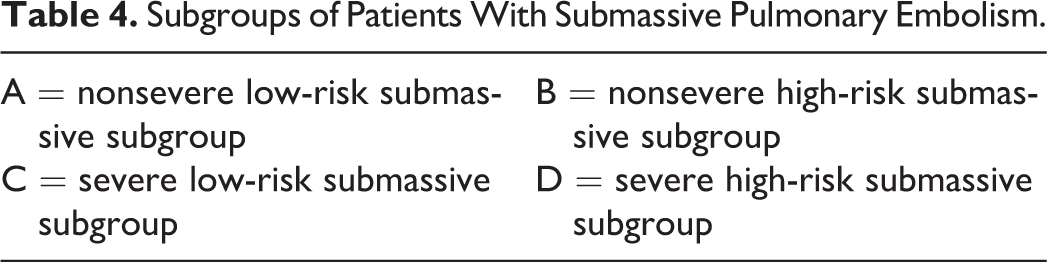
Then, we should take different management strategies based on the above-mentioned integrated risk stratification. We should actively give aggressive treatments such as thrombolysis to patients with massive PE if there are no significant contraindications due to high mortality rate and benefits from thrombolysis. 9,10,12,7 We suggest treating patients with nonmassive PE using heparin because of its very low risk, and we should further assess possibility of outpatient treatment based on PESI or sPESI. For patients with submassive PE according to the above-mnetioned stratification, subgroup A should accept heparin treatment because of low risk; subgroup B needs comorbidity treatment, intensive care, and more attention to long-term follow-up except for heparin treatment because of the low severity of PE but poor general status; subgroup C is the appropriate candidate for thrombolytic therapy if no contraindications are present; subgroup D also adapts to thrombolysis but because of the increased risk of bleeding due to poor general status, we should make the decision to decide thrombolysis or not after comprehensive risk assessment and pay more attention to underlying diseases and integrated management.
We summarize an algorithm based on the above-mentioned analysis in Figure 1. We expect more researchers to verify this algorithm.
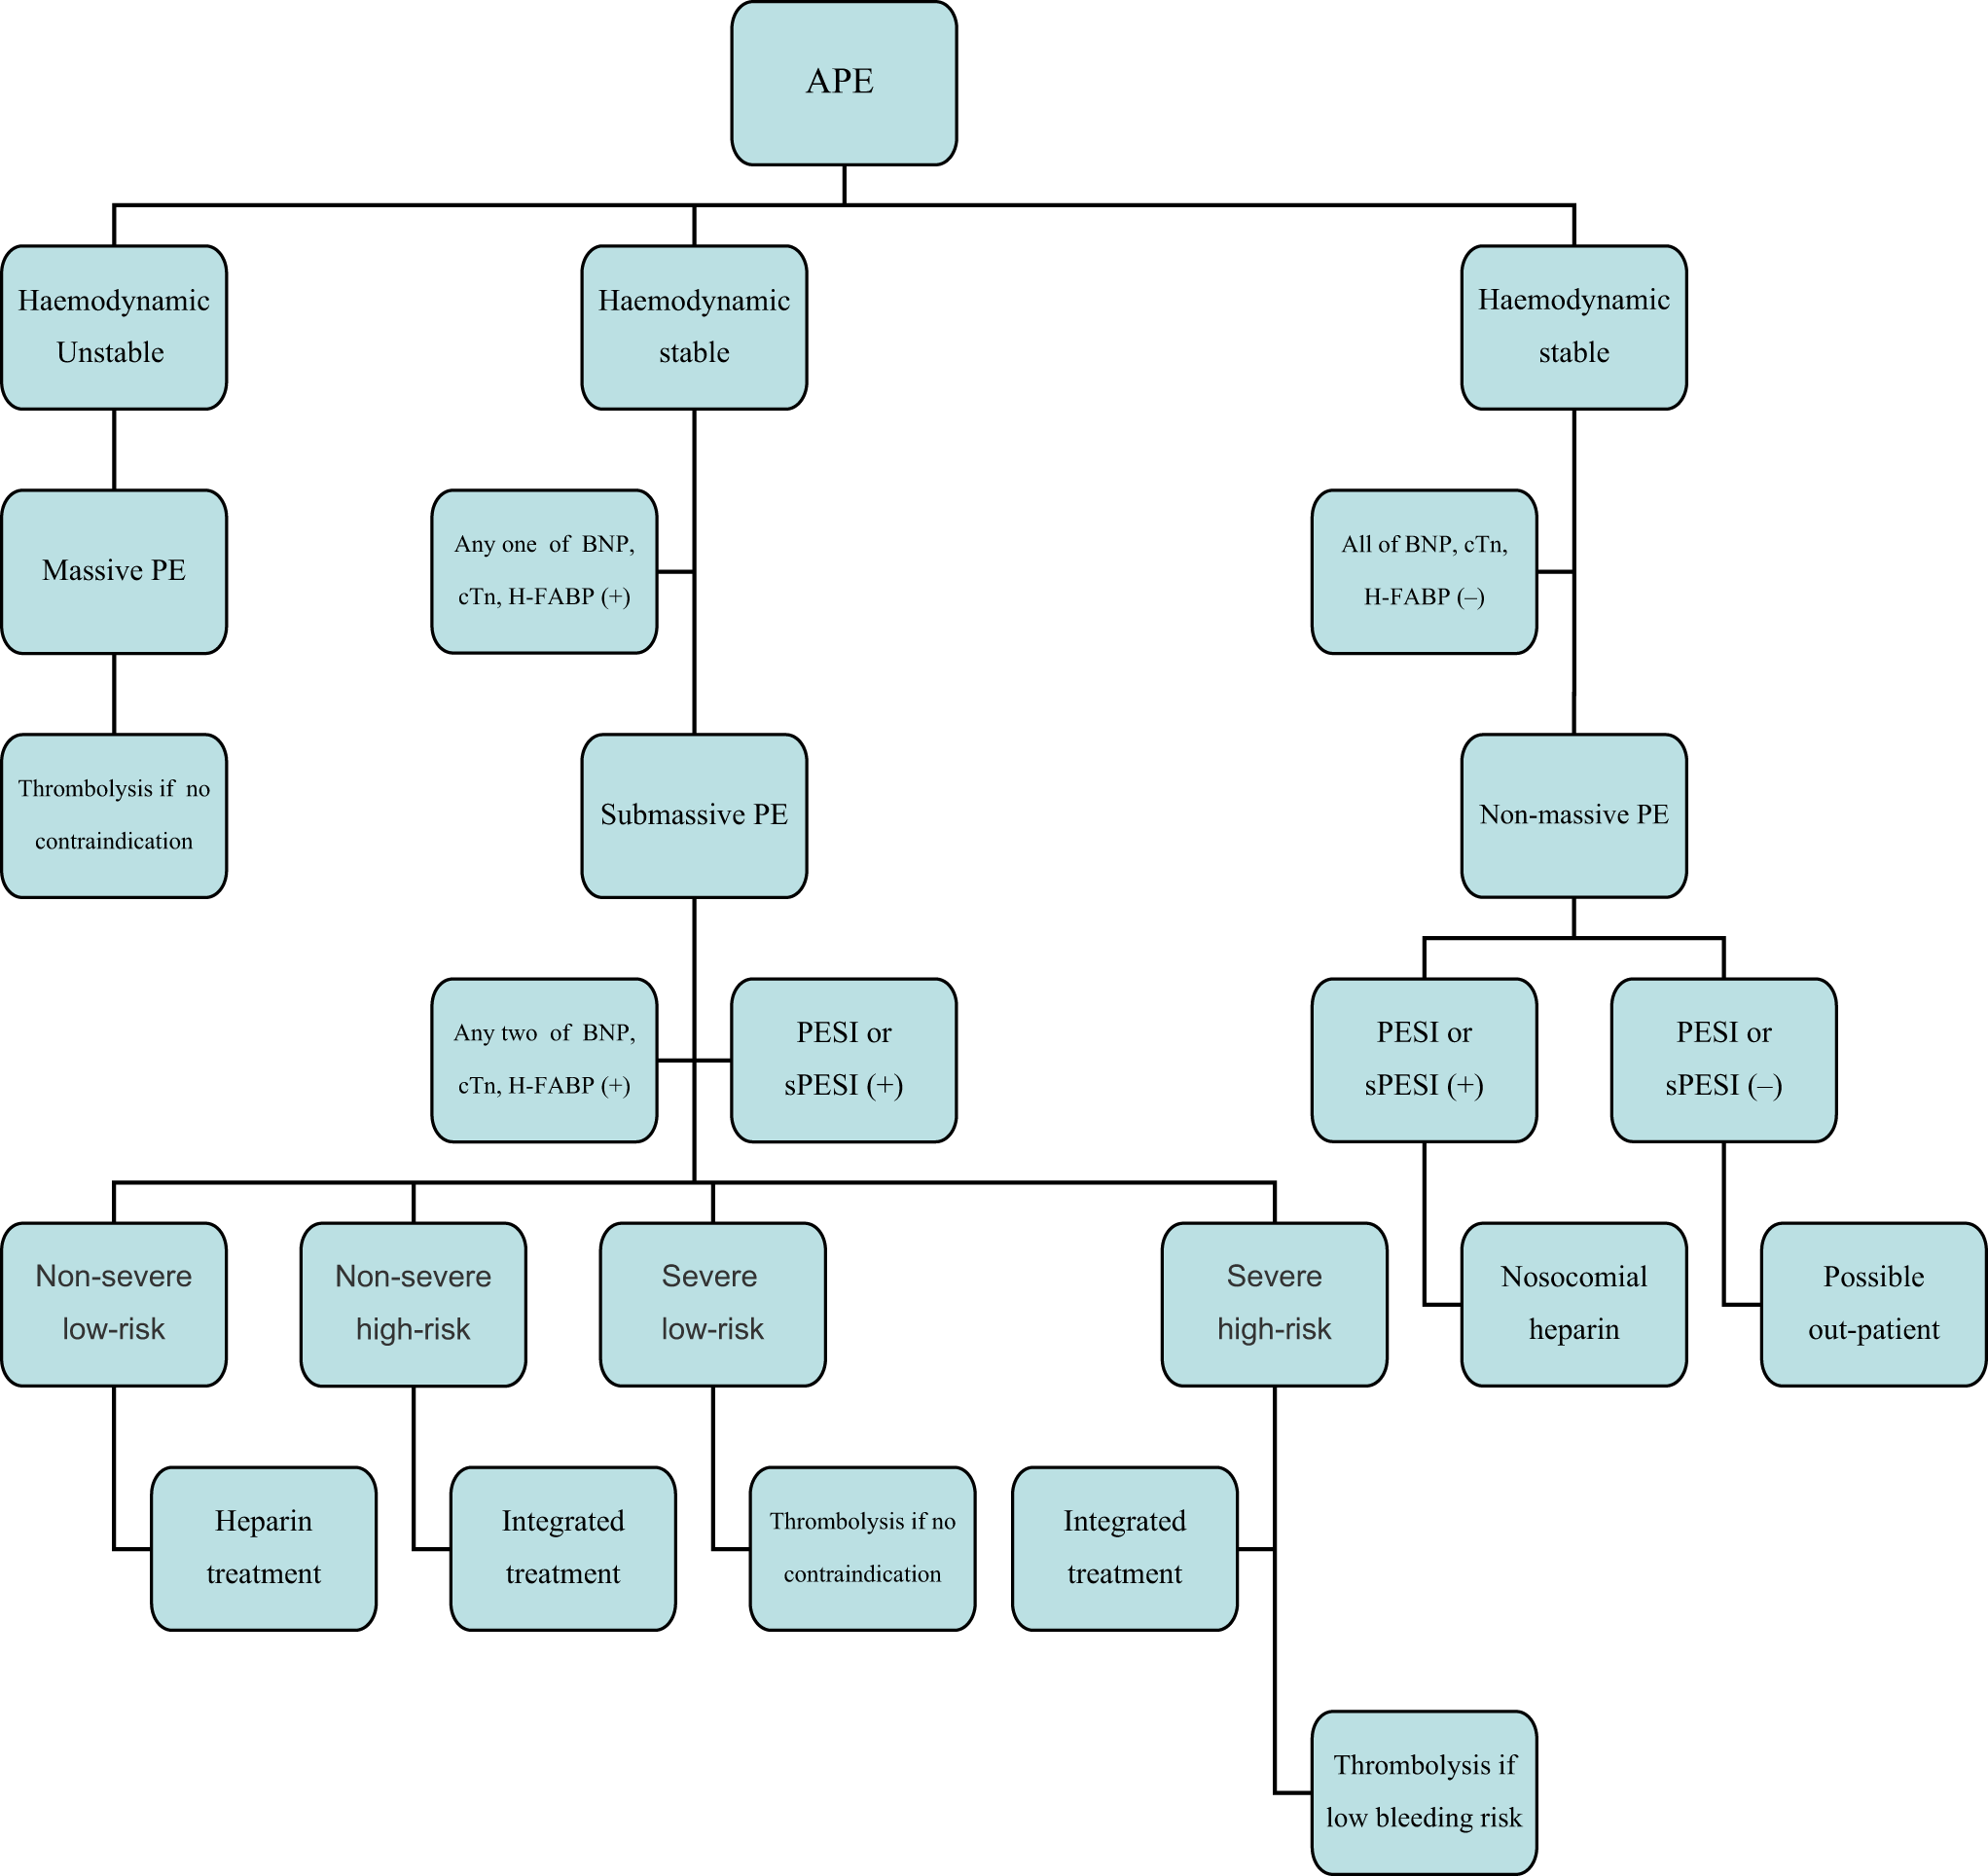
An algorithm of stratification and management of acute pulmonary embolism. APE indicates acute pulmonary embolism; BNP, brain natriuretic peptide, BNP comprises BNP and NT-proBNP; cTn, troponin; H-FABP, heart-type fatty acid binding protein; PESI: pulmonary embolism severity index; sPESI, simplified pulmonary embolism severity index.
Conclusions
The prognosis of PE is influenced by both the severity of PE and the basic situation. The mere severity of PE largely influences short-term prognosis, while the basic situation has great impact on the overall risk and long-term prognosis. The BNP or NT-proBNP, cTn, and H-FABP are the best indicators in reflecting the mere severity of PE and short-term prognosis, and they could possibly replace the imaging detections in evaluating PE severity. But their PPV is low and they require joint detection. The PESI or sPESI has high value for all-cause and long-term prognosis. Hence, we could integrate them into the risk stratification of PE. We should establish integrated risk stratification and management strategies based on the above-mentioned indicators.
Footnotes
Declaration of Conflicting Interests
The author(s) declared no potential conflicts of interest with respect to the research, authorship, and/or publication of this article.
Funding
The author(s) received no financial support for the research, authorship, and/or publication of this article.